1. Introduction
Rapid changes in the global environment due to climate change have resulted in a continuous increase in natural disasters. In fact, the frequency and intensity of natural and social disasters are increasing all over the world and damages caused by disasters continuously occur in Korea as well [1–3]. Historically, floods have been one of the most common natural disasters worldwide, including in Korea [4–5]. However, in 2016, Korea experienced the largest earthquake in its recorded seismic history, the Gyeongju earthquake, with a magnitude of 5.8. The following year, in 2017, another large-scale earthquake with a magnitude of 5.4, the Pohang earthquake, occurred. These two earthquakes emphasized the importance of preparing for various types of natural disasters, including earthquakes, in addition to floods. These disasters can cause significant damage to the country's infrastructure and communities, making it crucial to have comprehensive disaster preparedness plans in place.
Environmental facilities are crucial for maintaining a healthy and sustainable city, and they are closely linked to other infrastructure systems. If a wastewater treatment facility (WWTF) is damaged by a disaster, it could severely affect social and economic systems, leading to paralysis [6]. For example, if a drinking water treatment facility fails due to a disaster, it could result in a social catastrophe and massive damage. This is due to the suspension of tap water supply and the shutdown of industrial facilities, among other things. Similarly, if a WWTF is damaged and a large quantity of pollutants is released, it could harm the surrounding ecosystem or contaminate the water system, as documented in several studies [7–9].
The following are typical examples of damage to environmental facilities caused by natural disasters in Korea. In September 2003, lots of environmental facilities in Korea were flooded because of typhoon ‘Maemi’ and secondary damages such as river flooding and flooding over industrial complexes occurred due to capacity limitations and/or shutdowns of drainage pump stations in Daegu Metropolitan City. In July 2006, the landslide triggered by heavy rains in the Gangwon region caused damage to the facility and mechanical equipment of the Naegosa water intake station and drinking water treatment facilities in Jeju Island was flooded caused by typhoon ‘Nari’ in September 2007. Drinking water treatment facilities and WWTF were damaged due to heavy rain in the central region of Korea in 2011. In October 2016, typhoon 'Chaba' caused a power outage at five drinking water facilities in Jeju Island. Due to the Pohang earthquake in November 2017, 45 water pipe leaks occurred, and a number of drinking water treatment facilities and WWTF were damaged [10].
Korean and local governments put efforts to prepare and continuously improve systems to respond to disasters based on the experience of previous disasters. However, as mentioned above, most of the damages to environmental facilities caused by natural disasters in Korea were caused by floods due to heavy rain accompanied by typhoons, so environmental facilities in Korea have various countermeasures against floods but plans against disasters other than floods such as earthquakes and large-scale blackouts are insufficient.
In disaster response, not only a physical response (structural response) that prepares a building or mechanical countermeasure, but also a non-structural response to identify the extent of damage and prompt recovery is essential. In order to prevent the spread of damage as well as recover damages quickly, it is greatly important to predict the extent of damage when disasters have occurred since it serves as a basis for prompt response to disasters. As the importance of prediction in disaster response is increasing, the disaster management system is also shifting from response and recovery to prevention. Therefore, many countries are establishing a holistic disaster response system focused on prevention, breaking away from the traditional disaster response and recovery strategy.
In this study, the effect of untreated effluent discharged into the natural water system was simulated using the QUAL2E model for situations where normal operations of WWTF were difficult due to damages of disasters. The result of the study might be used as part of non-structural responses for appropriate responses when a disaster occurs since appropriate countermeasures to the disaster could be developed by predicting the extent of damage due to the failure of WWTF in the event of a disaster.
2. Materials and Methods
2.1. Study Area
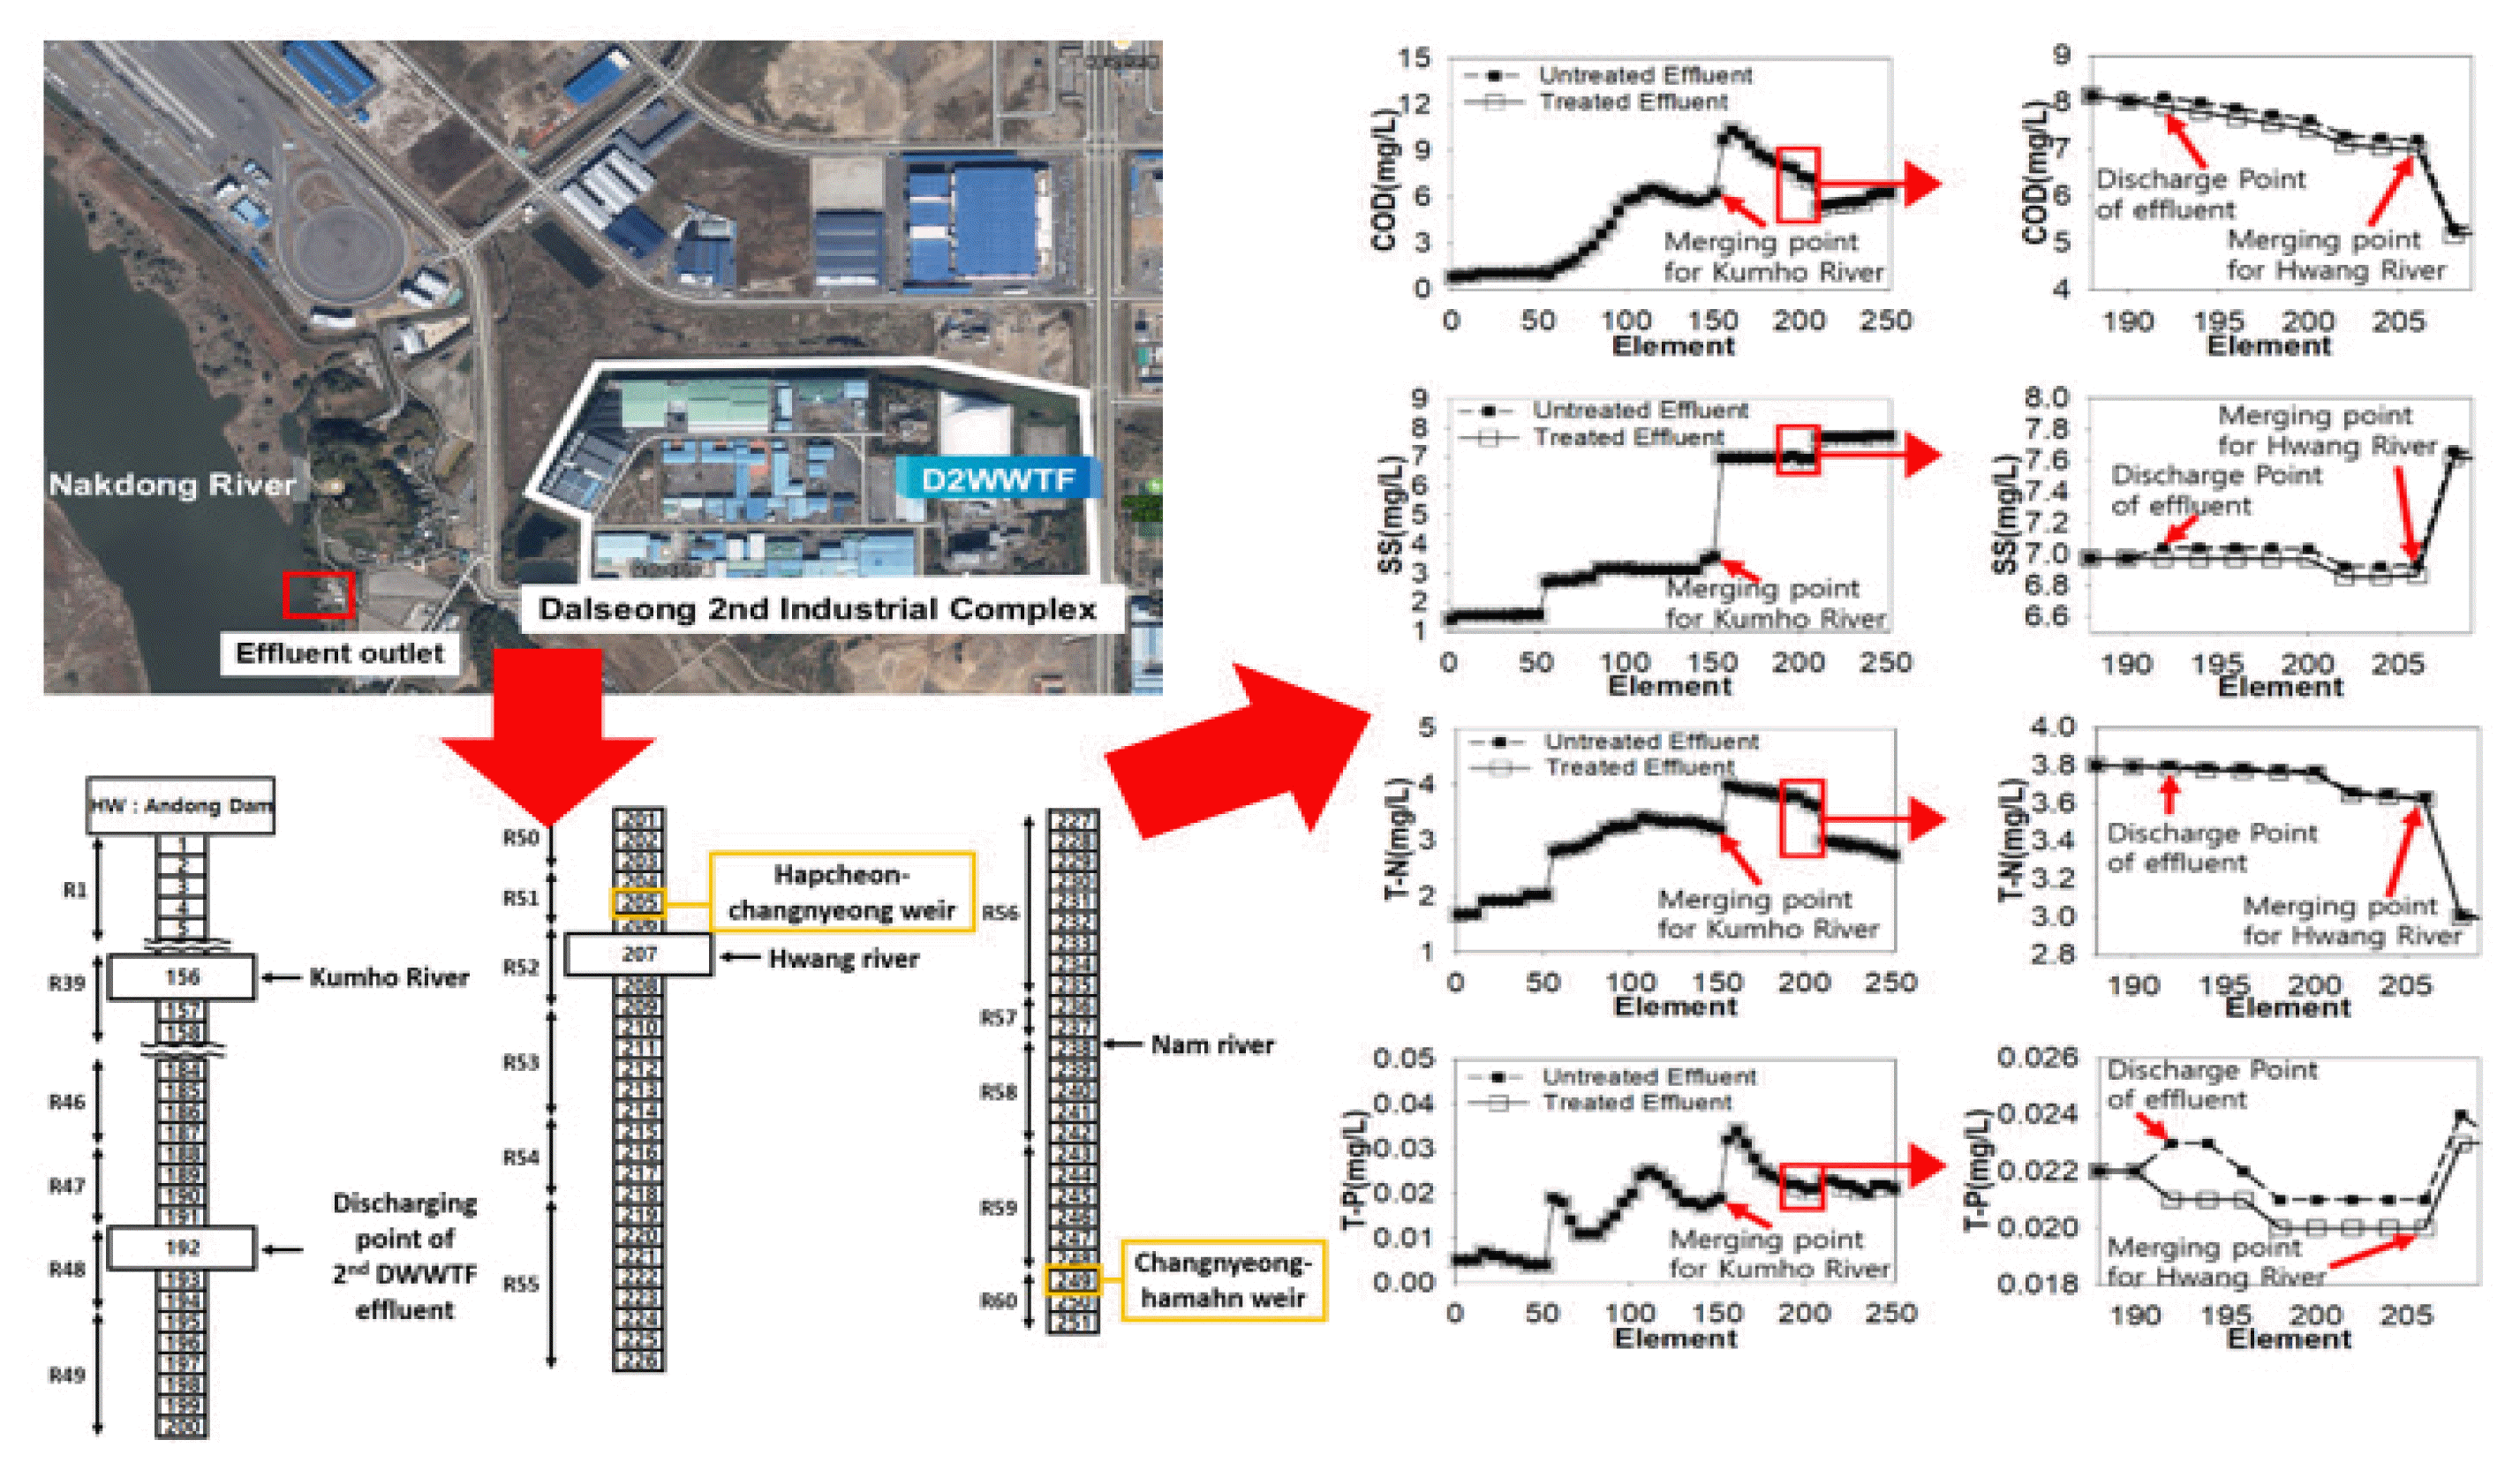
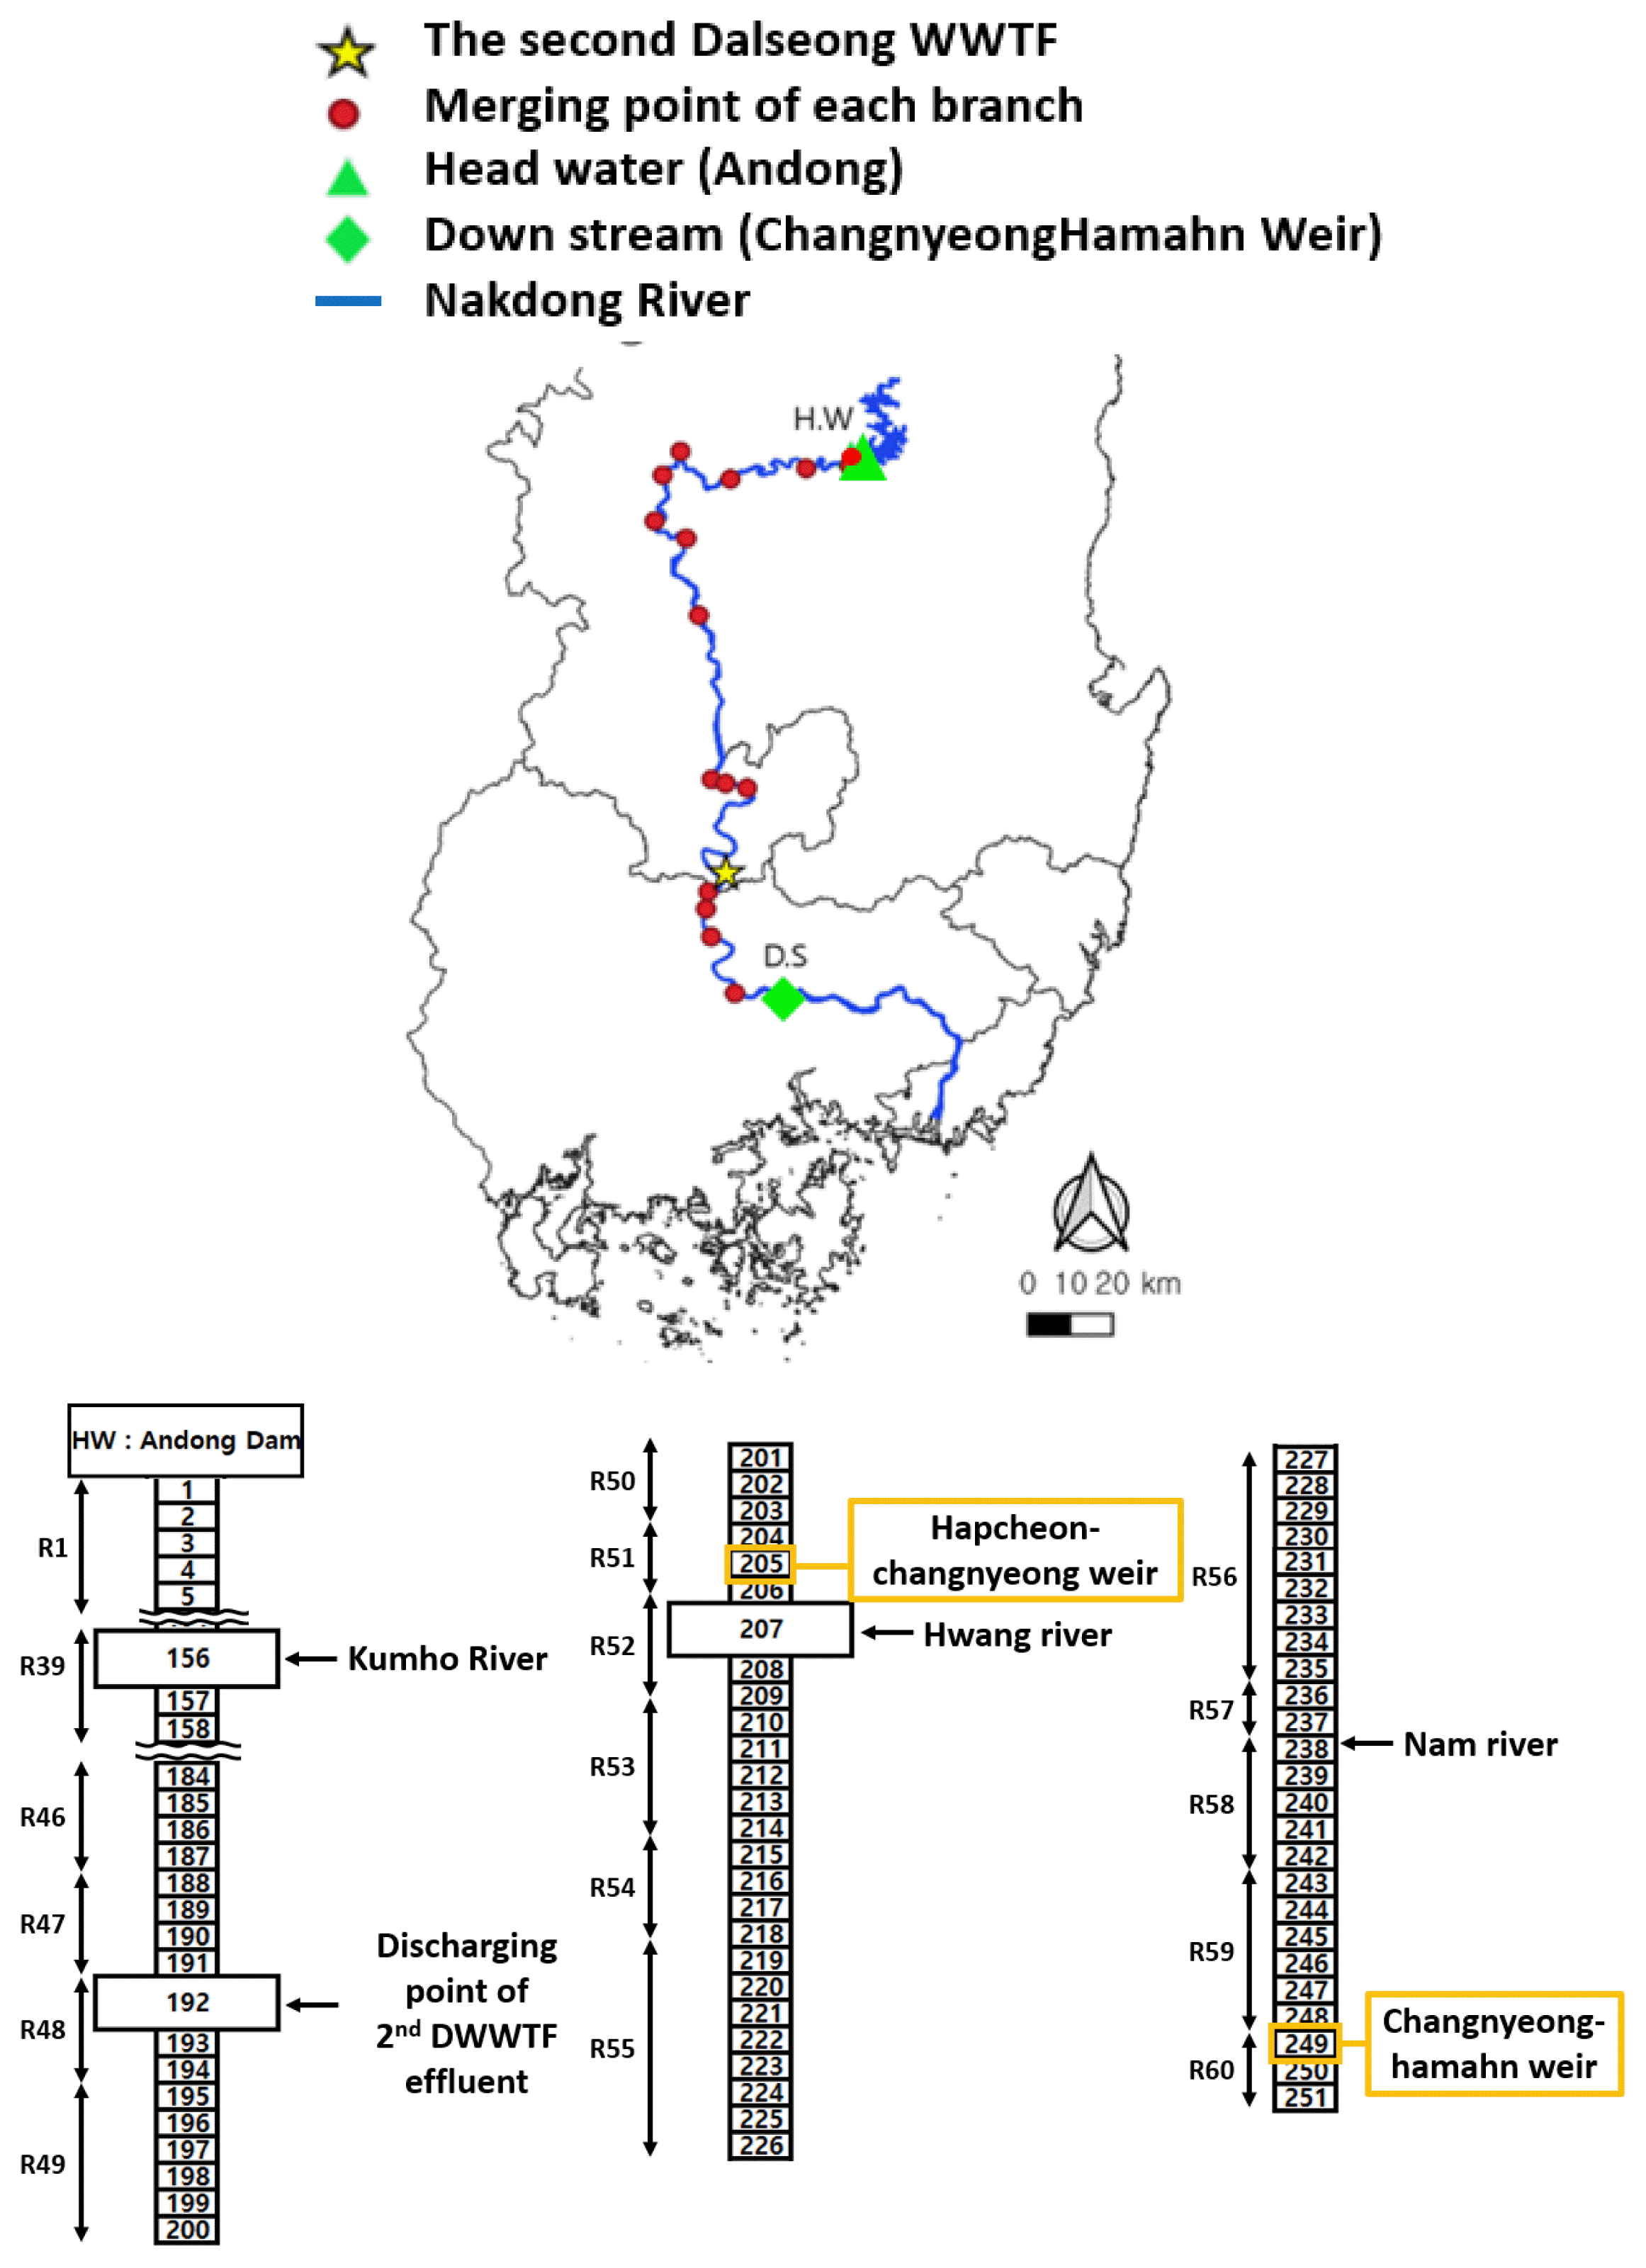
QUAL-2E modeling was performed at the middle of Nakdong River, where the effluents from the second Dalseong WWTF flow into. The second Dalseong WWTF is the wastewater treatment plant for the second Dalseong Industrial Complex located in Daegu Metropolitan City, South Korea. The main process for the second Dalseong WWFT is the activated sludge process with a design capacity of 4,000 m3/day, but the actual flowrate is 2,500 m3/day. The effluent from the second Dalseong WWTF flows directly into the Nakdong River through an underground pipeline as shown in Fig. 1, so the simulation was performed to focus on the point where the effluent flows in.
Due to the characteristics of the QULA2E model, it is better to simulate the entire river, but the actual simulation focused on the middle section of the river, from Andong Dam to Changryunghaman Weir. This is because the Nakdong River shows big differences in the water quality and quantity between upstream, to the Andong Dam located in the middle of the river and downstream, from the Dam to the outlet of the river. Fig. 2 shows the stream network, elements, and reaches of the QUAL2E simulation.
2.2. QUAL2E
The QUAL2E model, developed by US EPA, is a one-dimensional steady-state model mainly used to simulate river’s water quality. Currently, the QUAL2E model is being used as a water quality model module of BASINS, a program for checking TMDL (Total Maximum Daily Load) implemented by the US EPA and is widely used worldwide [11–13]. The QUAL2E model considers advection and diffusion as a material transport process, assumes that it occurs in a one-dimensional flow direction, and predicts water quality changes by considering the inflow of pollutants as well as tributaries and outflow due to intake.
For simulation using QUAL2E, rivers are divided into n large intervals, so called Reach, and each interval is considered to have uniform mathematical properties. Each large interval is further divided into smaller intervals (computational elements) having a constant length. For each divided interval, hydraulic and topographic characteristics such as river slope and longitudinal cross-sectional area, and chemical characteristics such as BOD decomposition rate, sediment dissolution rate, nitrogen oxidation rate, etc. are set uniformly. The calculation elements of the QUAL2E model can be classified into eight categories as shown in Table S1 and there are a total of 13 items such as temperature, dissolved oxygen, BOD, algae (expressed in chlorophyll), and non-conservative substances [14]. The water quality data used in the simulation were obtained from the Water Environment Information System operated by the Korean Ministry of Environment [15].
3. Results and Discussion
3.1. Calibration and Validation for QUAL2E Model
Fig. S1 shows the results of model calibration. Calibration results for COD and SS concentrations showed slight under-estimation and the error value, Root Mean Square Error (RMSE), was 1.7270 and 2.2774, respectively. Simulations for COD and SS were dependable based on RMSE since the ranges for COD and SS concentrations were 4.8~8.5 mg/L and 3~13.8 mg/L, respectively. On the other hand, calibration results for T-N and T-P showed slight overestimations and RMSE for T-N and T-P were 0.3745 and 0.0185, respectively. Simulations for T-N and T-P were also reasonable since the ranges of T-N and T-P were 2.0~3.6 mg/L and 0.042~0.134 mg/L, respectively.
Fig. S2 shows the results of model validation. Validation processes for COD and T-P concentrations showed better results than calibration processes for those factors in terms of RMSE, 1.592 and 0.0179, respectively. In terms of RMSE, validation processes for SS and T-P concentrations showed slightly higher values compared to RMSEs for calibration processes for those values, but the results for validation processes for SS and T-N concentrations were still rational if considered to ranges of observation for those factors.
3.2. Simulation with the Discharge of 2,500 m3/day for Effects of Untreated Effluent on the River
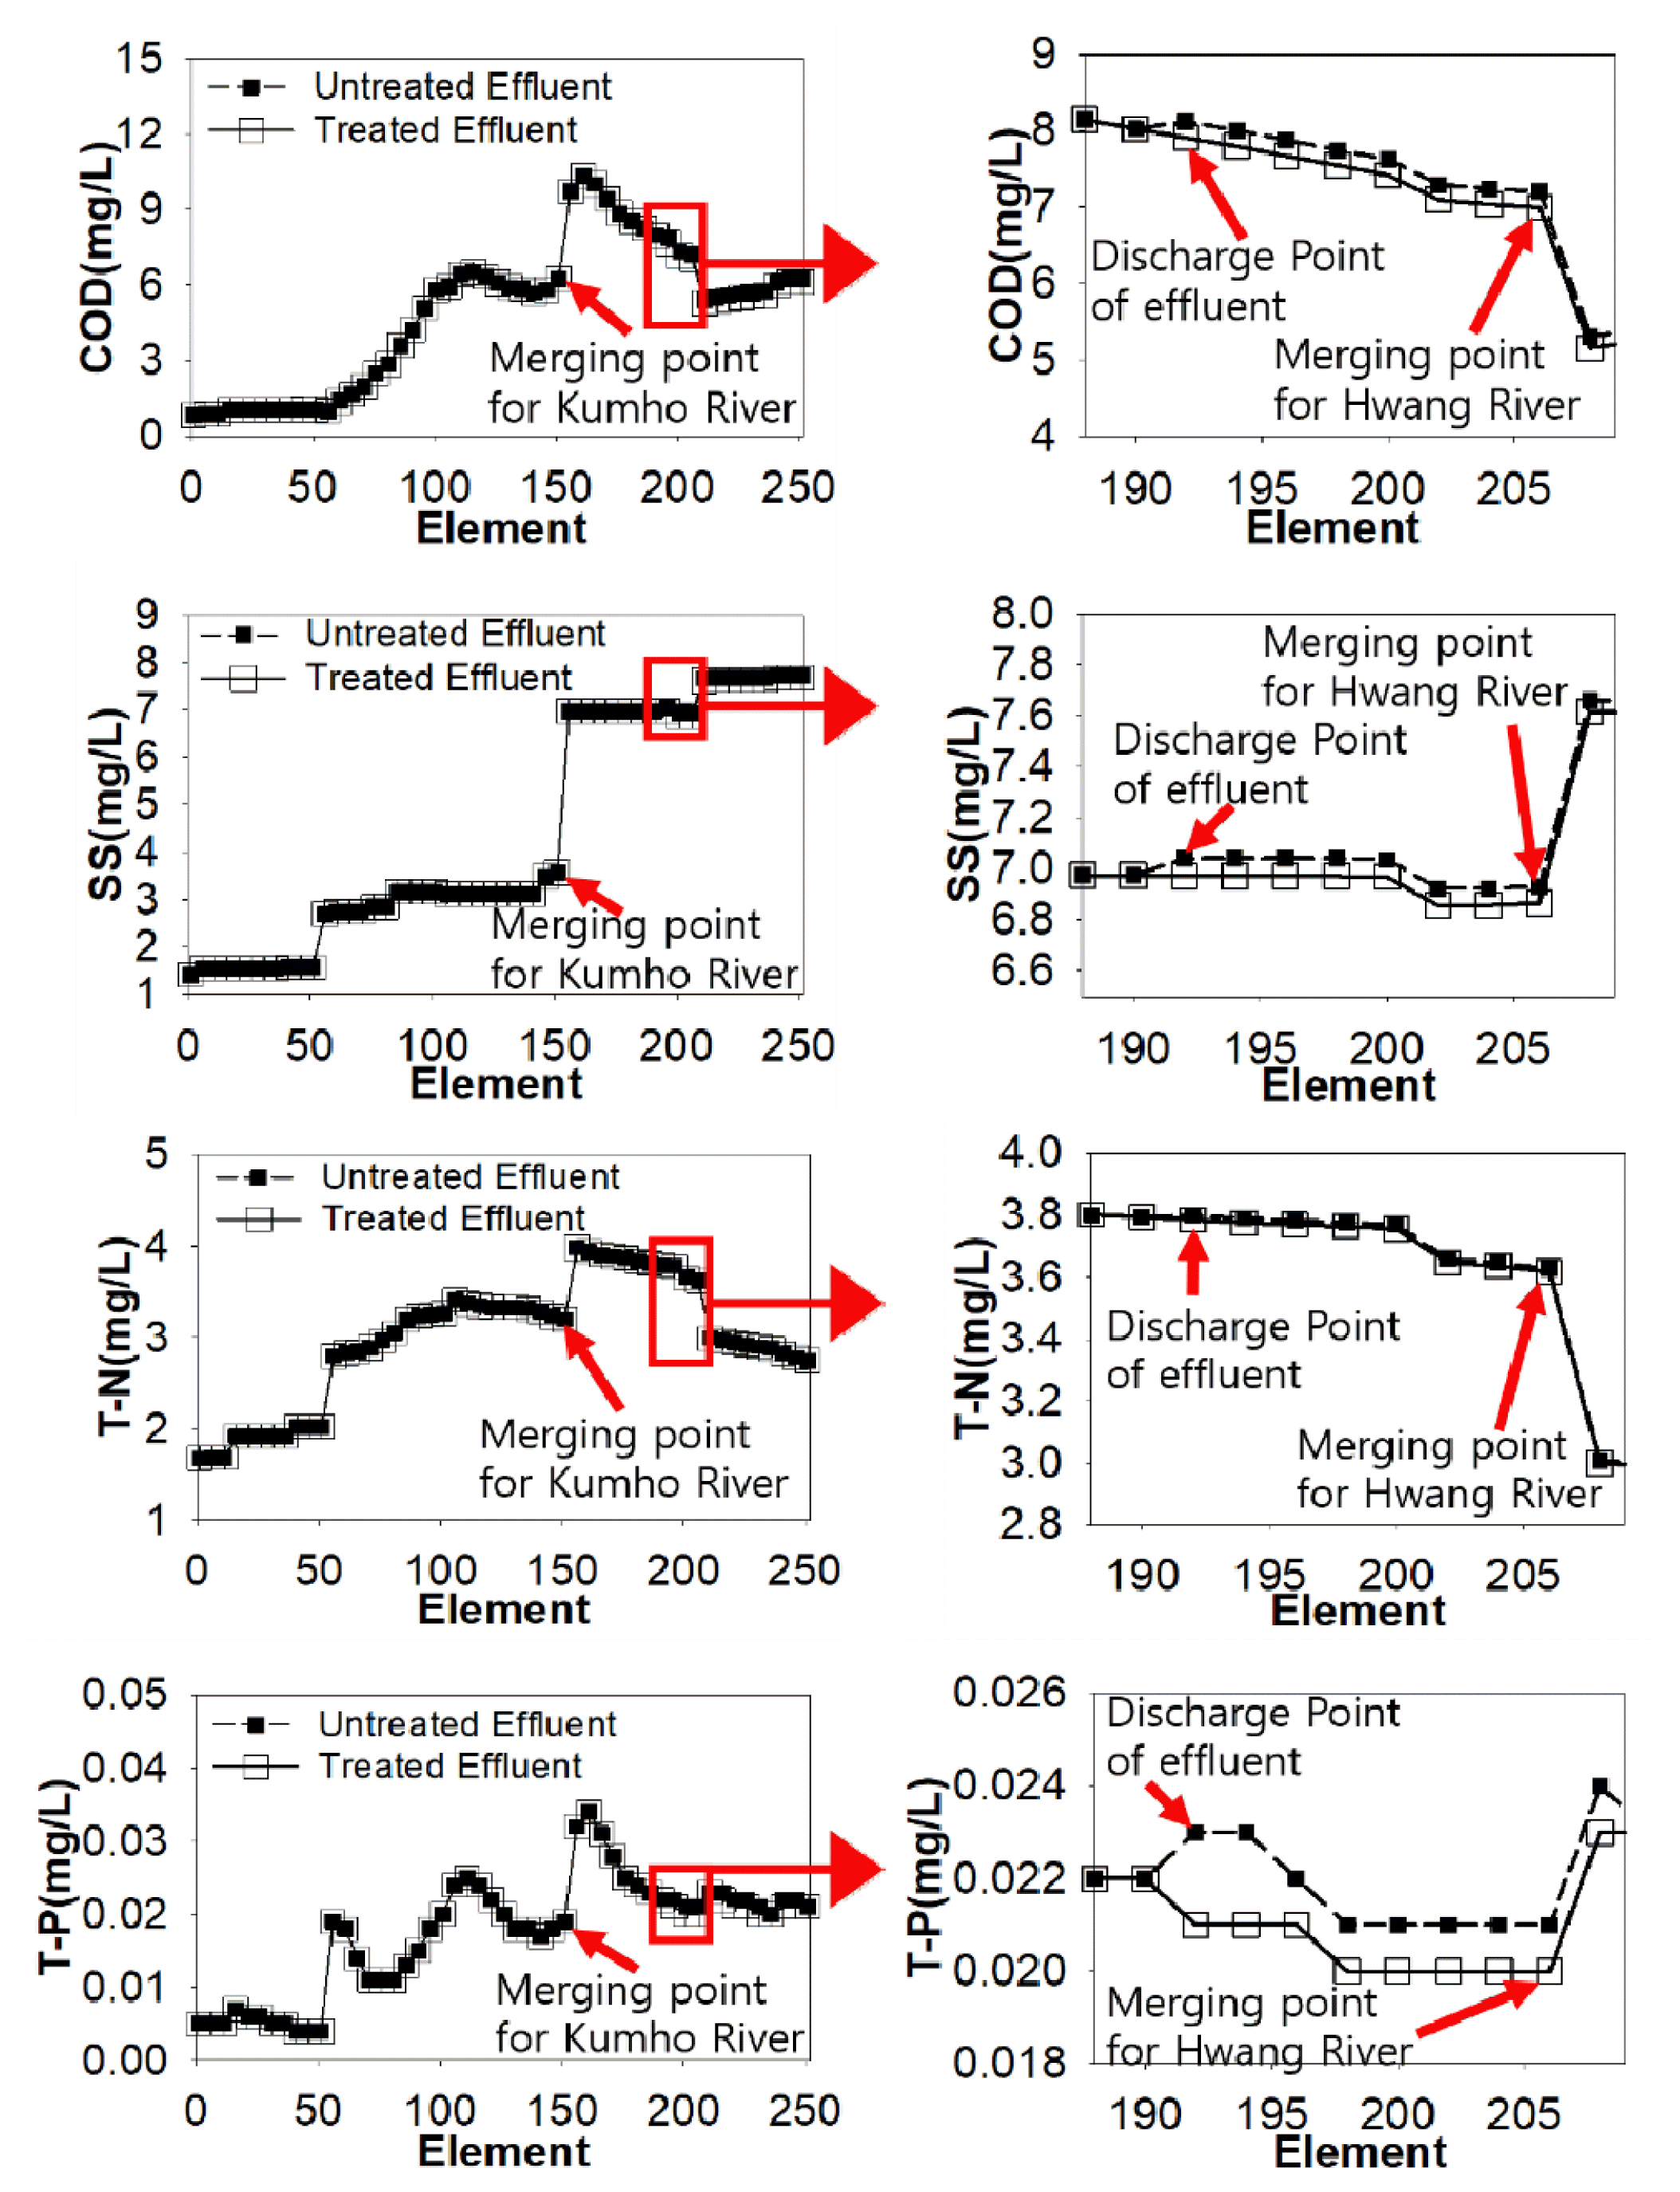
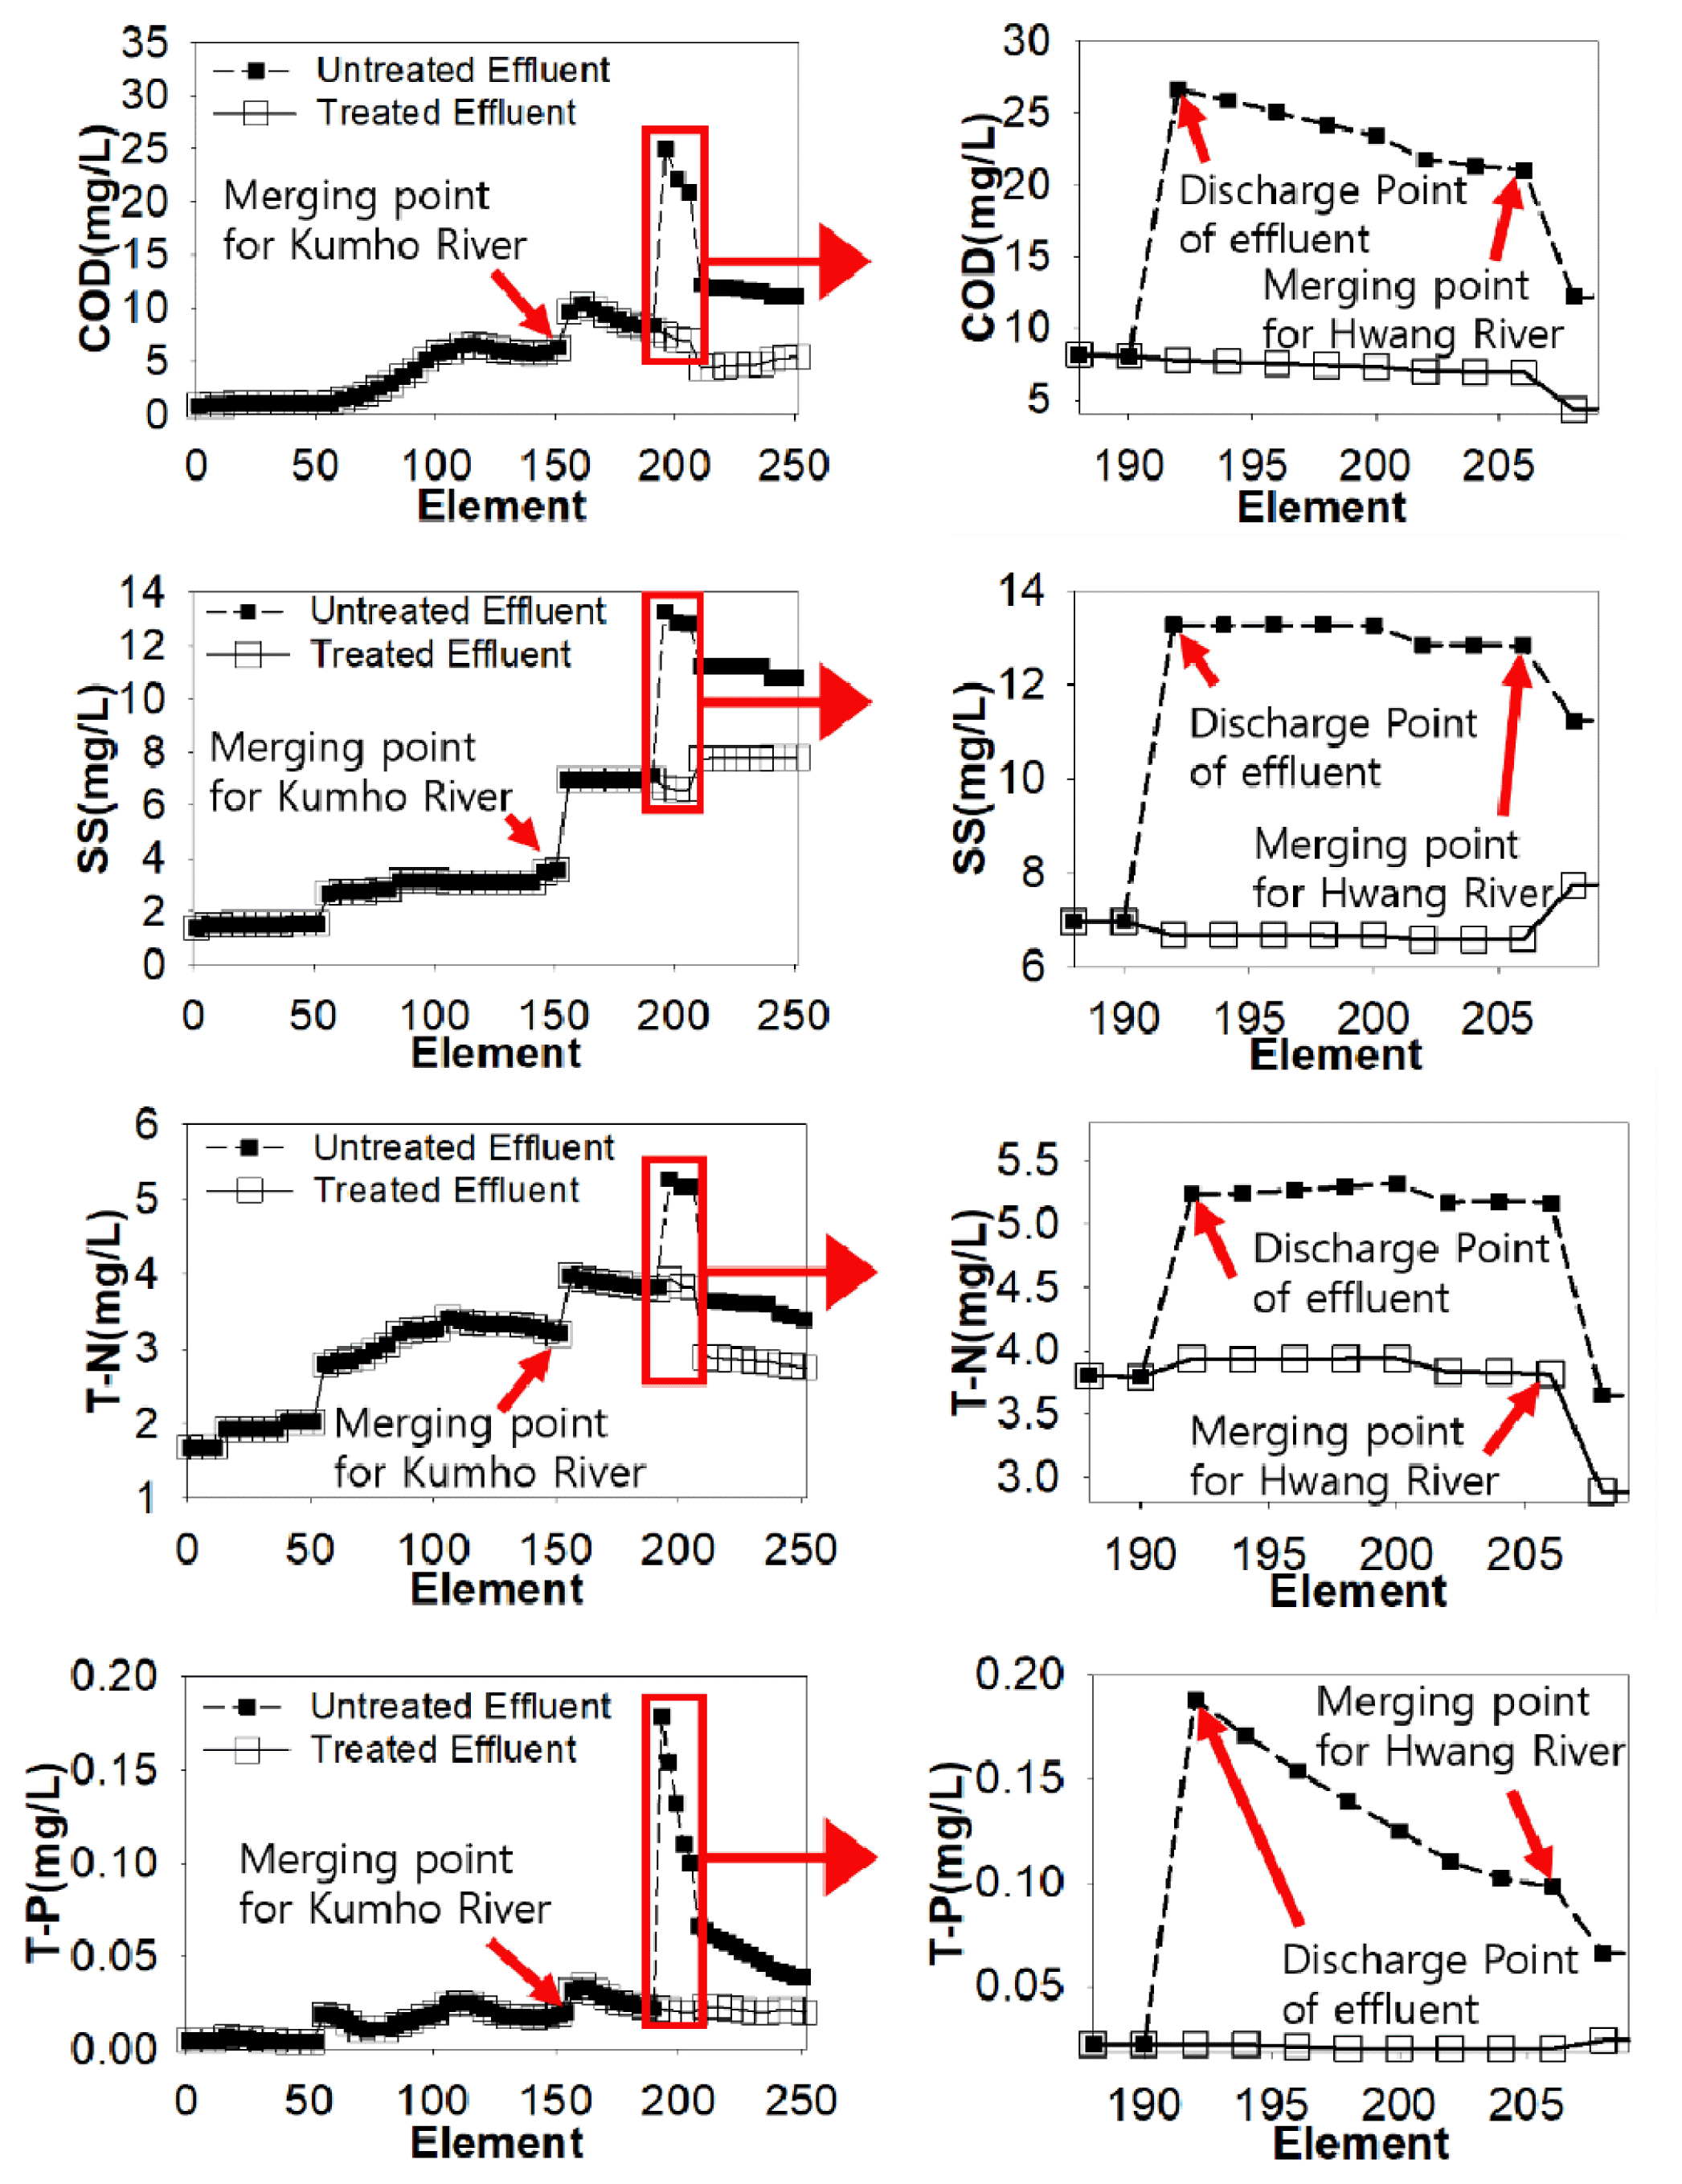
Fig. 3 shows simulation results with 2,500 m3/day of effluent and compares the effects on the river between discharging treated effluent and discharging untreated effluent. Four water quality factors – Chemical Oxygen Demand (COD), Suspended Solids (SS), Total Nitrogen (T-N), and Total Phosphorus (T-P) – were selected to evaluate the performance of the simulation.
As shown in the figure, the tributaries, Kumho River and Hwang River, flowing upstream or downstream from the inflow point of discharge from the 2nd Dalseong WWTF had a great influence on the water quality of the Nakdong River. On the other hand, untreated effluents with system failure resulted in damage from disaster and did not have a substantial impact on the river. More specifically, after untreated effluent was introduced, COD and SS concentrations of the river were not seriously changed, and T-N concentrations of the effluent were not affect the river’s T-N concentration at all. The river's water quality was not greatly affected by untreated wastewater inflow because the effluent flowrate (2,500 m3/day) was much lower than the river flowrate (4,607,700 m3/day).
T-P concentrations were the only factor which concentrations were slightly increased after untreated effluent discharged to the river and higher T-P concentrations last at the end of the simulation period even with a big difference between the amount of effluent and the flowrate of the river. The results are due to the much lower T-P concentration of the Nakdong River, 0.022 mg/L, compared to that of effluent, 3.4 mg/L. All WWTF in Korea established additional T-P treatment systems because the Korean government adopted the new regulation, Total Daily Maximum Load (TMDL) for T-P concentration, on the river system since 2010, resulting in very low T-P concentrations in rivers. The level of T-P concentration for the effluent was 154.5 times higher than that for the Nakdong River while other factors showed relatively small differences, 10 times difference for COD, 18.5 for SS, and 8.3 for T-N.
3.3. Simulation with Increased Discharge of the Original Flowrate for Effects of Untreated Effluent on the River
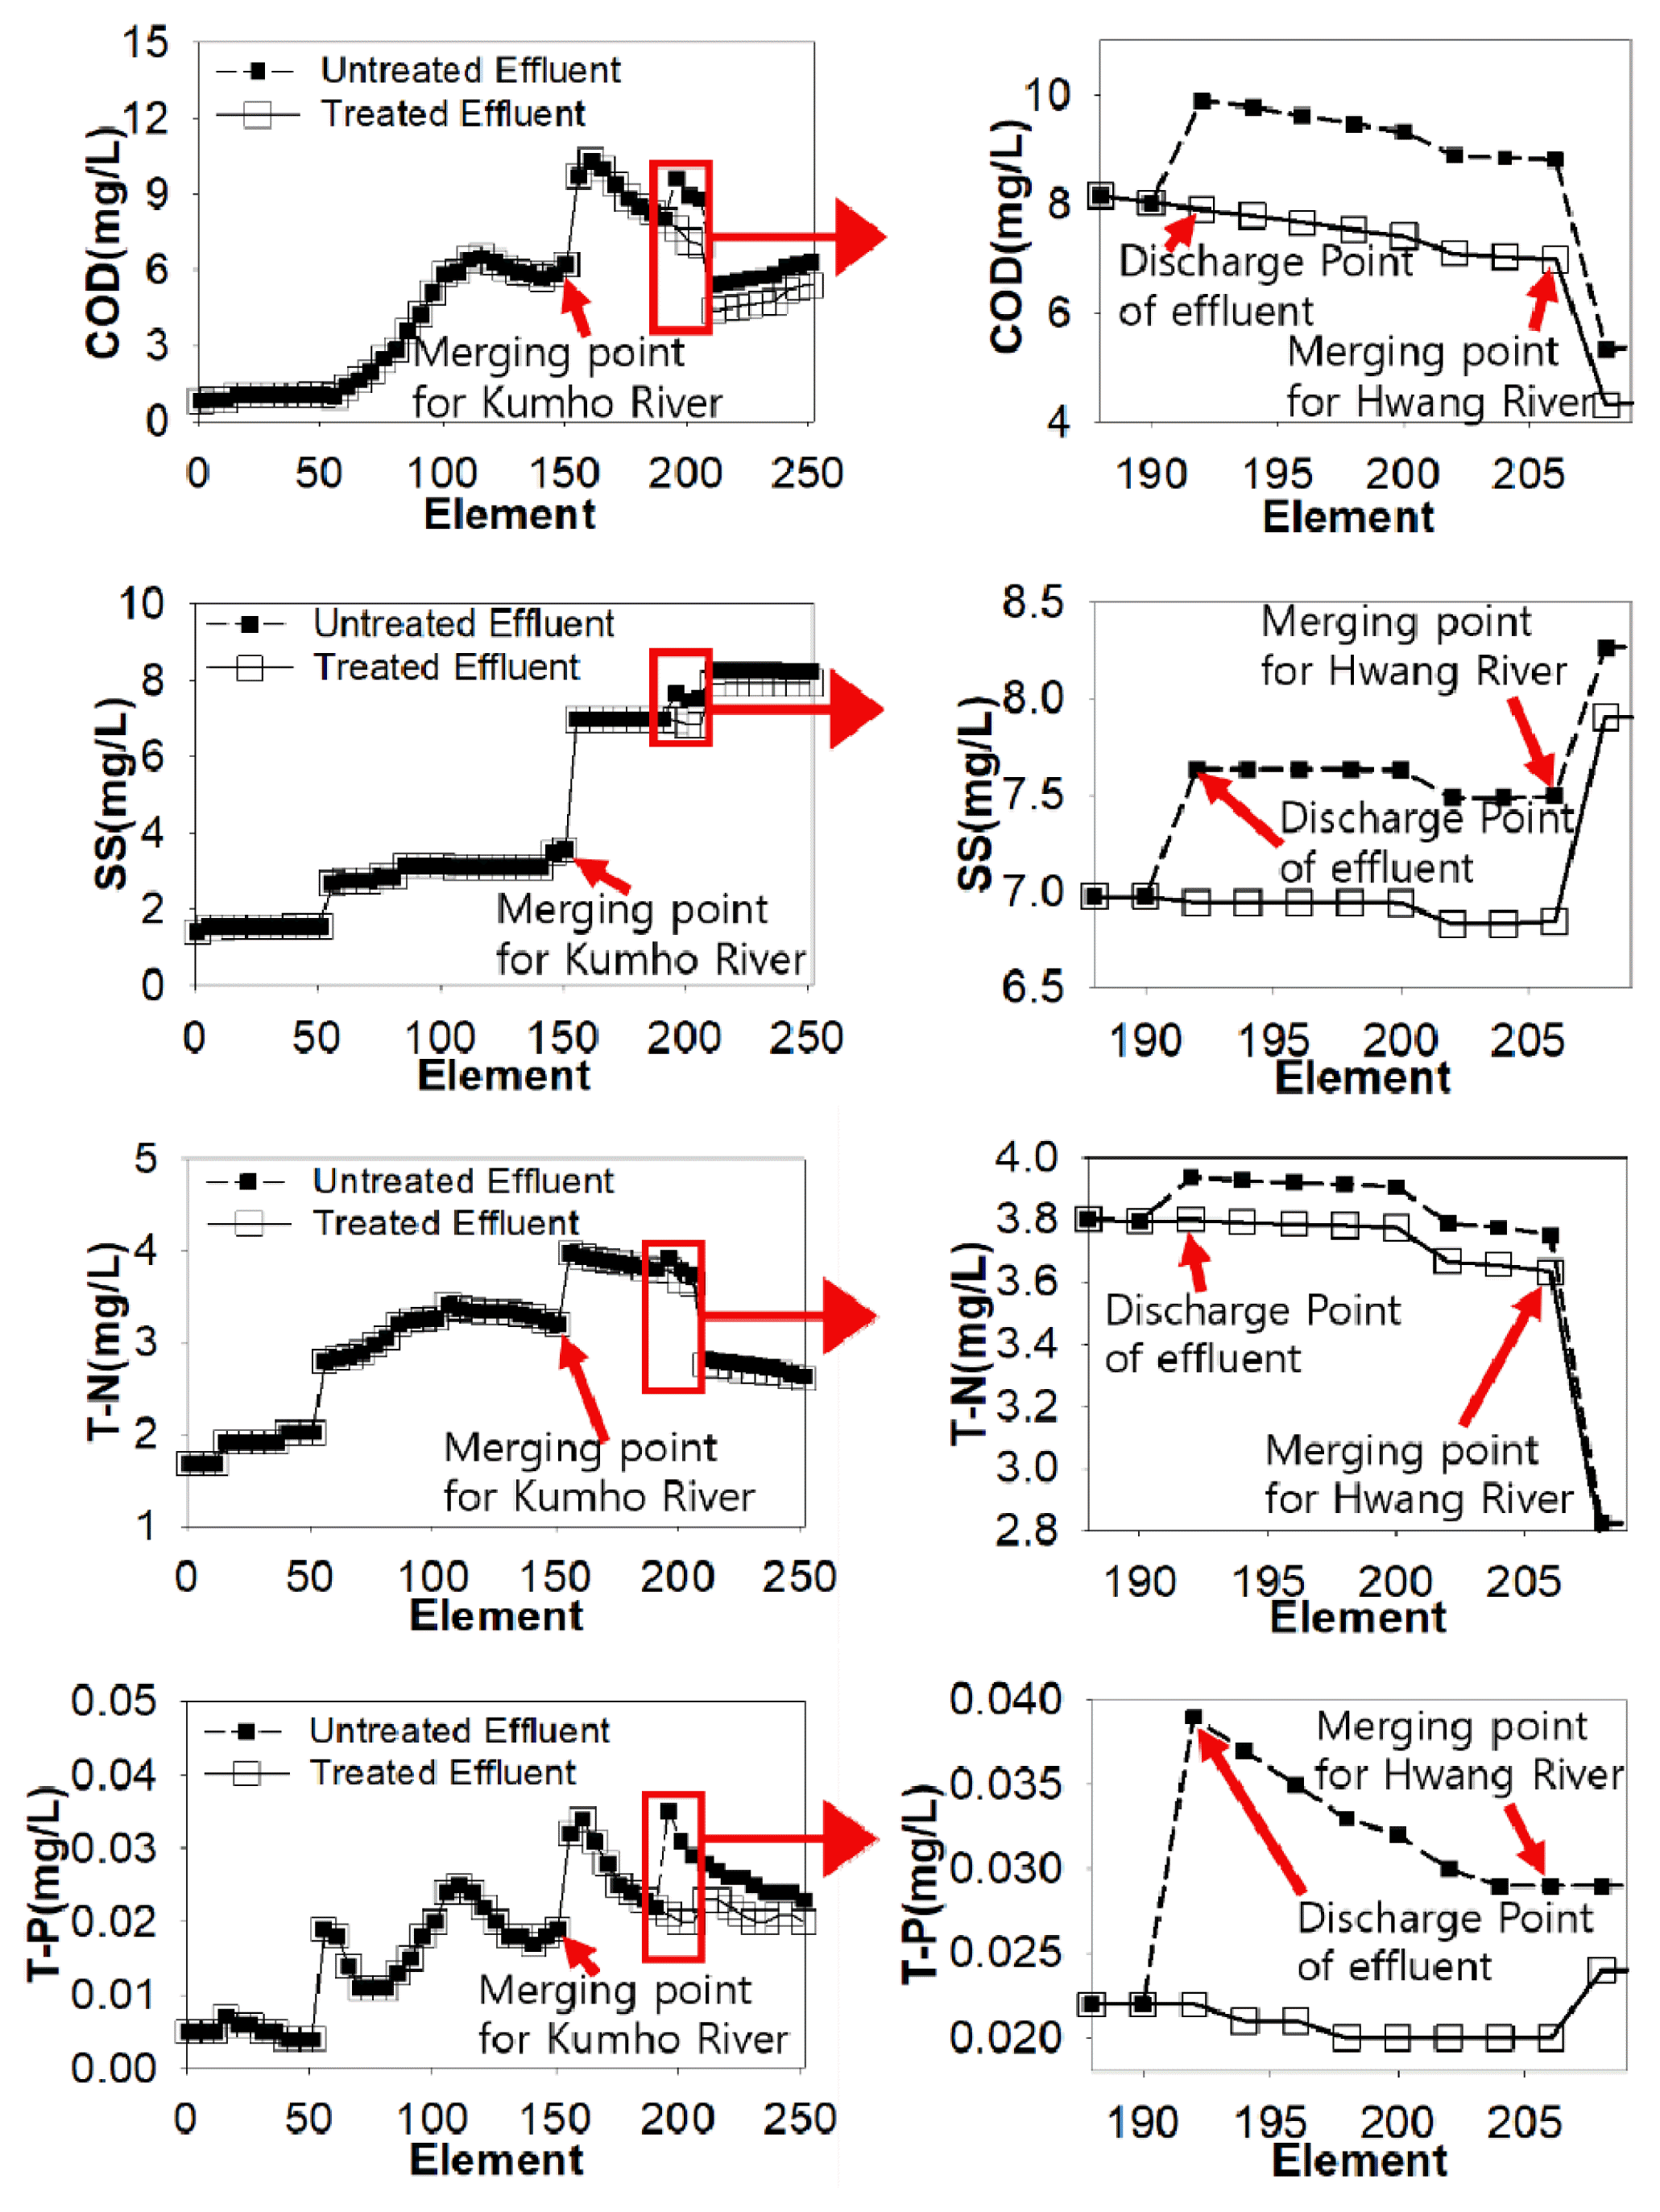
The increased flowrate of the effluent was simulated since discharging untreated wastewater did not affect the river’s water quality because of its lower flowrate. 10 times and 100 times of the original effluent flowrate (2,500 m3/day) were tested and Fig. 4 shows simulation results with 10 times of the original effluent flowrate (25,000 m3/day) to compare the effects on the river between discharging treated effluent and discharging untreated effluent. The assumed flowrate is a realistic value since actual WWTFs have such capacity. For example, Jisan WWTF and Hyunpung WWTF located in the same city with the 2nd Dalsung WWTF, Daegu Metropolitan City, have similar capacities, 20,000 m3/day and 38,000 m3/day, respectively.
As shown in the figure, untreated effluents had a direct effect on the river’s water quality when the amount of discharge was 25,000 m3/day. In particular, the concentrations of COD, SS, and T-P increased rapidly at the point of discharging untreated effluents and then gradually decreased as they flowed downstream. Concentrations of T-N had a relatively slight increase and maintained similar levels of concentration until the merging point of Hwang River. Concentrations of COD, T-N, and SS rapidly changed at the point of inflowing Hwang River for the case of discharging untreated effluent while T-P concentrations slightly increased for the case of discharging treated effluent at the point of inflowing Hwang River. The high flowrate as well as concentration levels for water quality factors of the Hwang River (2,325,024 m3/day) is the main reason for the results.
Fig. 5 shows simulation results with 100 times of the original effluent flowrate (250,000 m3/day) to compare the effects on the river between discharging treated effluent and discharging untreated effluent. Dalsecheon WWTF (190,000 m3/day) and West WWTF (370,000 m3/day) in Daegu Metropolitan City has similar capacities with the 100 times of original flowrate (250,000 m3/day). As shown in the figure, untreated effluents had a great effect on the river’s water quality when the amount of discharge was 250,000 m3/day. Concentrations of all factors increased rapidly with the inflow of untreated effluents since the number of untreated effluents was considerably high. Increased concentrations were maintained downstream of the river except for T-P concentrations; T-P concentrations showed a slight decrease as it went downstream.
Overall, the effect of WWTF effluents on the river was different depending on the amount of discharge. The assumed amount of discharges, 25,000 m3/day and 250,000 m3/day which amounts were similar to the effluents from the actual size of WWTF, showed considerable adverse effects on the water quality of the river when they were untreated and discharged to the river despite the fact that the flowrate of the Nakdong River was quite abundant.
3.4. Simulation with Normal Flowrate (2,500 m3/day) to Check the Performance of a Movable Treatment Unit for Disaster Response
A movable treatment unit (MTU) was tested for its efficiency to respond to the operating failures of WWTF due to damages during disasters and simulation for the effect of effluents treated by the MTU on the river’s water quality. Fig. S3 shows the schematic diagram for the MTU. The capacity of the device is 400 m3/day and treatment efficiencies for each water quality factor were 85% for COD, 80% SS, 25% T-N, and 30% for T-P.
Fig. 6 compares simulation results for two different effluent scenarios with the original flowrate 2,500 m3/day; 1. Untreated effluent from system failures caused by disasters, 2. Effluent was treated by five MTUs during a disaster. Five MTUs cover 80% of wastewater (2000 m3/day), but the treatment efficiency is much lower than that of wastewater treatment facilities. As shown in the figure, effluents treated by five MTUs had less impact on the river’s COD, SS, and T-P concentration levels, but the reduction efficiency was insufficient. In terms of T-N concentrations, treating by five MTUs did not contribute to reducing the effect of discharging untreated wastewater into the river at all. The low treatment efficiency of MTU and discharging 20% of untreated wastewater might be the cause of the result.
3.5. Simulation with Increased Discharge of Original Flowrate to Check the Performance of a Movable Treatment Unit for Disaster Response
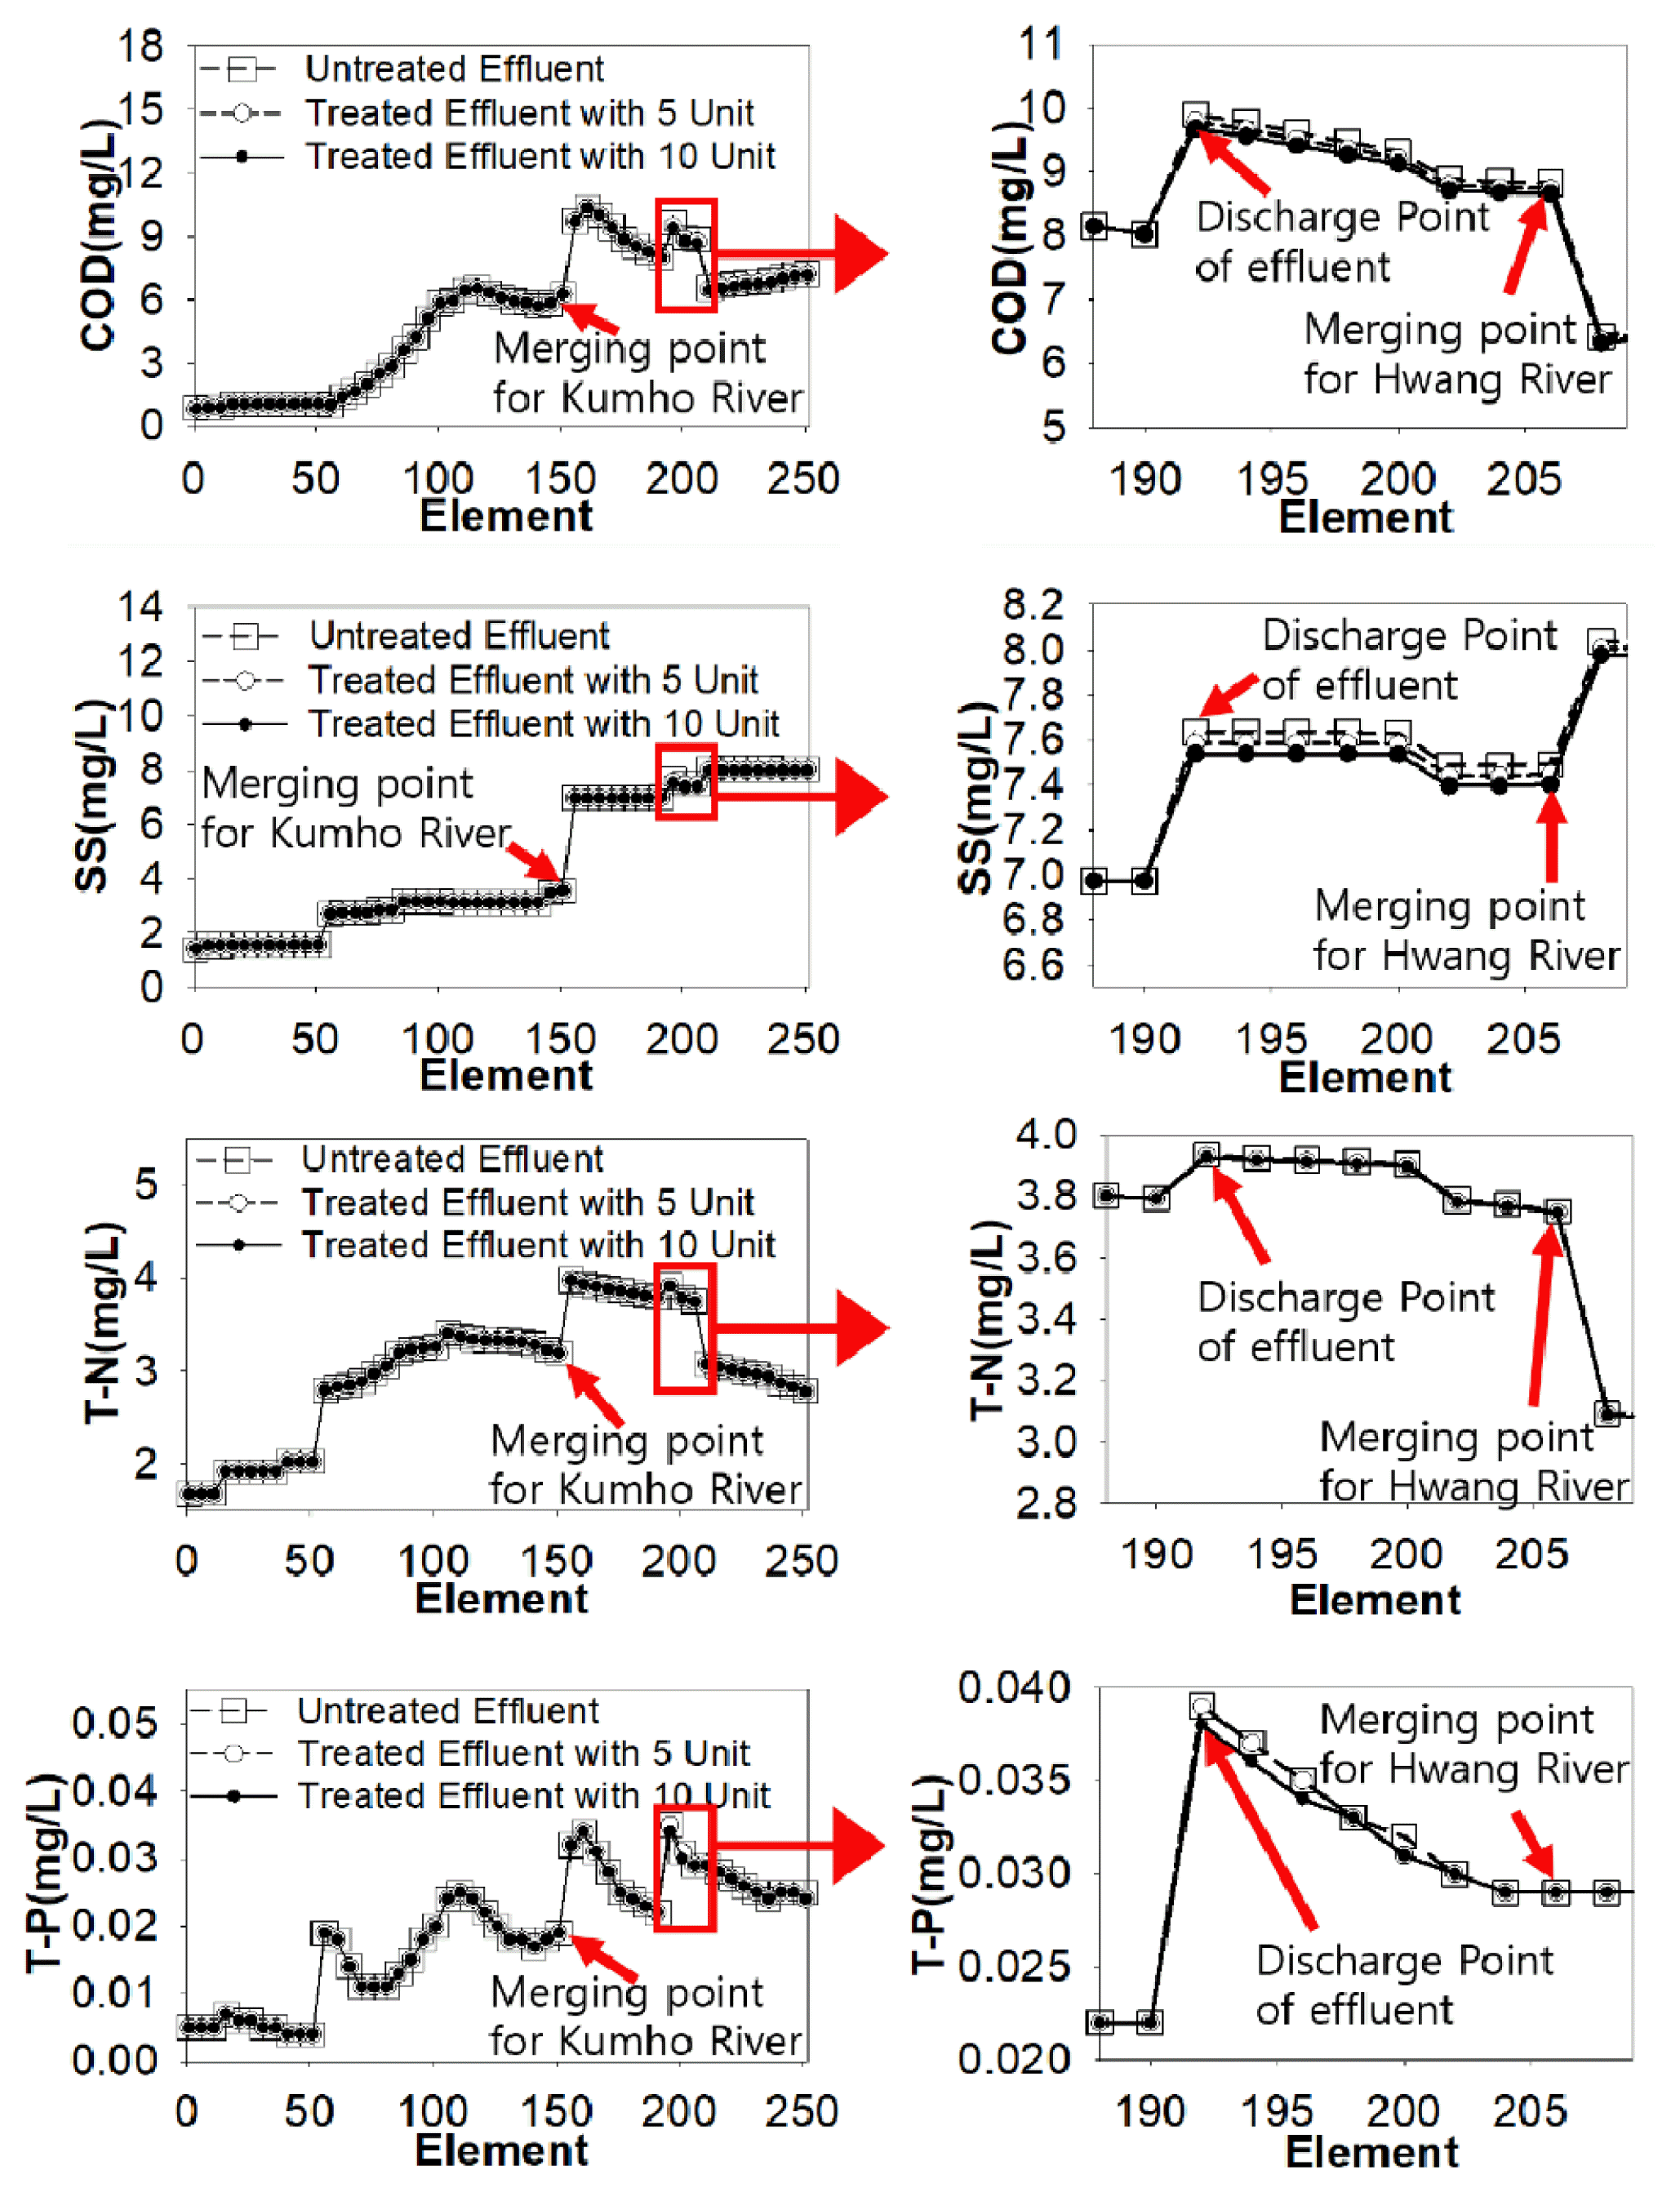
Fig. 7 compares simulation results for three different effluent scenarios with 10 times of original flowrate 25,000 m3/day; 1. Untreated effluent from system failures caused by disasters, 2. Effluent treated by five MTUs, 3. Effluent treated by 10 MTUs. Effluents treated by 10 MTUs were additionally considered for the assumed flowrate of wastewater, 25,000 m3/day. In addition, scenarios with more than 10 devices were not considered because there may be space limitations to place more than 10 devices in WWTFs. As shown in the figure, treating wastewater by MTUs showed very low reduction efficiency because the capacity of the MUTs was not good enough to respond to high flowrate of wastewater.
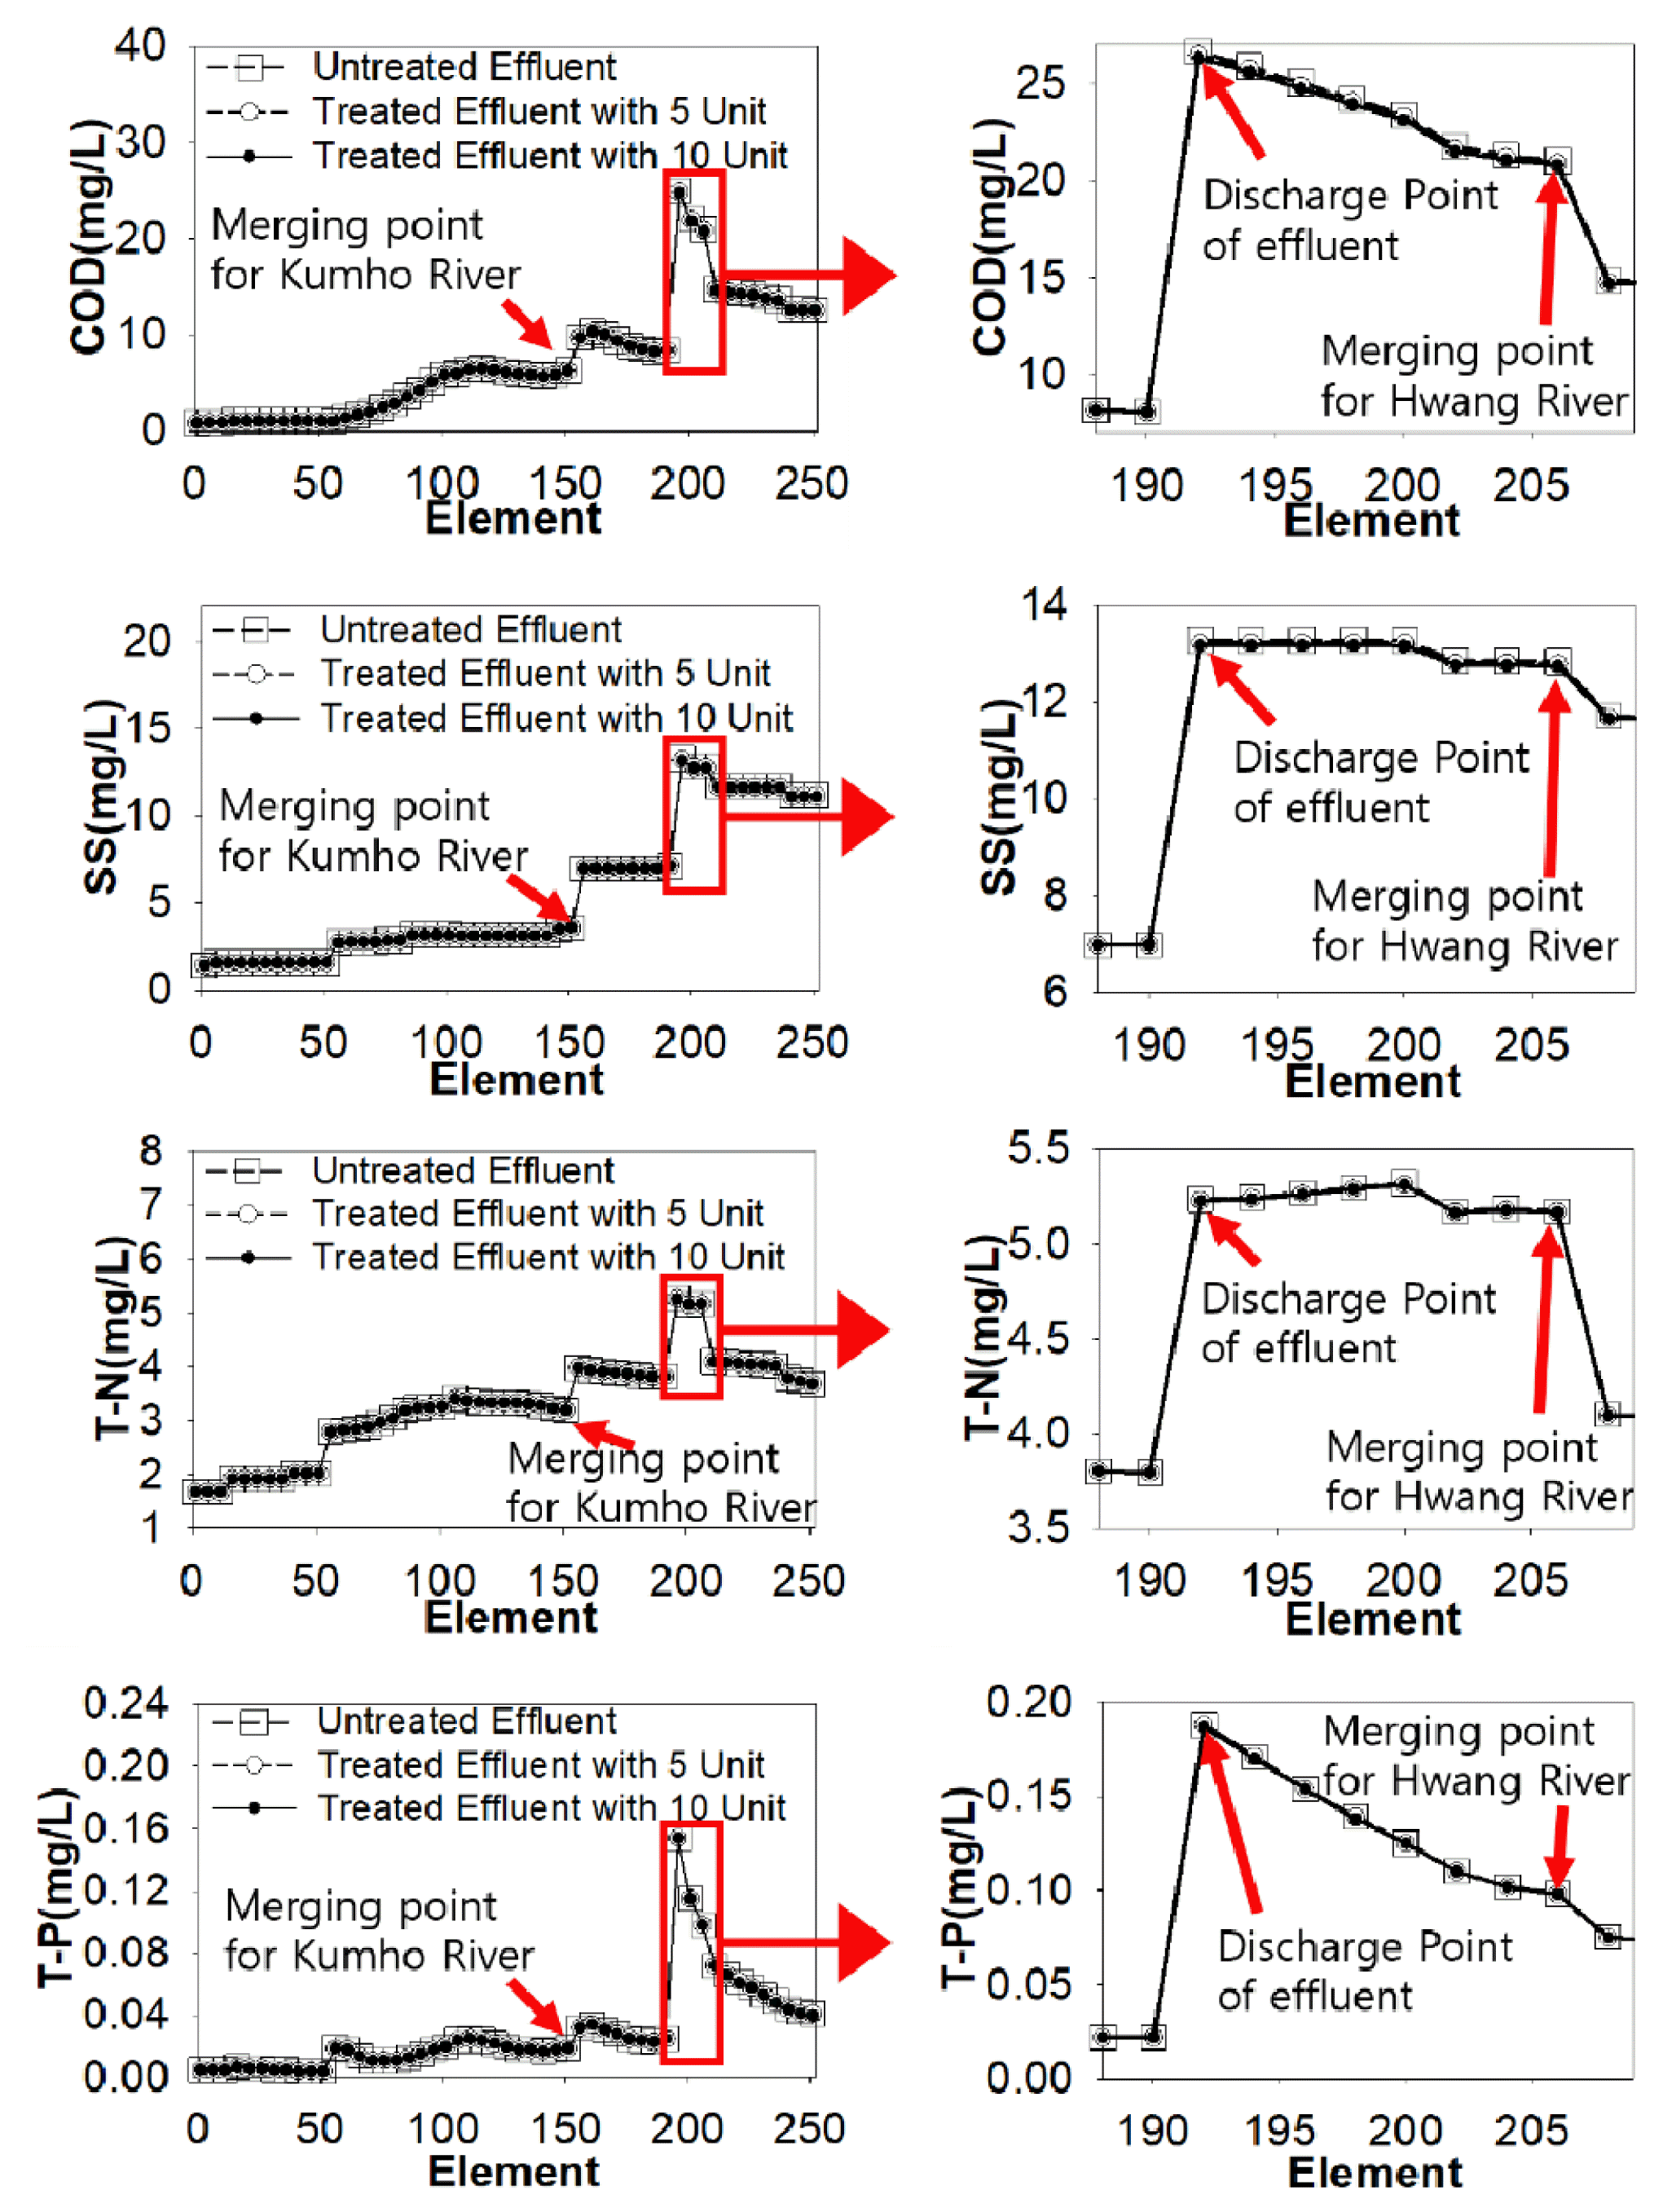
Fig. 8 compares simulation results with 100 times of original flowrate, 25,000 m3/day, for the same scenarios with 10 times of original flowrate. Treating by MTUs did not contribute to reducing the river’s water quality at all compared to the case of discharging untreated wastewater. The results are also due to the high flowrate of the wastewater (250,000 m3/day). In reality, there is a limit to increasing the capacity of a mobile device, so the disaster response system cannot rely solely on MTUs.
4. Conclusion
The study focused on a disaster response system for wastewater treatment facilities for both structural response and non-structural one. Damage to wastewater treatment facilities owing to disasters could be the cause of serious contamination on natural waterbody. In order to minimize damage to natural systems as well as wastewater treatment facilities caused by disasters, not only structural systems that could immediately respond to disasters but also non-structural ones that could predict damage in advance are needed. In this respect, the effect of untreated effluent from damaged wastewater treatment facilities due to disasters on the river was simulated as one of non-structural countermeasures. As a result, untreated effluent of the 2nd Dalsung WWTF did not affect the river’s water quality because of its low flowrate, but untreated effluent with increased flowrate had a great influence on the water quality of the river. Different strategies for disaster countermeasures are needed depending on the flowrate of effluent as well as the difference between the flowrate of effluent and that of the river. Specifically, small-scale wastewater treatment facilities should focus on rapid recovery rather than immediate response to disaster since untreated effluent from small-scale wastewater treatment facilities might not affect the river’s water quality if the flowrate of the river is abundant enough. On the other hand, immediate response to disaster should be taken along with the recovery process for mid and large-scale wastewater treatment facilities because untreated effluent from mid and large-scale wastewater treatment facilities could have a substantial impact on the water system and recovery processes for those wastewater treatment facilities take elongated time due to their large scale. The study also tested the efficiency of movable treatment units for responding to damaged wastewater treatment facilities due to disasters as part of structural countermeasures and simulated the effect of effluent treated by movable treatment units on the river. As results, movable treatment units contributed to reducing the impact on the river’s water quality for the small-scale wastewater treatment facility while they did not for mid and large-scale wastewater treatment facilities. Movable treatment units, therefore, had limitations in treating wastewater from disaster-hit waste-water treatment facilities because of their limited capacity. Disaster countermeasures for mid-large wastewater treatment facilities should have to ensure a space capable of storing untreated water than to rely on other emergency response devices including movable treatment units tested in this study to respond to disasters.


