1. Introduction
Climate change is a long-term change in the statistical distribution of weather patterns over periods of time that range from decades to millions of years. It may be a change in the average weather conditions or a change in the distribution of weather events with respect to an average. Climate change may be limited to a specific region or may be occur across the whole earth. Potential impacts of global warming on hydrology include changes in the hydrologic cycle and the water availability [1]. Changes in the amount of precipitation tend to affect the volume of runoff, while air temperature changes mostly affect the timing of runoff [2]. The change in the stream flow regime results in a substantial impact on regional water resources, seasonal water supplies and operation of reservoir. Assessment by the Intergovernmental Panel on Climate Change (IPCC) suggested that the Earth’s climate had warmed between 0.6 and 0.9 degrees Celsius over the past century and that human activity affecting the atmosphere is “very likely” an important driving factor. System simulation is a powerful methodology linking climate change to hydrology for predicting the stream flow and assessing the performance of reservoir operations under climate changes. Reasonable allocation of water resources by reservoir operation plays an important role in matching the requirements of sustainable water resources and mitigating the adverse impact of climate variations and changes on water for irrigation. Climate change will greatly complicate the design, operation, and management of water-use systems [3]. On the other hand, climate change that increases overall water availability could either be beneficial or could increase the risk of flooding.
The impacts of climate change on water resources of the Great Lakes of North America were assessed by McBean and Motiee [4]. The impact of potential climate change on water resources was predicted based on the results from global circulation models (GCMs). Historical trends for seventy years precipitation, temperature, and stream flows in the Great Lakes were examined using regression analysis and Mann-Kendall statistics. The results of the study demonstrated statistically significant increases in precipitation and stream flows over the period 1930 – 1990. Temperature trends were not found to be statistically significant (at 5% level) for any of the five Great Lakes, although the line fitted by regression indicated a gentle increasing slope (an increase of 0.63°C) and less in magnitude than the GCM predictions. The presence of significant positive trends in historical precipitation and flows, and comparable levels as predicted by the GCMs, indicated that the hydrologic changes being incurred in the Great Lakes system may be attributed to climate change. Burn and Simonovic [5] assessed the potential impacts of changing climatic conditions on the operational performance of water resource systems of Shell mouth Reservoir located in the Canadian province of Manitoba. The methodology adopted in this work combined the simulation of reservoir operation with reliability analysis of the reservoir performance. The simulation model used in this study accounted for the gain and loss of water in the reservoir, gain and loss of water between the reservoir and the downstream demand point, and loss of water at the downstream demand point. The model determined the reservoir release each month by systematically analyzing the water demands and the reservoir operation rules.
An artificial neural network methodology was developed to investigate the possible effects of climate change on monthly and seasonal surface water supplies in Colorado’s Arkansas River Basin under two transient climate change scenarios [6]. The results showed that the decade-to-decade variability was considerably more apparent than any long-term trend or change. It was concluded that the methodology developed can be used to estimate the impacts of new or updated predictions of climate change. Chen et al. [7] evaluated the impacts of climate change on water resource in the Bosten Lake basin in the south slope of the Tianshan Mountains in Xinjiang, China, using an artificial neural network model. The model was trained using the error back propagation algorithm and validated for a major catchment that covers 82% of the Bosten Lake basin. After validating the model, it was used to examine the surface hydrology responses to changes of regional temperature and precipitation. Major results showed that an additional effect of temperature increase on glacier melt in the upper reach of the basin temperature increase can cause large increases of stream flow. The outcome of the model also showed that if the current climate trend continues, the annual stream flow would increase by 38% of its current volume and the summer and winter stream flow would increase by 71.8 and 11.4% of their respective current volume in the next 50–70 years, thereby highlighting challenges for the basin’s water resources management and flood protection. Salami et al. [8] studied the impacts of climate change on the runoff in the Kainji Lake basin using artificial neural network (ANN) model. The model results revealed a positive relationship between the actual and forecasted runoff for all the selected locations and their correlation coefficient of 0.62, 0.57, 0.55 and 0.57 for Lokoja, Kaiji, Baro and Idah respectively. Runoff values were predicted for the stations and the mean annual predicted runoff were subjected to trend analysis in order to determine their variation. The percentage variations are estimated as −9.75%, +4.58%, −12.07% and −6.48% for Lokoja, Kainji, Idah and Baro respectively. The trend analysis indicated that the runoff at Lokoja, Baro and Idah are negative while that of Kainji exhibit positive trend. This implies that there is tendency for runoff to decrease at Lokoja, Baro and Idah stations while increases at Kainji. The study revealed that climate change has positive impact on the reservoir inflow at Kainji dam and subsequently assure more water for hydropower generation. This study attempts to evaluate the impact of climate change on the water resources and yield of Asa and kampe reservoir in Ilorin West Local Government of Kwara State and Yagba West Local Government of Kogi State respectively in the North Central region of Nigeria.
2. Materials and Methods
2.1. Description of Asa and Kampe River Dam
The catchment of Asa River is located between latitude 8° 36′ and 8° 24′ North and Longitudes 4° 36′ and 4° 10′ east. Its total area is 906.0 km2 and it lies within Kwara State and Oyo State with about one third of the basin area in Oyo State. The topography is laying at an attitude of between 457 m and 265 m above mean sea level (a.m.s.l). The eastern water divide is formed by a ridge of hill rising to almost 579 m (a.m.s.l) but elsewhere the catchment is gently undulating plain. The density of the drainage channels in the area is 0.956 km and the head waters of the river basin are situated in the south-west area located at an elevation of 396 m to 457 m (a.m.s.l). A large part of the catchment is above 376.5 m (a.m.s.l). The lowest parts of the catchment which consist of the flood plain are below 274 m (a.m.s.l). The stream has been serving Ilorin metropolis as main source of water for Ilorin.
The Kampe River is located within Yagba West Local Government Area of Kogi State, Nigeria. It falls within Latitude 8° 43′ E and longitude 6° 19′ N. The Kampe (Omi) Dam Irrigation Project (KODIP) is a multi-purpose project from which about 100,000 people of the community are expected to benefit directly or indirectly. It comprises the main dam, spill way, head works and 16 km of the 39 km length of main canal and about 300 km length of feeder canal and complementary drainage provision. The system is currently capable of irrigating about 1600 ha. River Kampe rises from about 25 km at the southern tip of the catchment east of Ikole in Ekiti State over an elevation of 638 m to join River Niger at elevation 53 m. The inflow of water into Kampe River depends to a large extent on the contribution of various tributaries like River Oyi, Erigi, and sub-tributaries like Aiyewa, Ele and Omo, which are seasonal, and to a less extent on the runoff from immediate surroundings. The locations of Asa and Kampe River Dams are presented in Fig. 1.
2.2. Data Collection and Analysis
2.2.1. Data collection
The meteorological data analyzed in this study were collected from the Nigerian Meteorological Agency (NIMET), Lagos, Water boards, Ilorin and Lower Niger River Basin Authority, Ilorin. The data includes temperature (T) and rainfall (R). The evapotranspiration and runoff were estimated based on Thornthwaite [9] and Soil Conservation Service (SCS) methods [10, 11].
2.2.2. Data analysis
2.2.2.1. Mann-kendall analysis
The data were subjected to Mann Kendall analysis in accordance to standard method [12]. The Mann Kendall analyses were performed for temperature, runoff, rainfall and evapotranspiration at Asa, Kampe and their upstreams. The summary of the result for Asa and its upstream are presented in Table 1, while those of Kampe and its upstream are presented in Table 2 respectively.
2.2.2.2. Sen’s slope analysis
The true slope of an existing trend such as change per year was estimated with Sen’s non-parametric method [13]. The slope equation was developed with Microsoft Excel and the Sen’s estimator of slope and Sen’s intercept were determined. The summary of the equations developed based on the estimated parameters are presented in Table 3.
2.2.3. Artificial neural network
2.2.3.1. Training of the Network
The “Alyuda forecaster XL” software package was used for ANN model to develop the relationship of rainfall, mean temperature and potential evapotranspiration with runoff at Asa, Kampe and their upstream. The training of the neural networks involved using 480 data of the rainfall, mean temperature and potential evapotranspiration for Asa river dam and 120 for Kampe were used as input data while runoff was used as output layer. The input layer and hidden layer node number was adjusted by checking the training and testing stage performances of neural networks. In this study a feed forward neural network was used to map the relation between the input parameters and the output.
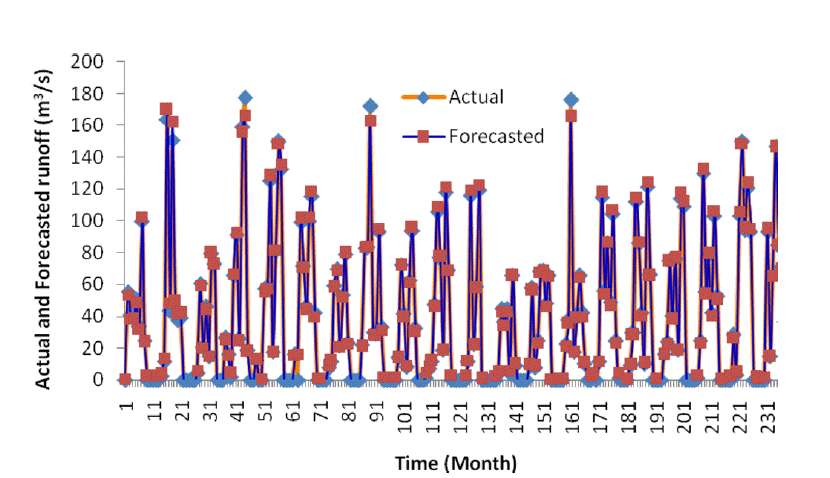
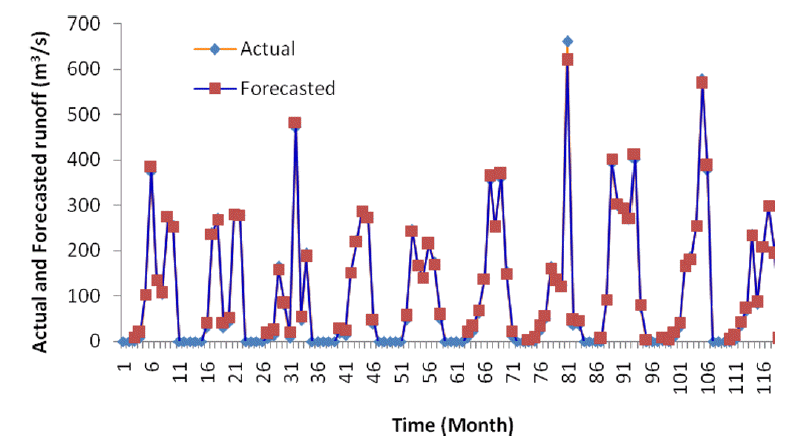
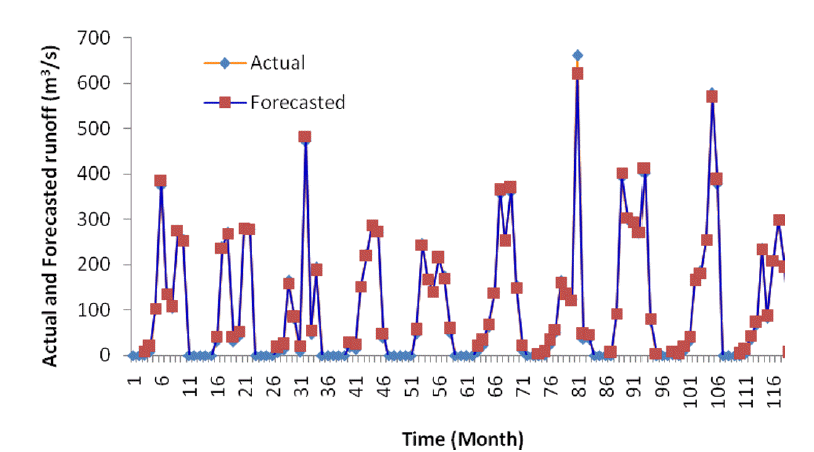
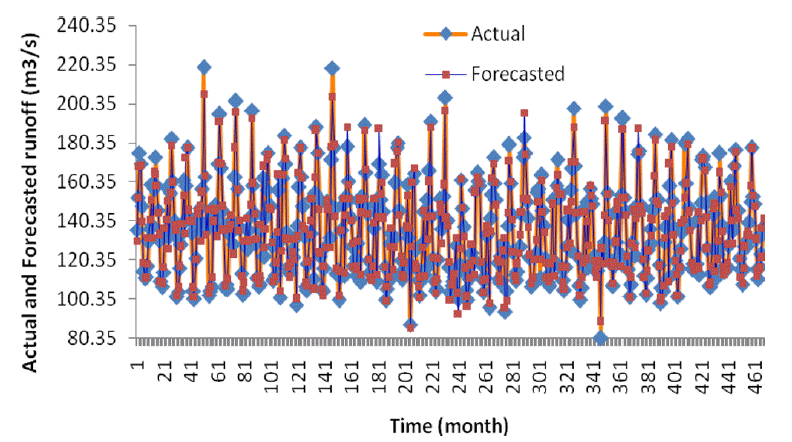
The statistics summary of ANN model for Asa, Kampe and their upstream are presented in Table 4. Figs. 2 and 3 depict the scattered diagram of forecast vs actual runoff for Asa river dam the upstream of Asa river dam respectively. Figs. 4 and 5 depict the scattered diagram of forecast vs actual runoff for Kampe river dam and upstream of Kampe river dam respectively.
2.2.3.2. Prediction of runoff using ANN
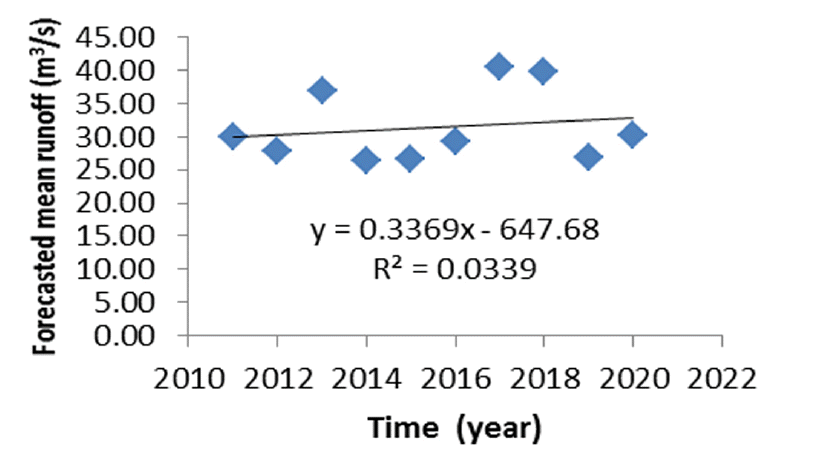
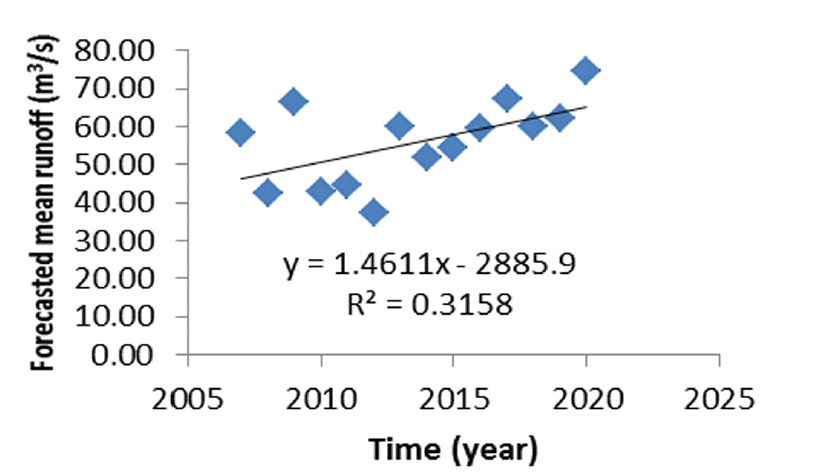
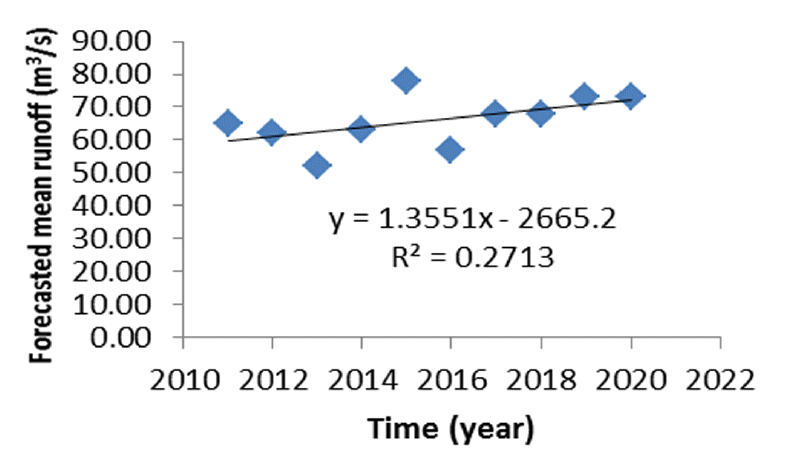
Artificial Neural Networks (ANN) was applied to the historical data to forecast future values of the runoff for Asa, Kampe and their upstreams for ten years (2011–2020). The statistical summary of the predicted runoff values are presented in Tables 5–8 respectively. The forecast mean runoff data were subjected to trend analysis to depict future trend pattern in the various locations. The trend of the forecast mean runoff for Asa, Kampe and their upstream are presented in Figs. 6–9 respectively.
2.2.4. Reservoir yield capacity analysis based on historical and ANN forecasted flows
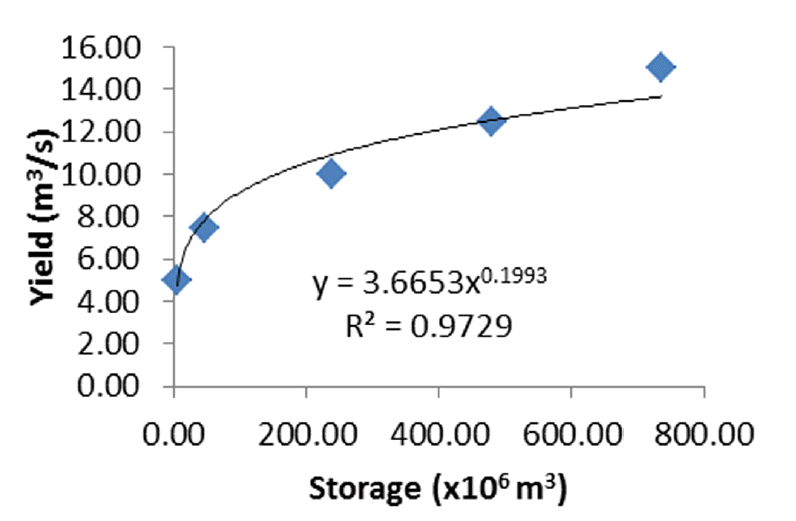
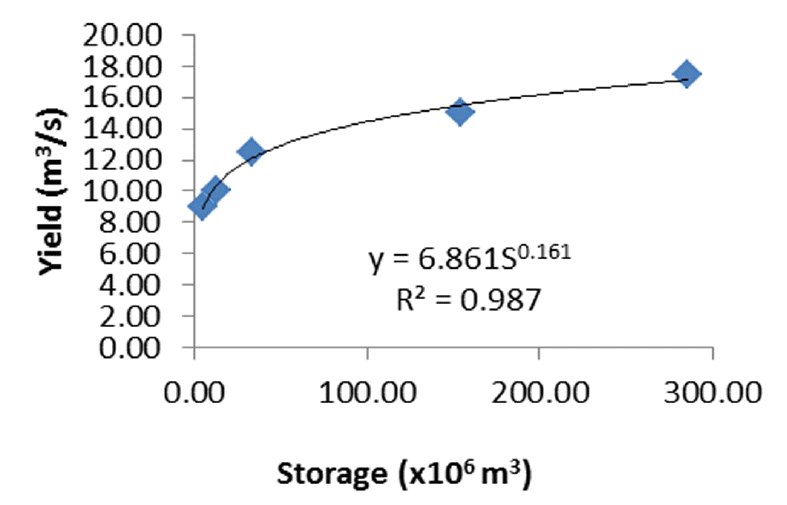
The sequent peak procedure was adopted to determine the storage and the yield capacity in accordance to Loucks et al. [14]. The storage–yield function was obtained by estimating 90%, 70%, 50%, and 40% of the average of inflow (maximum yield) and these were used to calculate the storage capacities corresponding to the releases. The yield was plotted against storage and presented in Figs. 10 and 11 for Asa and Kampe river dams based on historical runoff. The procedure was also repeated for the ANN forecast runoff and storage-yield curve developed as presented in Figs. 12 and 13 respectively.
However, for the purpose of easy estimation, a mathematical relationship was established between yield and storage. This was obtained by fitting the data with the best model and the mathematical relationship along with coefficient of determination (R2) are established as presented on the charts. The yield of a reservoir can be determined based on the mathematical relationship if the reservoir capacity is known; hence it can be used to assess water availability in the reservoir that can meet water requirement of irrigation and water supply. The reservoir yield was estimated using the established relationship and presented in Table 9 for prediction purposes.
3. Results and Discussion
3.1. Mann Kendall
The Mann kendall analysis was carried out for hydrometeorological variables such as temperature, runoff, rainfall and evapotranspiration for Asa, Kampe river dam and their upstream. The results are presented in Table 1 and 2 respectively for Asa and Kampe. At the Asa river dam the analysis for mean temperature reveals that the Mann kendall S statistics is 18 and Zs is 0.222. This implies that the trend is increasing positively but not statistically significant at 95% level. S statistics for the runoff is 270 and Zs is 3.1352. This also implies that the trend is increasing positively andstatistically significant at 95% level. The rainfall S statistics is 179 and Zs is 2.0746, indicating significant increasing positive trend at 95% level. The Mann-Kendall S statistics for Evapotranspiration is −98 and Zs is 1.2680, indicating a decreasing trend but not significant at 95% level. At the upstream of Asa river dam, the S statistics for mean temperature is 438 and Zs is 5.1, which indicate a positive trend and identified as insignificant at 95% level. The analysis for the runoff reveals that the Mann kendall S statistics is 228 and Zs is 2.65. This implies that the trend is increase and statistically significant at 95% level. The rainfall statistics S is 66 and Zs is 0.75, indicating a negative trend which is not significant at 95% level, the S statistics for evapotranspiration is 446 and Zs is 5.2, indicating a positive trend identified as significant at 95% level. The inference was drawn from Table 1. At the Kampe river dam the analysis for mean temperature reveals that the Mann kendall S statistics is 19 and Zs is 1.6099. This implies that the trend is increasing positively but not statistically significant at 95% level. S statistics for the runoff is 13 and Zs is 1.0733. This also implies that the trend is increasing positively but not statistically significant at 95% level. The rainfall S statistics is 15 and Zs is 1.252, indicating an increasing positive trend although not significant at 95% level. The Mann-Kendall S statistics for Evapotranspiration is 17 and Zs is 1.4311, indicating an increasing positive trend but not significant at 95% level. At the upstream of kamperiver dam, the S statistics for mean temperature is −161 and Zs is −1.9, which indicate a negative trend (decrease) and identified as insignificant at 95% level. The analysis for the runoff reveals that the Mann kendall S statistics is 234 and Zs is 2.71. This implies that the trend is positive (increase) and identified as statistically significant at 95% level. The rainfall statistics S is 242 and Zs is 2.81, indicating a positive trend which is significant at 95% level and the S statistics for evapotranspiration is −168 and Zs is −1.95, indicating a negative trend identified as insignificant at 95% level. The inference was drawn from Table 2.
3.2. Sen Slope Estimator
Sen Slope estimator was carried out for the hydrometeorological variables. The summaries of the developed equations for variables at Asa, Kampe andtheir upstream are presented in Table 3.
At the Asa River Dam, the Sen’s slope estimator for the mean temperature, runoff, rainfall and evapotranspiration has a value of −0.0050, 0.3420, 0.4860 and −0.4100 respectively. The slopes for mean temperature and evapotranspiration indicating a negative trend, while those of the runoff and rainfall indication a positive trend. Also for the Upstream of Asa River Dam, the Sen’s slope estimator for the mean temperature gives a slope of 0.0250, 0.6260, 0.2240 and 0.5390. All indicating a positive trend.
For Kampe River Dam, the Sen’s slope estimator for the mean temperature, runoff, rainfall and evapotranspiration has a value of 0.0960, 2.4690, 2.4220 and 0.5410 respectively. All indicating a positive trend. Also for the Upstream of Kampe River Dam, the Sen’s slope estimator for the mean temperature gives a slope of −0.0040, indicating a negative trend, while the slope for the runoff is 0.6270 indicating a positive trend. The Sen’s slope estimator gives a slope of 0.8020 for the rainfall and −0.0850 for evapotranspiration indicating a positive and negative trend respectively.
3.3. Artificial Neural Network
The performance statistics of the analysis gave coefficient of determination and correlations presented in Table 4 for Asa, Kampe and their upstream. The relationship of the scattered diagram of forecast vs actual runoff for Asa and its upstream are presented in Figs. 2 and 3 respectively, while those of the Kampe river dam and its upstream are presented in Figs. 4 and 5 respectively. Alyuda forecaster XL used in the training of the network automatically created the best structure suitable for the network and the Performance Reports which showed that the actual and forecast data have little deviation. Also, the network parameters such as coefficient of determination and correlations are large value which indicated that the model is fit for forecast.
3.4. Prediction of Reservoir Runoff
The statistical summary of the predicted runoff for Asa, Kampe and their upstream were presented in Tables 5–8 respectively. The runoff predicted based on the ANN model was subjected to trend analysis in order to determine the nature of its variation. The trend of the predicted runoff for Asa, Kampe and their upstream indicated an increasing positive trend. Figs. 6–9 present the trend of predicted mean runoff for the two locations. This is in agreement with the results of the regression and Mann Kendal analysis.
3.5. Reservoir Yield Capacity
The storage-yield function obtained for Kampe river dam based on historical and ANN predicted runoff were presented in Figs. 10–13 respectively. The storage – yield function was used to predict yield for Asa, Kampe river dams and presented in Table 9. The storage-yield function developed was used to estimate yield corresponding to reservoir capacity and revealed that the yield obtained with ANN forecast runoff was higher than those obtained with historical runoff. For example, the yield obtained for Asa dam with historical runoff was 7.75 m3/s, while that obtained with ANN forecast runoff was 12.57 m3/s. This is an indication of about 62% increase in reservoir yield. Also the yield obtained for Kampe dam with historical runoff was 48.85 m3/s, while that obtained with ANN forecast runoff was 58.67 m3/s. This is an indication of about 20% increase in reservoir yield. This implies that the change in climate has led to increase in reservoir yield, which mean more water for water supply and irrigation activities in the North Central region of Nigeria.
4. Conclusions
4.1. Conclusion
There were some notable changes in the hydro-meteorological variables at the study areas. The analysis revealed that at Asa river dam the temperature and evapotranspiration exhibited negative trends and statistically insignificant, while the rainfall and runoff exhibited positive trends which are statistically significant. In the case of the upstream of Asa river dam, all the variables have positive trend and significant except rainfall.
At the Kampe river dam; the temperature, runoff, rainfall and evapotranspiration exhibited positive trends, which indicated that they have a tendency to increase, but statistically insignificant. In the case of the upstream of Kampe river dam, the temperature and evapotranspiration exhibited negative trends and statistically insignificant, while the rainfall and runoff exhibited positive trends which are statistically significant. This implies that both rainfall and runoff have tendency to increase significantly.
The trained ANN model for prediction of runoff was able to fairly describe the hydrology of the study areas. The coefficient of determination and correlation were good and the model has strong ability to predict runoff as a function of rainfall, temperature and evapotranspiration data. The forecast runoff subjected to trend analysis also indicated tendency to increase significantly. The reservoir yield capacity estimated with the ANN forecasted runoff was higher by about 38% and 17% compare to that obtained with historical runoff at Asa and Kampe respectively.
It can be concluded that the climate change has a promising synergy impact on water resources and thus can sustain water supply and irrigation requirement.
4.2. Recommendation
The outcome of the study can be adopted for the management of Asa and Kampe river dams. The forecasted runoff would assist in planning and optimizing reservoir by formulating an operational policy considering the quantity of water required for domestic, industrial and irrigation activities. Therefore the author strongly recommend an operational policy of integrated water resources management through which to harnessing the abundance resources to boost food production in the North Central region of Nigeria through irrigation.


