AbstractIn this study, the researchers evaluated the use of nano-zero-valent iron (nZVI) activated persulfate (PS) for the degradation of Rhodamine B (RhB). The effects of various operating parameters such as initial pH, and dosages of PS, nZVI and citric acid (CA) on the removal rate of RhB were investigated. The results demonstrated that at a PS dosage of 5 mmol·L−1, nZVI dosage of 0.3 g·L−1, 0.1 mmol·L−1 CA, and pH of 5, the degradation rate of RhB was 94.970%. The degradation and kinetic analysis of RhB using micron-scale zero-valent iron (mZVI) and nZVI revealed that nZVI exhibited higher activity with PS due to its smaller particle size. The activation of PS by nZVI is higher compared to mZVI, and the ineffective consumption is half that of the mZVI/PS system, the TOC removal rate increased by 18.65%. Kinetic analysis indicated that under the mentioned reaction conditions, the degradation process followed a pseudo-second-order reaction model, with the highest apparent reaction rate constant (kobs). The researchers also identified active radical species in the nZVI/PS system. Additionally, Gas Chromatography-Mass Spectrometry (GC-MS) analysis was used to detect reaction intermediates and propose a possible degradation pathway for RhB.
Graphical Abstract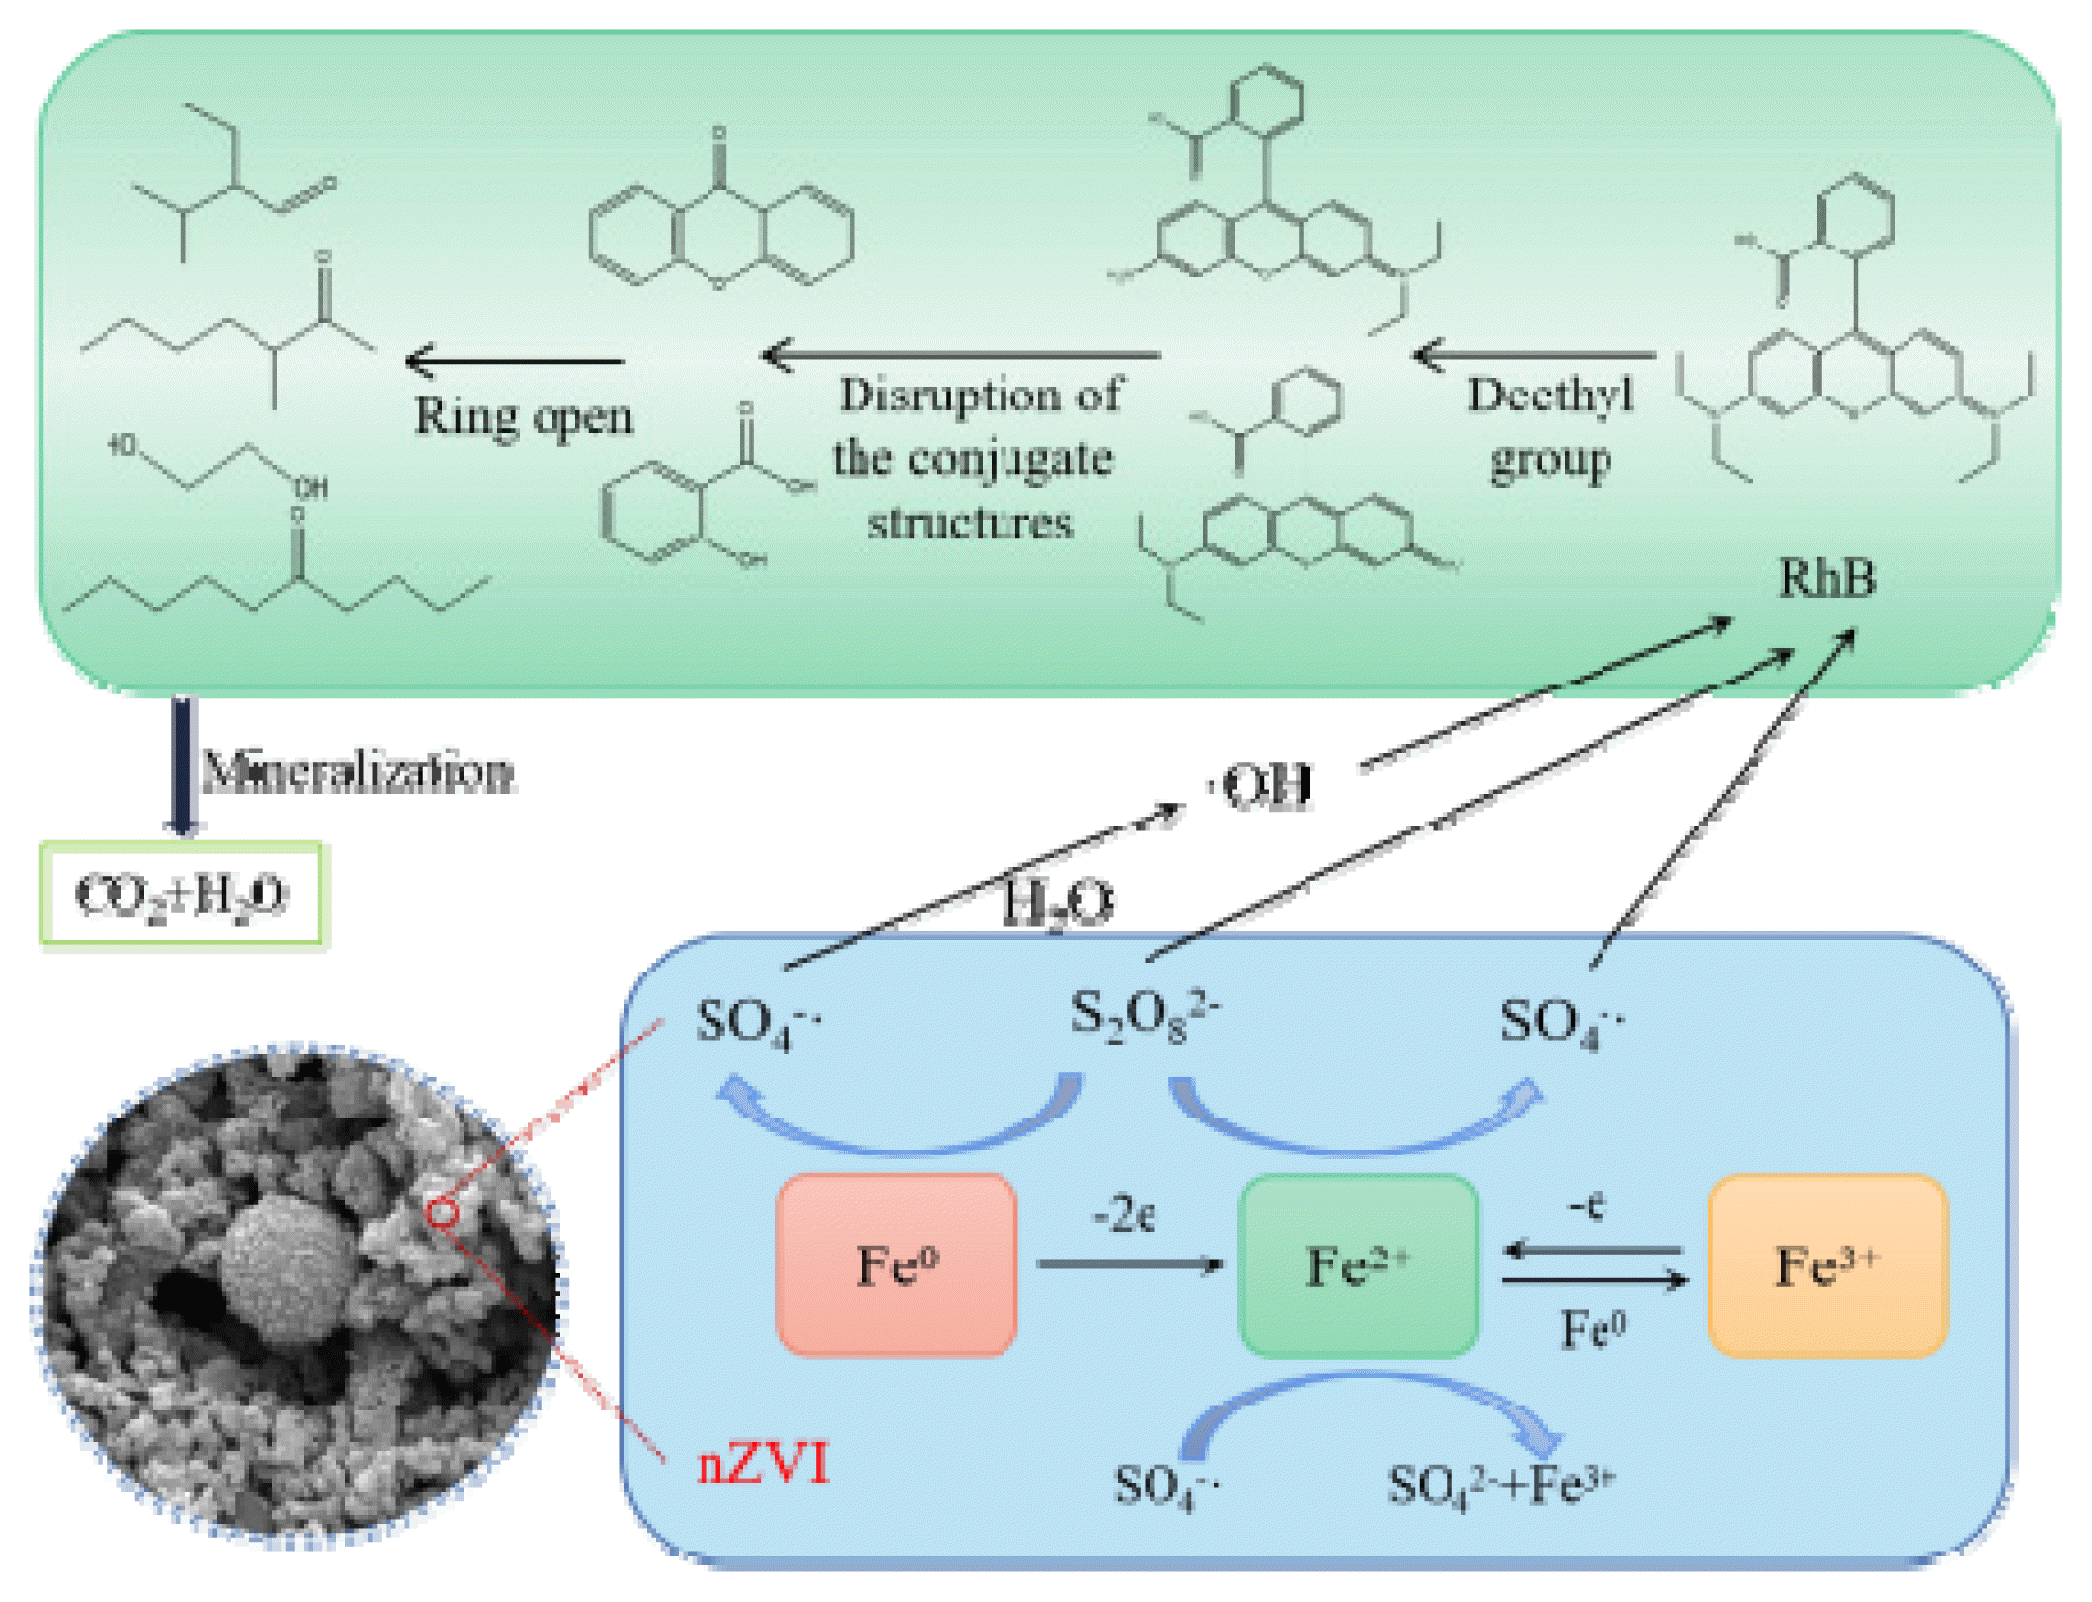
1. IntroductionRhB is a vibrant red cationic dye commonly found in wastewater. Wastewater containing dyes like RhB is highly pigmented and lacks bioavailability, posing significant ecological and health risks if directly released into the environment without adequate treatment [1–5]. The ability to degrade a dye depends on its ability to destroy the color-emitting groups. Traditional methods such as adsorption, photocatalysis, and biodegradation are unable to fully degrade and mineralize dyes [6–9]. Khadiza Tul Kubra et al. effectively employed whole wheat flour as a natural adsorbent to capture cationic crystalline violet (CyV) dye, achieving an impressive adsorption rate of 162.33 mg·g−1 [10, 11]. Although the adsorption efficiency is high and the adsorbent is reusable, however, its circular elution step is tedious and can only transfer the contaminant from the liquid phase to the solid phase, which cannot be completely remove [12]. Bircan Haspulat Taymaz et al. successfully employed a polyaniline/NiO film under UV-visible light irradiation to completely degrade methylene blue and RhB within 30 minutes. However, the use of a harmful UV lamp as the light source limits its practical application. As a result, advanced oxidation techniques based on activated PS have gained significant interest for the treatment of various organic contaminants in soil and groundwater [13, 14]. Some researchers have achieved promising results in using heterogeneous catalytic peroxydisulfate to remove organic pollutants in water, demonstrating effective degradation and mineralization rates [15, 16].
As a strong oxidant, PS can be activated in various ways, such as heat, ultrasound, electric current, ultraviolet (UV) light and alkaline conditions, while producing SO4−· (E0=2.6) and/or hydroxyl radicals (·OH) [17–21]. Transition metals are commonly employed as activated catalysts for the treatment of water contamination. In particular, numerous studies have utilized nZVI for activating PS due to its superior reducing and migrating capabilities, as well as its ability to adsorb heavy metals, thanks to its smaller particle size [22–25]. Peng Huang et al. used a novel phosphorusdoped biochar loaded with nZVI complex (nZVI@P-BC) to activate persulfate. The removal rate of gamma-hexachlorocyclohexane (γ-HCH) (initial concentration 10 mg·L−1) was 92.6% within 10 minutes [26]. These studies show that nZVI can be used as an excellent catalyst to catalyze the degradation of pollutants by PS.
This study focused on investigating the performance and mechanism of nZVI activated PS degradation. The main factors affecting the process, including PS dosage, nZVI dosage, and pH, were evaluated. Additionally, the reinforcing effect of CA on the system was examined. The active radical species in the nZVI/PS system were identified, and potential degradation pathways were suggested based on the identification of intermediates in the RhB degradation process. The advantages of nZVI activation were analyzed by comparing the degradation effects and kinetic characteristics of RhB using different catalysts.
2. Materials and Methods2.1 MaterialsAll reagents used in this study were of analytical grade and were purchased from Kelon Chemical Reagent Plant, China. Micronscale zero-valent iron, Ferric chloride, sodium borohydride, anhydrous ethanol, sodium persulfate, sodium thiosulfate, potassium iodide, RhB, sulphuric acid, sodium hydroxide, hydrochloric acid, citric acid, ammonium ferrous sulfate, dichlorylene chloride, anhydrous sodium sulfate.
2.2 Experimental MethodThe experimental procedure is shown in Fig. S1.
2.2.1 Preparation of nZVIMeasure 8.11 g of FeCl3 in a three-neck flask and add 100 mL of 80% ethanol-water solution. After that, introduce N2 gas into the flask and start the stirring device, stirring for 15 minutes. Slowly add a properly prepared excess NaBH4 solution to the flask. Maintain the flow of N2 gas and mechanical stirring for an additional 30 minutes after the complete addition of NaBH4 solution. Once the reaction is complete, wash the resulting black solid three times with deionized water and three times with deoxygenated anhydrous ethanol. Place the washed black solid in a vacuum drying oven and dry it at a controlled temperature of around 60°C for storage.
2.2.2 RhB degradation experimentIn order to investigate the effects of PS dosage, nZVI dosage, initial pH and CA dosage on RhB degradation efficacy, RhB degradation experiments will be conducted subsequently. In a beaker, 200 mL of RhB at a concentration of 100 mg·L−1 was added, and appropriate amounts of nZVI, PS, and CA were pitched according to the conditions of the one-way experiment and mixed thoroughly. The initial pH was adjusted by pHS-3C precision pH (Shanghai Yidian Scientific Instruments Co., Ltd., pHS-3C), add a certain amount of nZVI and start stirring and timing, and take samples at a fixed time point.
2.3 Analytical MethodsThe concentration of RhB was tested using UV spectrophotometry. The absorbance of the filtrate at wavelength 553.5 nm was measured by UV-visible spectrophotometer (Chengdu Yikoyin Experimental Equipment Co., Ltd., UV-1800), and the concentration of RhB was obtained by substituting into the standard curve, the standard curve is shown in Fig. S2. The concentration of PS was determined using potassium iodide spectrophotometry [27]; the total was analyzed by the TOC method with an organic carbon (TOC) analyzer (TOC-V CPH, Shimadzu, Japan) in aqueous solution.
2.4 Kinetics Analysis MethodIn this paper, except for the nZVI batch dosing experiment which conforms to the apparent first-order kinetics, as shown in Eq. (1). The other reactions conform to the apparent second-order kinetics, as shown in Eqs. (2) and (3) [22–24]. The kobs represents the overall degradation of RhB, C0,RhB is the initial RhB content (mg·L−1), and Ct,RhB is the RhB content (mg·L−1) at time t.
2.5 Characterization of the nZVIX-ray diffractometer (X Pert PRO MPD, Panaco Ltd, Netherlands), field emission scanning electron microscope (Inspect F50, FEI, USA) and zeta potential and particle size analyzer (zeta PALS 190 Plus, Brookhaven, USA) are used. United States) to characterize nZVI. Fig. 1(a) shows the XRD pattern of nZVI. Within the diffraction angle (2θ) of 10–80°, the sample shows a clear diffraction peak at 44.8°, which corresponds to the (110) crystallographic diffraction of body-centered cubic α-Fe0, indicating that its main composition is α-Fe0 with a small amount of impurities.
Fig. 1(b) shows the particle size distribution of nZVI. The particle size distribution of nZVI was determined, and it is known that the particle size range of the experimentally prepared nZVI is 35.6~73.3 nm, which is indeed a nanoscale material. By Gaussian fitting, it was shown that the particle size distribution of nZVI was in accordance with the normal distribution. Fig. 1(c) shows the SEM image of nZVI, which shows that the experimentally prepared nZVI is near-viewed as spherical particles with obvious blocky or chain-like agglomerates.
3. Results and Discussion3.1 Effects of Different Factors3.1.1 Effect of PS dosage
Fig. 2(a) and (b) shows the effect of different PS dosage amounts on the removal of RhB in the nZVI/PS system. Controlling the initial pH value of 3.5 and the nZVI dosage amount of 0.5 g·L−1, the degradation rate of RhB was significantly increased from 36.41% to 84.54% when the PS dosage amount was increased from 1 to 3 mmol·L−1 within 30 min of reaction in Fig. 2(a). In Fig. 2(b), the value of kobs escalated from 0.346×10⁻³ to 6.33×10⁻³ L·mg−1·min−1. However, no substantial increase in RhB degradation rate or kobs was observed upon further increase in PS dosage. This indicates that an appropriate increase in PS dosage promotes the formation of SO4−·, leading to an improvement in kobs and RhB degradation rate. Nevertheless, these reactions lead to poor utilization of free radicals when persulfate is overdosed. Excessive PS dosage results in a high concentration of generated SO4−·, which leads to quenching reaction, as shown in Eqs. (4) and (5), thereby reducing the utilization reaction of free radicals [28–30]. As a result, a significant enhancement in the degradation rate of RhB can no longer be achieved.
3.1.2 Effect of nZVI dosage
Fig. 2(c) shows the effect of different nZVI dosage levels on the removal of RhB in the nZVI/PS system. The initial pH was controlled to be 3.5 and the PS dosage was 5 mmol·L−1. In Fig. 2(c), the degradation rate of RhB increased significantly from 65.75% to 91.62% within 30 minutes when the nZVI dosage was raised from 0.1 to 0.3 g·L−1. In Fig. 2(d), the value of kobs increased from 0.591×10⁻³ to 3.77×10⁻³ L·mg−1·min−1. However, no significant increase in kobs or RhB degradation rate was observed upon further increase in nZVI dosage. This indicates that an appropriate increase in nZVI dosage enhances the contact area between nZVI and PS, leading to a greater number of active surface sites. This results in more efficient Fe2+ activation, producing increased levels of SO4−·, and hence improving the removal rate of RhB. However, further addition of nZVI does not significantly enhance the degradation of RhB. This is because higher concentrations of nZVI rapidly activate PS, resulting in the production of large quantities of SO4−·, as shown in Eqs. (6)–(9). Secondly, due to the addition of excess catalyst, the excess Fe2+ will be directly oxidized to Fe3+, which is useless for the degradation of organic pollutants. Furthermore, accelerated surface oxidation rate of the catalyst due to the high oxidizing environment formed by the SO4−· excess, leading to the formation of an oxide layer on its surface, which gradually reduces its pollutant degradation capacity over time [31, 32].
3.1.3 Effect of initial pHThe activity of SO4−· varies with pH. It is the main free radical under acidic conditions, while sulfuric acid and hydroxyl radicals exist in neutral or weakly alkaline conditions. Therefore, this research is essential to understand its behavior [18, 33, 34]. We performed the experiment at initial pH values of 3, 5, 7, 9, 11. All systems showed significant degradation rate kobs values, indicating that RhB could be effectively degraded under different initial pH conditions. At different initial pH, the type and rate of free radicals produced by the system are one of the important influences on the advanced oxidation process [35]. In Fig. 2(e), the maximum RhB degradation rate of 86.732% was achieved when initial pH was 5 within 30 minutes of reaction, and in Fig. 2(f), the reaction rate decreases with increasing pH, especially under alkaline conditions. The highest kobs of 2.19×10⁻³ L·mg−1·min−1 was achieved when the pH was 5. When the pH was further increased, the kobs and degradation rate of RhB decreased instead. nZVI can remain reduced under acidic conditions. As Fe0 and Fe2+ have high catalytic activity for PS under acidic conditions The activation of PS by Fe0 and Fe2+ produces SO4−·, leading to the degradation of RhB. In an excessively acidic condition, SO4−· is produced at a rapid rate, as shown in Eqs. (10), resulting in a decrease in the degradation rate of RhB. On the other hand, in an alkaline environment, the concentration of free Fe2+ in the solution is lower, as shown in Eqs. (11) and (12), and ·OH becomes the primary reactive species. Additionally, the oxidation potential of ·OH generated through the reaction of SO4−· is reduced, as shown in Eqs. (13). Multiple factors contribute to the low degradation efficiency of RhB in alkaline conditions [21, 36].
3.2 CA Enhancement of nZVI/PS SystemThe degradation process of RhB was enhanced by the addition of CA under the optimal experimental conditions of nZVI/PS in the previous period. Fig. 3 demonstrates the effect of varying the dosage of CA (0, 0.05, 0.1, 0.2, 0.3 and 0.4 mmol·L−1) on the removal of RhB in the nZVI/PS system. Fig. 3(a) indicates that the initial 10 minutes correspond to a rapid degradation phase. At 10 minutes, compared to the nZVI/PS system, injecting 0.1 mmol·L−1 CA increased the RhB degradation rate from 76.551% to 82.842%. Furthermore, the time required to achieve 90% RhB degradation decreased from 20.1 minutes to 18.25 minutes. These findings suggest that proper CA dosing can enhance the degradation efficiency of RhB in the nZVI/PS system.
Fig. 3(b) presents the kobs values of the CA/nZVI/PS system. In the absence of CA, the kobs of RhB in the reaction system was 4.474×10⁻³ L·mg−1·min−1 within 30 minutes, as depicted in Fig. 4(b). However, when 0.1 mmol·L−1 CA was added, the kobs of RhB increased to 5.544×10⁻³ L·mg−1·min−1. Interestingly, further increasing the CA concentration to 0.4 mmol·L−1 resulted in a decrease in kobs to 3.9894×10⁻³ L·mg−1·min−1. This suggests that the CA/PS/nZVI system can effectively promote RhB degradation with an appropriate amount of CA. However, excessive CA concentrations inhibit the degradation of RhB instead.
At an initial pH of 5, the iron ions in the solution tend to precipitate, resulting in a decrease in Fe2+. This, in turn, lowers the effective concentration of SO4−· produced by the system and reduces the degradation rate of RhB. However, with the addition of CA, the formation of complexed Fe2+ prevents radical scavenging effects and precipitation [31, 32]. The complexed Fe2+ formed after the complexation equilibrium accelerates the reaction rate of the rapid reaction stage to a greater extent, as shown in Eqs. (14). Consequently, the degradation rate of RhB within 30 minutes reaches an impressive 94.97%, significantly increasing the degradation rate. If the CA concentration is too low, incompletely complexed Fe2+ in the solution competes with fully complexed Fe2+ for SO4−·, resulting in a reduction in sulfate radical production within the same time interval. As a result, both the degradation rate and degradation efficiency decrease. On the other hand, if the CA concentration is too high, the excessive chelating agent competes with RhB for SO4−·, leading to a decrease in the degradation rate of RhB as well.
3.3 Degradation of RhB in Different Systems
Fig. 4 illustrates the degradation performance of RhB in various systems, including PS, mZVI, nZVI, mZVI/PS, nZVI/PS, CA/mZVI/PS, and CA/nZVI/PS. where the reaction conditions for the mZVI/PS system are derived from the optimal degradation conditions based on factorial experiments. As depicted in Fig. 4(a), different reaction systems exhibit significant influence on the degradation of RhB. When mZVI or nZVI was used alone, their individual degradation effects on RhB were notably weak. The addition of PS alone, relying on its oxidation property, led to some degree of degradation of RhB, but the effectiveness remained low. However, simultaneous addition of ZVI and PS resulted in the release of Fe2+ from ZVI, which activated PS to generate SO4−· radicals, as shown in Eqs. (15) and (16). Consequently, the free radicals reacted effectively and significantly improved the removal efficiency. Within 30 minutes, the degradation rate of RhB in the nZVI/PS system increased from 87.435% to 92.691% compared to the mZVI/PS system. Furthermore, in the CA/nZVI/PS system, the removal rate of RhB rose from 90.933% to 94.970% compared to the CA/mZVI/PS system. The impact of ZVI particle size on the degradation of RhB in the system was most apparent at 5 minutes of reaction time. At this stage, the removal rate of RhB in the nZVI/PS system increased by 42.139% compared to the mZVI/PS system, and with the addition of CA, the removal rate in the nZVI/PS system increased by 38.943%. Additionally, the dosage of PS was reduced from 10 to 5 mmol·L−1, while the ZVI dosage was decreased from 0.9 to 0.3 g·L−1.
Fig. 4(b) displays the second-order kinetics and kobs values for the mZVI/PS, nZVI/PS, CA/mZVI/PS, and CA/nZVI/PS systems. According to Fig. 4(b), within 30 minutes, the kobs of RhB in the nZVI/PS system increased from 2.49×10⁻³ to 4.47×10⁻³ L·mg−1·min−1 compared to the mZVI/PS system. After the injection of CA, the kobs of the system reached 5.54×10⁻³ L·mg−1·min−1.
In the ZVI/PS system, complex iron oxides were formed on the surface of ZVI due to the presence of divalent and trivalent iron. In order to identify the oxide species, Fig. 4(b) demonstrates the oxide species after 30 min of reaction for XRD analysis under the optimum conditions of mZVI/PS system and nZVI/PS system. As can be seen from Figs. 4(b), in both systems, multiple diffraction peaks appeared in the ZVI pattern after reaction. Comparison with the standard diffraction peaks of Fe0, FeO, Fe2O3, Fe3O4 and Fe(OH)3 shows that the position of the standard diffraction peak 2θ = 44.8° coincides with that of Fe0; the position of the standard diffraction peaks 2θ = 41.187° and 2θ = 62.728° coincides with that of Fe2O3; the position of the standard diffraction peaks 2θ = 73.059° coincides with that of FeO; and the position of the standard diffraction peaks 2θ = 73.059° coincides with that of the standard diffraction peaks of FeO. Fe3O4 at 2θ = 74.234°; and with Fe(OH)3 at 2θ = 36.373°, 2θ = 60.198°, and 2θ = 65.135°.
However, the difference is that in comparison with the nZVI/PS system, in the mZVI/PS system, the relative content of ZVI is higher, while the content of Fe2O3 is relatively lower. This indicates that mZVI was oxidized to Fe2O3 wrapped around the ZVI surface during the reaction process, making ZVI not sufficiently and continuously oxidized, and the remaining ZVI content was higher.
3.4 nZVI Batch Dosing TestThe practical application of advanced oxidation technology based on SO4−· often involves the use of an excess of PS in order to achieve the desired results. Fig. 5(a) shows the residual amount of PS in the solution at the end of the nZVI/PS and mZVI/PS reactions. However, when PS is overdosed, there can be instances where the activator is consumed too quickly, resulting in non-sustained activation of PS. Furthermore, the self-burst reaction of SO4−· can occur, leading to a rapid increase in the production rate of SO4−·, which further intensifies the self-burst reaction and causes inefficient consumption of PS. To counteract this, it becomes necessary at times to add the activator in batches, allowing for better control of the concentration of SO4−· in the reaction system. This approach helps to optimize the utilization of PS and enhance the overall effectiveness of the process.
As shown in Fig. 5(a), the PS dosage in the mZVI/PS system was 10 mmol·L−1 and the residual amount was 54.39%, while the PS dosage in the nZVI/PS system was 5 mmol·L−1 and the residual amount was 65.52%. From the experimental results, it can be concluded that the PS consumption in the mZVI/PS system was 4.56 mmol·L−1, and the PS consumption in the nZVI/PS system was 1.72 mmol·L−1. The consumption of PS in the mZVI/PS system was much larger than that consumed by the nZVI/PS system, which was about 2.7 times. This indicates that PS was consumed in a large and ineffective way in the mZVI/PS system.
Conducting nZVI batch dosing experiments aimed to maintain a specific concentration of SO4−· in the reaction system. Within the optimal experimental conditions and the total nZVI dosage, the nZVI was divided into primary, secondary, and tertiary injections in equal portions. As depicted in Fig. 5(b), the removal rates of RhB in the primary and secondary dosing groups did not exhibit significant differences. However, a slight decrease in the removal rate was observed in the tertiary dosing group. This decrease could be attributed to the delayed dosing of nZVI in the last batch, resulting in incomplete oxidation of nZVI to Fe2+ and insufficient activation of PS to generate SO4−· for the degradation of RhB.
TOC is one of the markers for determining the success of degradation of organic pollution [37]. Fig. 5(c) shows the TOC of the two systems after the reaction. The results show that the removal rate of TOC by mZVI/PS system is 26.12%. In nZVI/PS system, TOC removal rate reached 44.77%. The TOC removal rate increased by 18.65%.
3.5 Response Surface AnalysisThe interaction of PS dosage, nZVI dosage, and initial pH during RhB degradation is shown in Fig. 6 by three-dimensional response surface method. The interaction of the three factors was weak, among which nZVI dosage had the greatest effect on the actual removal rate of RhB, while PS dosage and the initial pH had a weak effect. According to the analysis of the response surface software Desgin-Expert11.0, the predicted removal rate of RhB reaches 92.980% under optimal conditions, namely nZVI = 0.3 g·L−1, pH = 5, PS = 5 mmol·L−1. The actual removal rate of RhB reached 92.691%, which is close to the calculated result, which indicates that the response surface method is reliable for the optimization of the condition of removing RhB by nZVI activated PS.
3.6 Free Radical Quenching TestsFree radical quench experiments were conducted to determine the primary radicals involved in the removal of RhB using the nZVI/PS system. Ethanol was utilized as the SO4−· quencher, while tert-butanol served as the ·OH quencher. Experimental results displayed in Fig. 7 demonstrate that in the nZVI/PS system, the presence of ethanol as a free radical burster led to a decrease in the RhB removal rate from 92.69% to 18.08%, a reduction of 74.61% compared to the group without ethanol. Similarly, the degradation rate of RhB decreased from 92.69% to 76.39%, a reduction of 16.30% when tert-butanol was used as the free radical burster. These findings suggest that both SO4−· and ·OH radicals contribute to the degradation of RhB. However, in this experimental process, SO4−· plays a dominant role.
3.7 Proposed Destruction Pathway of RhBTo investigate the degradation products and degradation pathways of RhB in the nZVI/PS system, the treated water samples were analyzed spectroscopically by GC-MS (Agilent Technologies, 7890A 5975C, USA), the related substances produced is shown in Fig. S3 and Table S1. The oxidized groups involved in the RhB reaction for oxidative degradation were mainly S2O4 2−, ·OH, and SO4−·. Under their combined action, RhB was attacked by the deethylation reaction to form the N-deethyl product. Secondly, the conjugated structure of the n-deethylated product was attacked by free radicals and discoloration occurred, resulting in phenyl-methylene acetophenone and 3-(2-amino-phenyl)-1-phenyl-propynone. Subsequently, these phenylcyclic species were oxidized by SO4−· and OH· to produce straight-chain organic compounds such as ethylene glycol, 5-decanone, and 2-isopropylbutyraldehyde. Eventually, these straight chains were further mineralized into water and carbon dioxide by oxidation with SO4−·.
Based on the above analysis, the proposed mechanism of RhB degradation by ZVI-activated persulfate can be roughly described as shown in Fig. 8.
4. ConclusionsCompared with the optimal reaction conditions of the mZVI/PS system, in the nZVI/PS system, the PS dosage was reduced from 10 to 5 mmol·L−1 and the ZVI dosage was reduced from 0.9 to 0.3 g·L−1, and the reaction time was significantly reduced.
Relative to the mZVI/PS system, the nZVI/PS system consumed less PS by 2.84 mmol·L−1. At the same time, the TOC removal rate increased by 18.65%.
The reactions all followed the pseudo-secondary kinetic equations. Compared with the mZVI/PS system, the kobs of the nZVI/PS system increased from 2.49×10⁻³ to 4.47×10⁻³ L·mg−1·min−1. The kobs was again increased by 1.07×10⁻³ L·mg−1·min−1 after the addition of CA.
RhB probably undergoes N-deethylation reaction under the attack of free radicals and further mineralization to H2O and CO2.
AcknowledgementsThis work was in supported by the Program of Science and Technology of Sichuan Province of China under grant 2021ZYD0012, 2022NSFSC0532.
NotesConflict-of-Interest Statement The authors declare that they have no known competing financial interests or personal relationships that could have appeared to influence the work reported in this paper. Author Contributions Y. T. L. (Associate Professor) supervised the thesis. Y. X. L. (Master student) concepted, wrote, and revised the manuscript. X. L. (Associate Research Fellow) adviced about the manuscript. H. L. (Master student) wrote the manuscript. W. Y. D. (Master student) wrote the manuscript. J. L. C. (Master student) wrote the manuscript. References1. Liu X, Yang Y, Shi X, Li K. Fast photocatalytic degradation of methylene blue dye using a low-power diode laser. J. Hazard. Mater. 2015;283:267–275.
https://doi.org/10.1016/j.jhazmat.2014.09.031
2. Rajasimman M, Babu SV, Rajamohan N. Biodegradation of textile dyeing industry wastewater using modified anaerobic sequential batch reactor – Start-up, parameter optimization and performance analysis. J. Taiwan Inst. Chem. Eng. 2017;72:171–181.
https://doi.org/10.1016/j.jtice.2017.01.027
3. Velusamy S, Roy A, Sundaram S, Mallick TK. A Review on Heavy Metal Ions and Containing Dyes Removal Through Graphene Oxide-Based Adsorption Strategies for Textile Wastewater Treatment. Chem. Rec. 2021;21:1570–1610.
https://doi.org/10.1002/tcr.202000153
4. Shindhal T, Rakholiya P, Varjani S, et al. A critical review on advances in the practices and perspectives for the treatment of dye industry wastewater. Bioengineered. 2021;12:70–87.
https://doi.org/10.1080/21655979.2020.1863034
5. Za’im MNN, Yusop HM, Ismail WNW. Synthesis of Water- Repellent Coating for Polyester Fabric. Emerg. Sci. J. 2021;5:747–754.
https://doi.org/10.28991/esj-2021-01309
6. Chowdhury MF, Khandaker S, Sarker F, Islam A, Rahman MT, Awual R. Current treatment technologies and mechanisms for removal of indigo carmine dyes from wastewater: A review. J. Mol. Liq. 2020;318:114061.
https://doi.org/10.1016/j.molliq.2020.114061
7. Jawad AH, Mamat NFH, Hameed BH, Ismail K. Biofilm of cross-linked Chitosan-Ethylene Glycol Diglycidyl Ether for removal of Reactive Red 120 and Methyl Orange: Adsorption and mechanism studies(Article). J. Environ. Chem. Eng. 2019;7:102965.
https://doi.org/10.1016/j.jece.2019.102965
8. Levchuk I, Sillanpää M. Chapter 1 - Titanium dioxide–based nanomaterials for photocatalytic water treatment. Adv. Water Treat. 2020;1–56.
https://doi.org/10.1016/B978-0-12-819225-2.00001-6
9. Raji VR, Packialakshmi S. Assessing the Wastewater Pollutants Retaining for a Soil Aquifer Treatment using Batch Column Experiments. Civ. Eng. J. 2022;8:1482–1491.
https://doi.org/10.28991/cej-2022-08-07-011
10. Kubra KT, Salman S, Znad H, Hasan N. Efficient encapsulation of toxic dye from wastewater using biodegradable polymeric adsorbent. J. Mol. Liq. 2021;329:115541.
https://doi.org/10.1016/j.molliq.2021.115541
11. Khadim AT, Albayati TM, Saady NMC. Removal of sulfur compounds from real diesel fuel employing the encapsulated mesoporous material adsorbent Co/MCM-41 in a fixed-bed column. Microporous Mesoporous Mater. 2022;341:112020.
https://doi.org/10.1016/j.micromeso.2022.112020
12. Ismail WNW, Syah MIAI, Muhet NHA, Bakar NHA, Yusop HM, Samah NA. Adsorption Behavior of Heavy Metal Ions by Hybrid Inulin-TEOS for Water Treatment. Civ. Eng. J. 2022;8:1787–1798.
https://doi.org/10.28991/cej-2022-08-09-03
13. Dahmani MA, Huang K, Hoag GE. Sodium Persulfate Oxidation for the Remediation of Chlorinated Solvents (USEPA Superfund Innovative Technology Evaluation Program). Water Air Soil Pollut: Focus. 2006;6:127–141.
https://doi.org/10.1007/s11267-005-9002-5
14. Yang S, Yang X, Shao X, Niu R, Wang L. Activated carbon catalyzed persulfate oxidation of Azo dye acid orange 7 at ambient temperature. J. Hazard. Mater. 2011;186:659–666.
https://doi.org/10.1016/j.jhazmat.2010.11.057
15. Mustafa FS, Aziz KHH. Heterogeneous catalytic activation of persulfate for the removal of rhodamine B and diclofenac pollutants from water using iron-impregnated biochar derived from the waste of black seed pomace. PROCESS. SAF. ENVIRON. 2023;170:436–448.
https://doi.org/10.1016/j.psep.2022.12.030
16. Aziz KHH. Heterogeneous catalytic activation of peroxydisulfate toward degradation of pharmaceuticals diclofenac and ibuprofen using scrap printed circuit board. RSC Adv. 2022;13:115–128.
https://doi.org/10.1039/d2ra07263g
17. Chen F, Li X, Ma J, Qu J, Yang Y, Zhang S. Remediation of soil co-contaminated with decabromodiphenyl ether (BDE-209) and copper by enhanced electrokinetics-persulfate process. J. Hazard. Mater. 2019;369:448–455.
https://doi.org/10.1016/j.jhazmat.2019.02.043
18. Chen W, Huang C. Mineralization of aniline in aqueous solution by electrochemical activation of persulfate. Chemosphere. 2015;125:175–181.
https://doi.org/10.1016/j.chemosphere.2014.12.053
19. Darsinou B, Frontistis Z, Antonopoulou M, Konstantinou I, Mantzavinos D. Sono-activated persulfate oxidation of bisphenol A: Kinetics, pathways and the controversial role of temperature(Article). Chem. Eng. J. 2015;280:623–633.
https://doi.org/10.1016/j.cej.2015.06.061
20. Deng D, Lin X, Ou J, et al. Efficient chemical oxidation of high levels of soil-sorbed phenanthrene by ultrasound induced, thermally activated persulfate. Chem. Eng. J. 2015;265:176–183.
https://doi.org/10.1016/j.cej.2014.12.055
21. Gao Yq, Gao Ny, Deng Y, Yang Yq, Ma Y. Ultraviolet (UV) light-activated persulfate oxidation of sulfamethazine in water. Chem. Eng. J. 2012;(195–196)248–253.
https://doi.org/10.1016/j.cej.2012.04.084
22. Bajagain R, Jeong SW. Degradation of petroleum hydrocarbons in soil via advanced oxidation process using peroxymonosulfate activated by nanoscale zero-valent iron. Chemosphere. 2021;270:128627.
https://doi.org/10.1016/j.chemosphere.2020.128627
23. Gao Yq, Gao Ny, Wang W. Ultrasound-assisted heterogeneous activation of persulfate by nano zero-valent iron (nZVI) for the propranolol degradation in water. Ultrason. Sonochem. 2018;49:33–40.
https://doi.org/10.1016/j.ultsonch.2018.07.001
24. Kim C, Ahn JY, Kim TY, Shin WS, Hwang I. Activation of Persulfate by Nanosized Zero-Valent Iron (NZVI): Mechanisms and Transformation Products of NZVI. Environ. Sci. Technol. 2018;52:3625–3633.
https://doi.org/10.1021/acs.est.7b05847
25. Li YT, Zhang JJ, Li YH, Chen JL, Du WY. Treatment of soil contaminated with petroleum hydrocarbons using activated persulfate oxidation, ultrasound, and heat: A kinetic and thermodynamic study. Chem. Eng. J. 2022;428:131336.
https://doi.org/10.1016/j.cej.2021.131336
26. Huang P, Zhang P, Wang C, Du X, Jia H, Sun H. P-doped biochar regulates nZVI nanocracks formation for superefficient persulfate activation. J. Hazard. Mater. 2023;450:130999.
https://doi.org/10.1016/j.jhazmat.2023.130999
27. Liang C, Huang CF, Mohanty N, Kurakalva RM. A rapid spectrophotometric determination of persulfate anion in ISCO. Chemosphere. 2008;73:1540–1543.
https://doi.org/10.1016/j.chemosphere.2008.08.043
28. Honarmandrad Z, Sun X, Wang Z, Naushad M, Boczkaj G. Activated persulfate and peroxymonosulfate based advanced oxidation processes (AOPs) for antibiotics degradation – A review. Water Resour. Ind. 2023;29:100194.
https://doi.org/10.1016/j.wri.2022.100194
29. Fan J, Liu J, Cai Y, Liu Z, Wu D. Efficient degradation of tetracycline in FeS-based SR-AOPs process at basic pHs: The overlooked role of metal complexation and redox reaction in persulfate activation. Chem. Eng. J. 2023;466:143168.
https://doi.org/10.1016/j.cej.2023.143168
30. Ganiyu SO, Arslan M, El-Din MG. Combined solar activated sulfate radical-based advanced oxidation processes (SR-AOPs) and biofiltration for the remediation of dissolved organics in oil sands produced water. Chem. Eng. J. 2022;433:134579.
https://doi.org/10.1016/j.cej.2022.134579
31. Gu M, Sui Q, Farooq U, Zhang X, Qiu Z, Lyu S. Degradation of phenanthrene in sulfate radical based oxidative environment by nZVI-PDA functionalized rGO catalyst. Chem. Eng. J. 2018;354:541–552.
https://doi.org/10.1016/j.cej.2018.08.039
32. Xie Y, Cwiertny DM. Use of Dithionite to Extend the Reactive Lifetime of Nanoscale Zero-Valent Iron Treatment Systems. Environ. Sci. Technol. 2010;44:8649–8655.
https://doi.org/10.1021/es102451t
33. Liang C, Bruell CJ, Marley MC, Sperry KL. Persulfate oxidation for in situ remediation of TCE. I. Activated by ferrous ion with and without a persulfate–thiosulfate redox couple. Chemosphere. 2004;55:1213–1223.
https://doi.org/10.1016/j.chemosphere.2004.01.029
34. Yu S, Gu X, Lu S. Degradation of phenanthrene in aqueous solution by a persulfate/percarbonate system activated with CA chelated-Fe(II). Chem. Eng. J. 2018;333:122–131.
https://doi.org/10.1016/j.cej.2017.09.158
35. Pouran SR, Raman AAA, Daud WMAW. Review on the application of modified iron oxides as heterogeneous catalysts in Fenton reactions. J. Clean. Prod. 2014;64:24–35.
https://doi.org/10.1016/j.jclepro.2013.09.013
36. Deng J, Shao Y, Gao N, Deng Y, Zhou S, Hu S. Thermally activated persulfate (TAP) oxidation of antiepileptic drug carbamazepine in water. Chem. Eng. J. 2013;228:765–771.
https://doi.org/10.1016/j.cej.2013.05.044
37. Ali NS, Kalash KR, Ahmed AN, Albayati TM. Performance of a solar photocatalysis reactor as pretreatment for wastewater via UV, UV/TiO2, and UV/H2O2 to control membrane fouling. Sci Rep. 2022;12:16782.
https://doi.org/10.1038/s41598-022-20984-0
Fig. 1(a) XRD patterns of nZVI. (b) Particle size distribution diagram of nZVI. (c) SEM images of nZVI 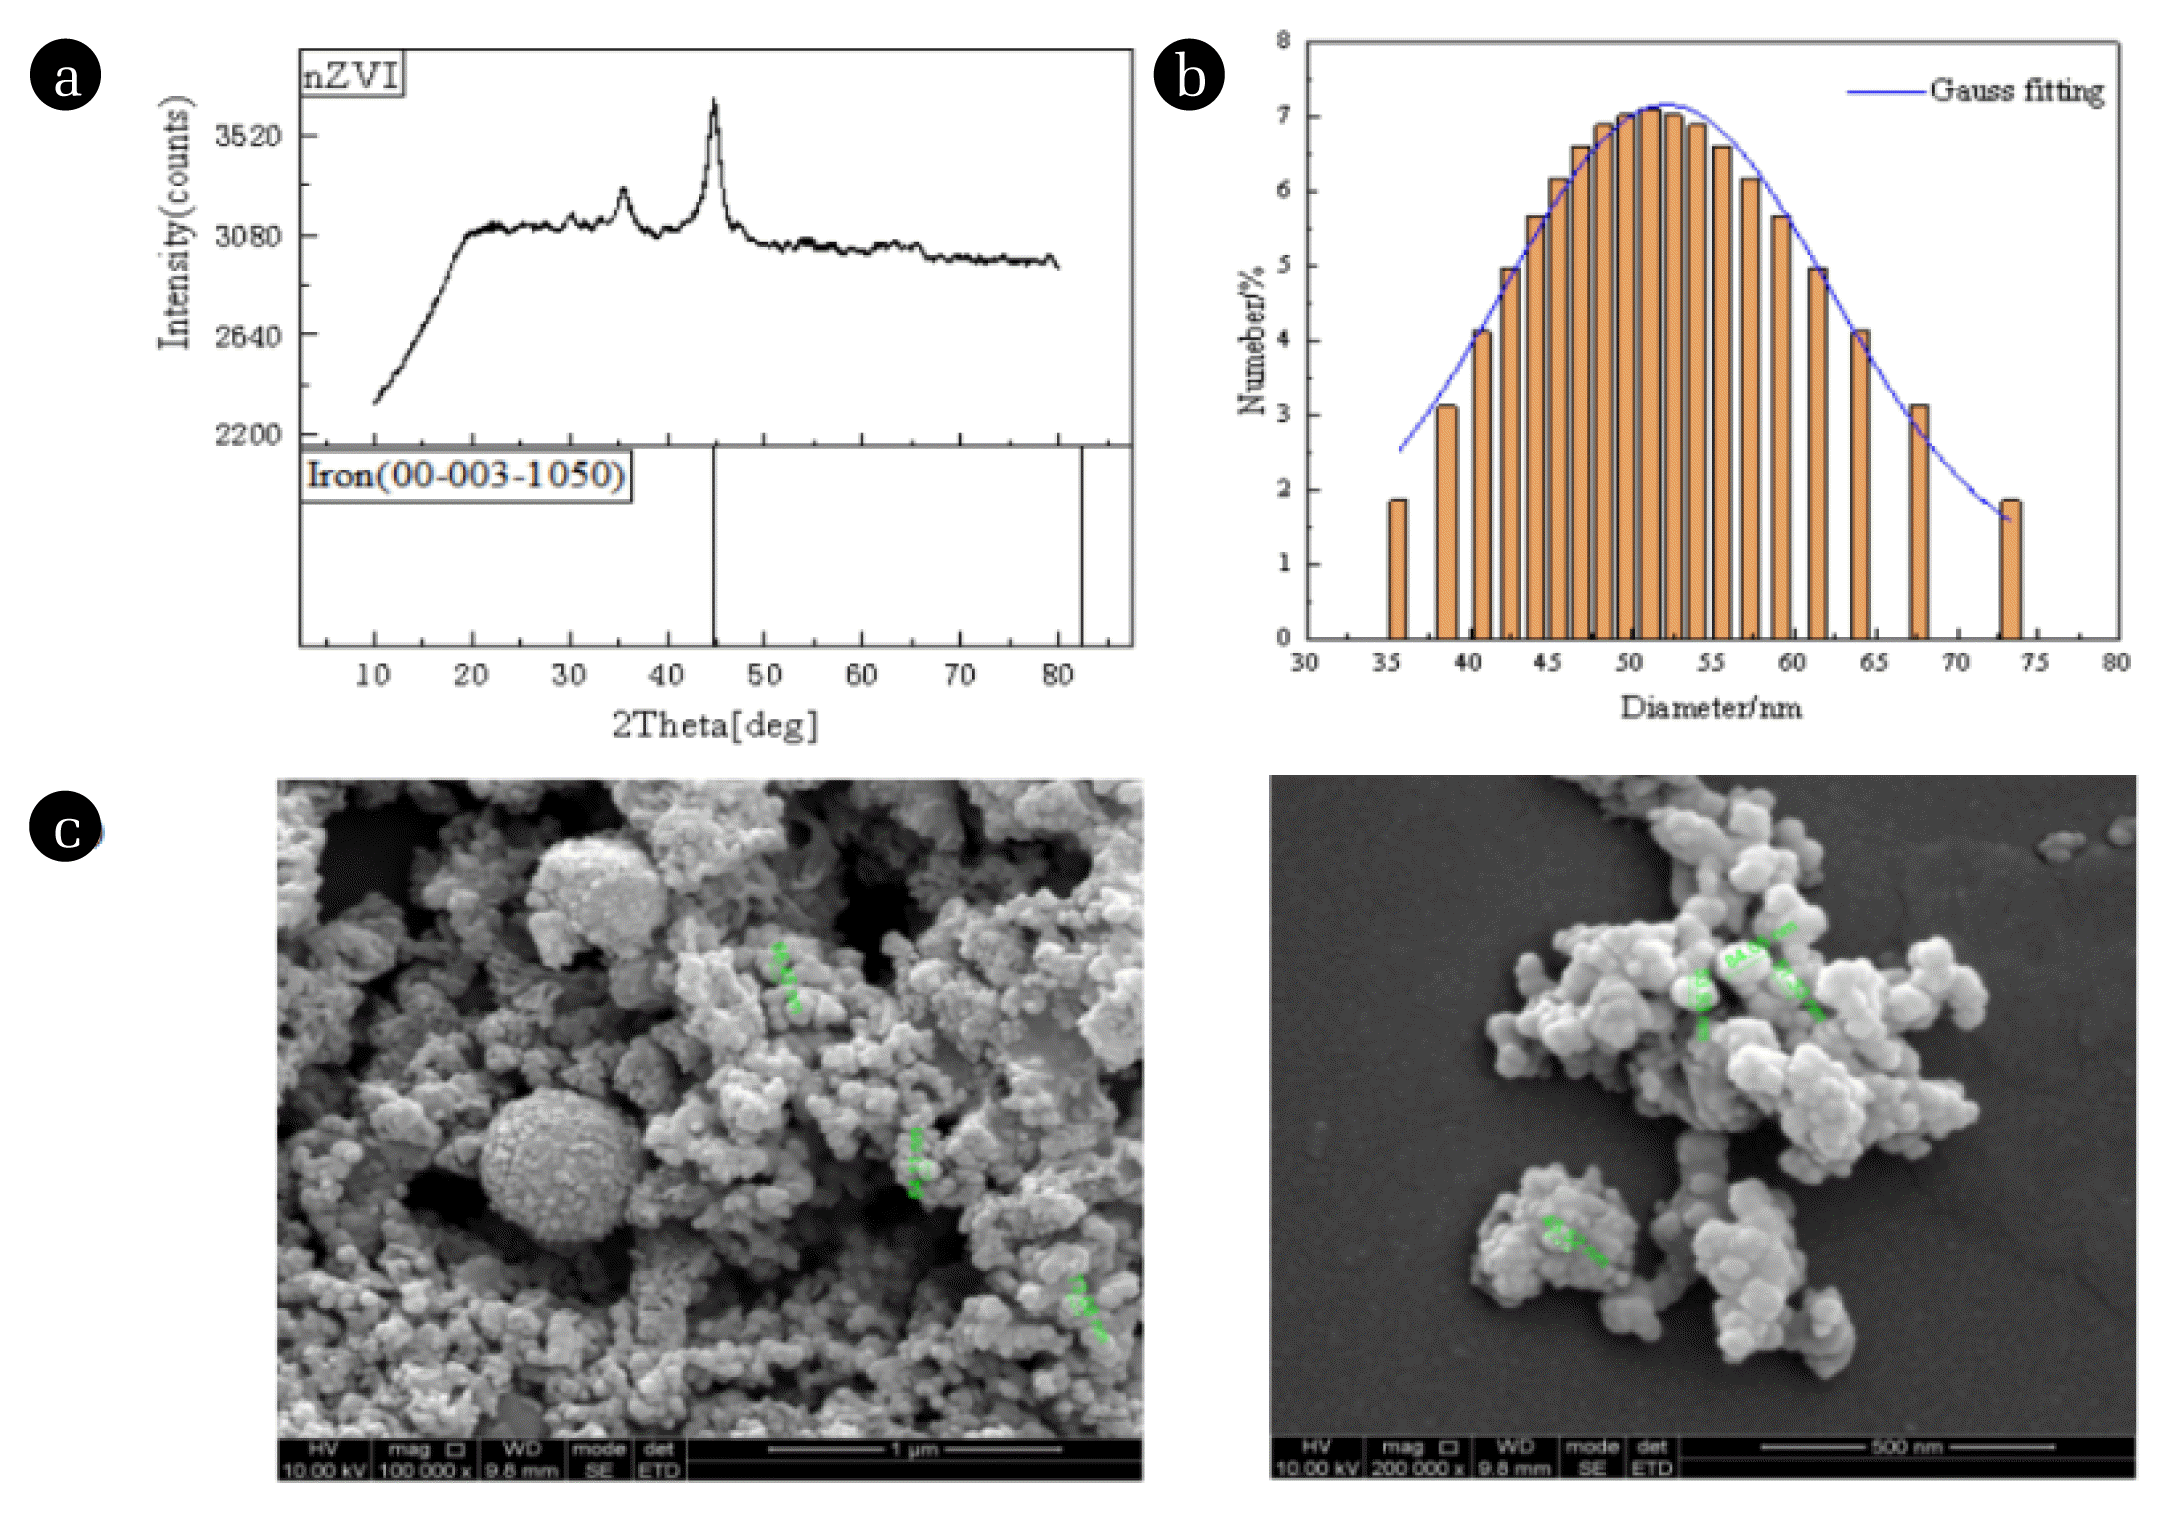
Fig. 2Effect of PS dosage, nZVI dosage and initial pH on RhB removal. (a) Effect of PS dosage on RhB removal. (b) The pseudo-second-order constant on different PS concentrations. Experimental conditions: [RhB]0 = 100 mg·L−1; nZVI dosage = 0.5 g·L−1; initial pH = 3.5. (c) Effect of PS dosage on RhB removal. (d) The pseudo-second-order constant on different PS concentrations. Experimental conditions: [RhB]0 = 100 mg·L−1; nZVI dosage = 0.5 g·L−1; initial pH = 3.5. (e) Effect of initial pH on RhB removal. (f) The pseudo-second-order constant on different initial pH values. Experimental conditions: [RhB]0 = 0.1 g·L−1; nZVI dosage = 0.3 g·L−1; PS dosage = 5 mmol·L−1
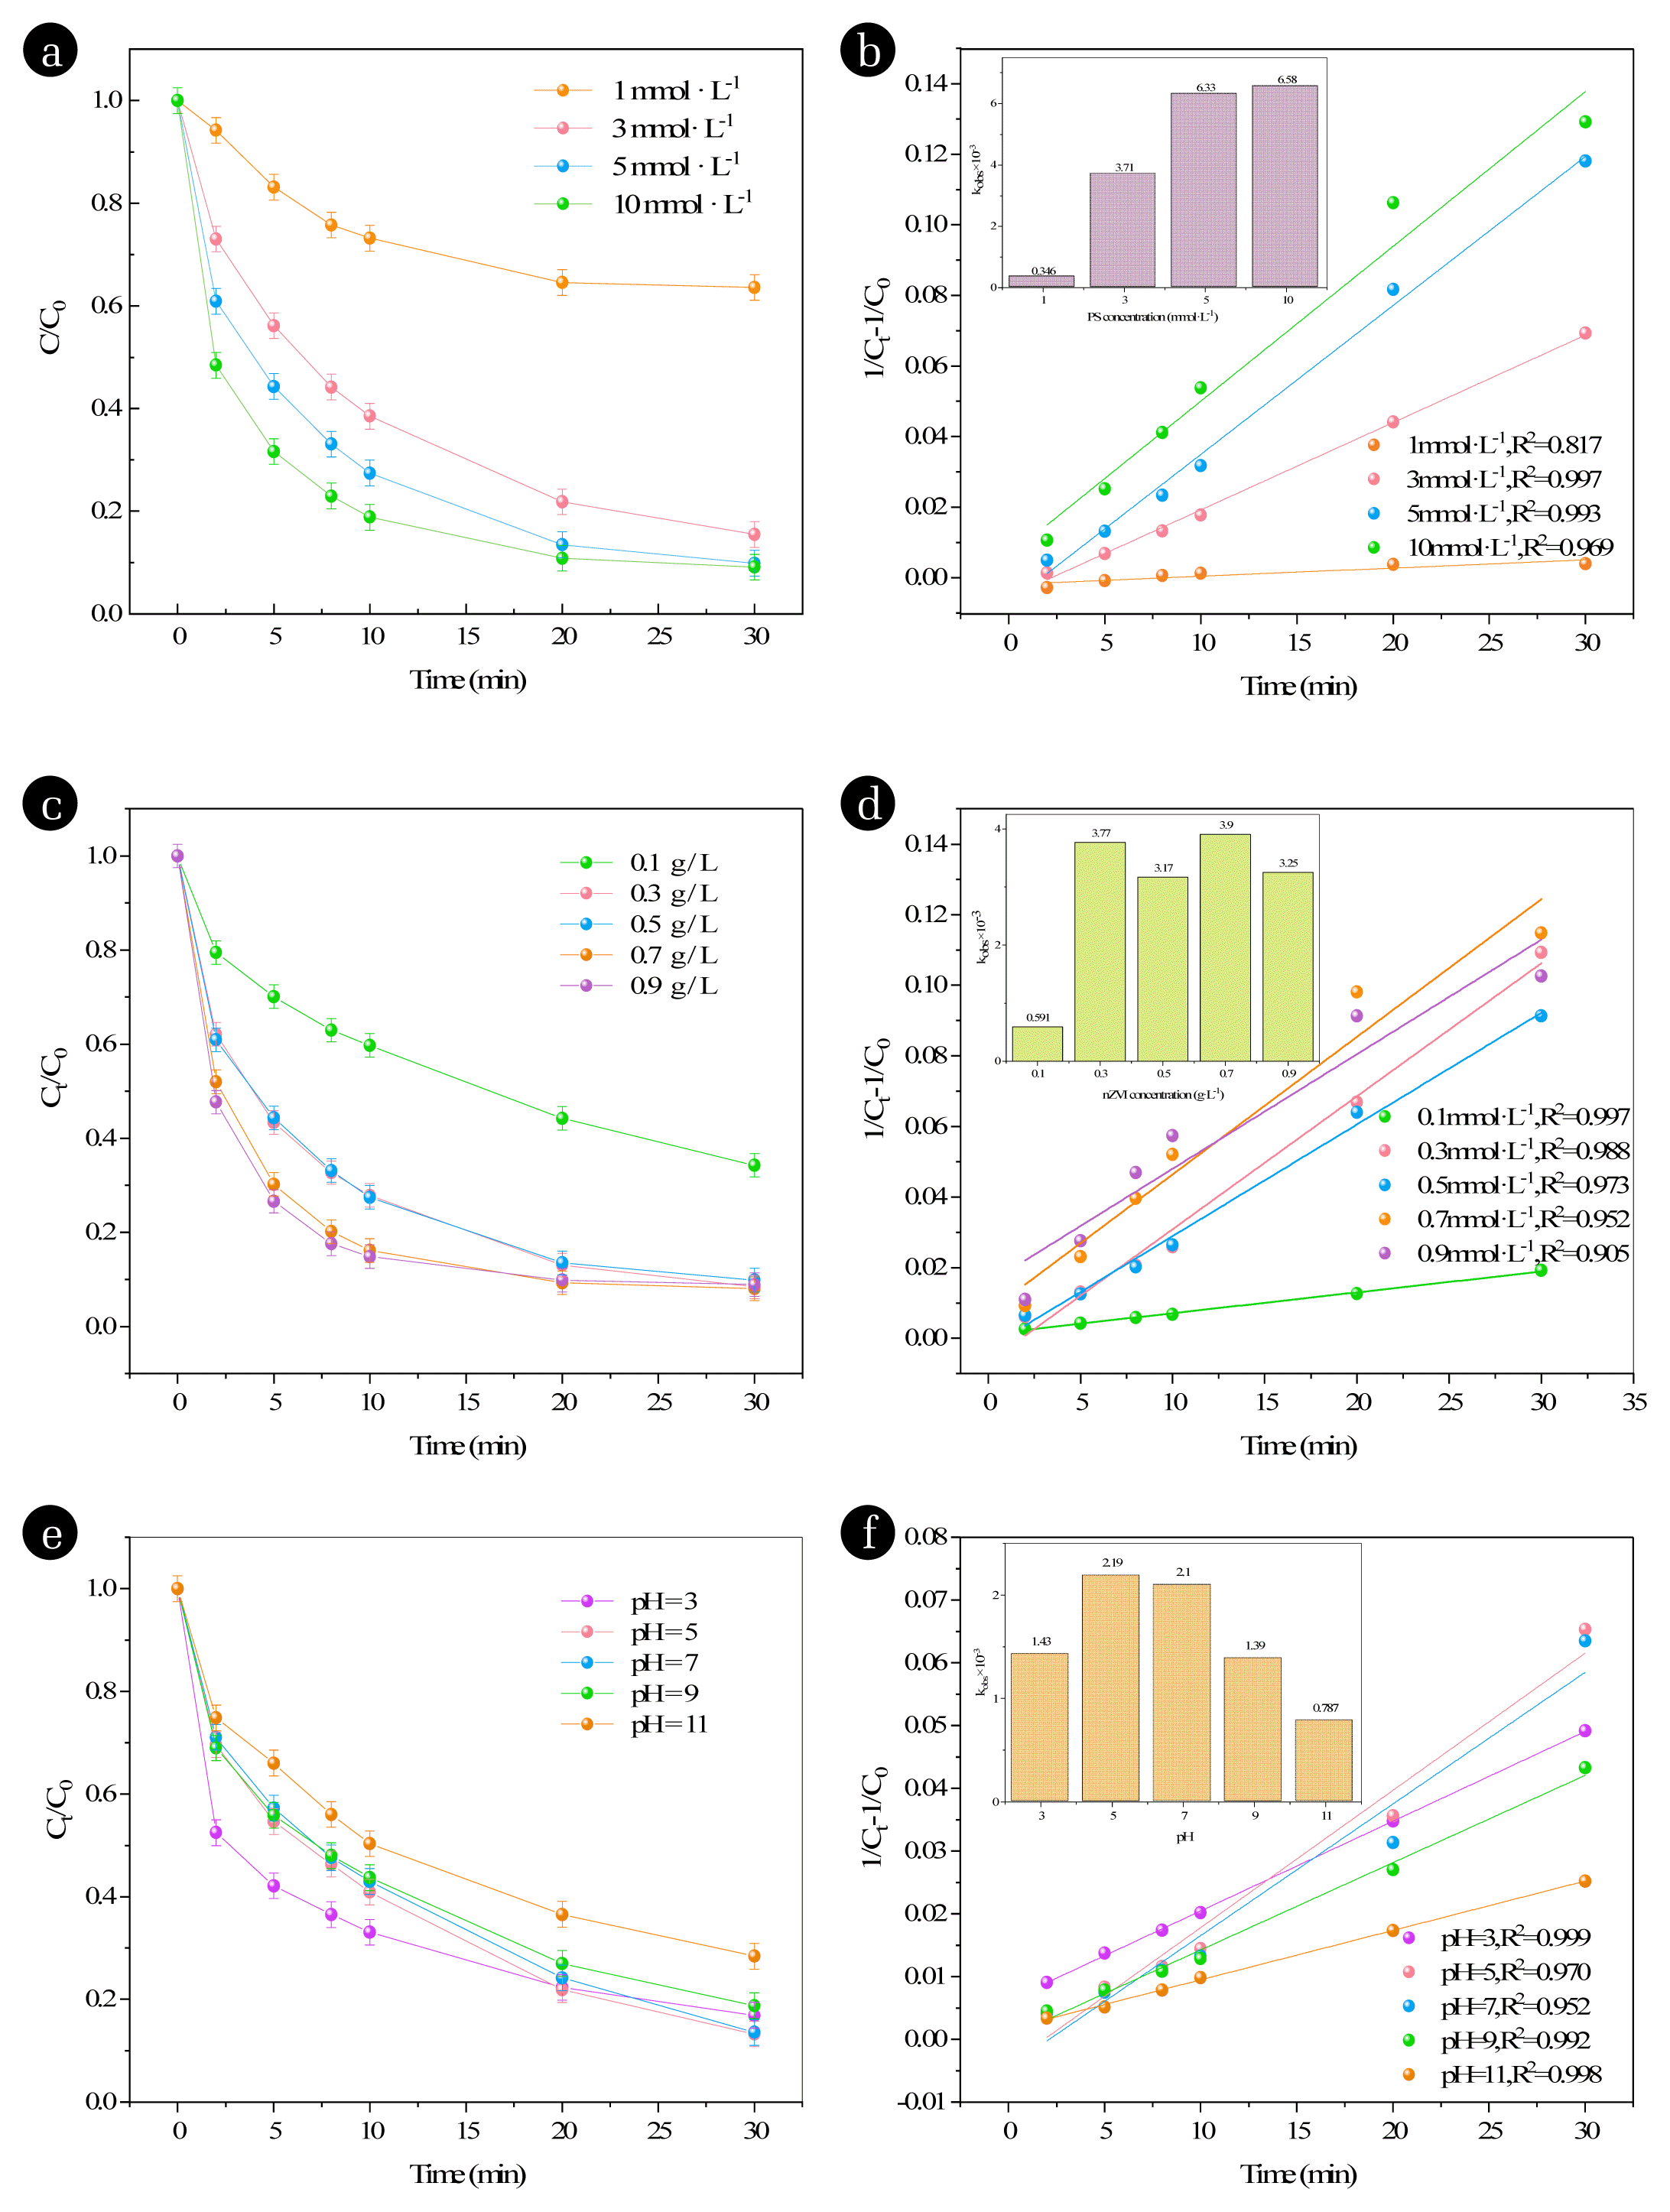
Fig. 3(a) Effect of CA dosage on RhB removal. (b) The pseudo-second-order constant on different CA concentrations. Experimental conditions: [RhB]0 = 0.1 g·L−1; nZVI dosage = 0.3 g·L−1; PS dosage = 5 mmol·L−1; initial pH = 5. 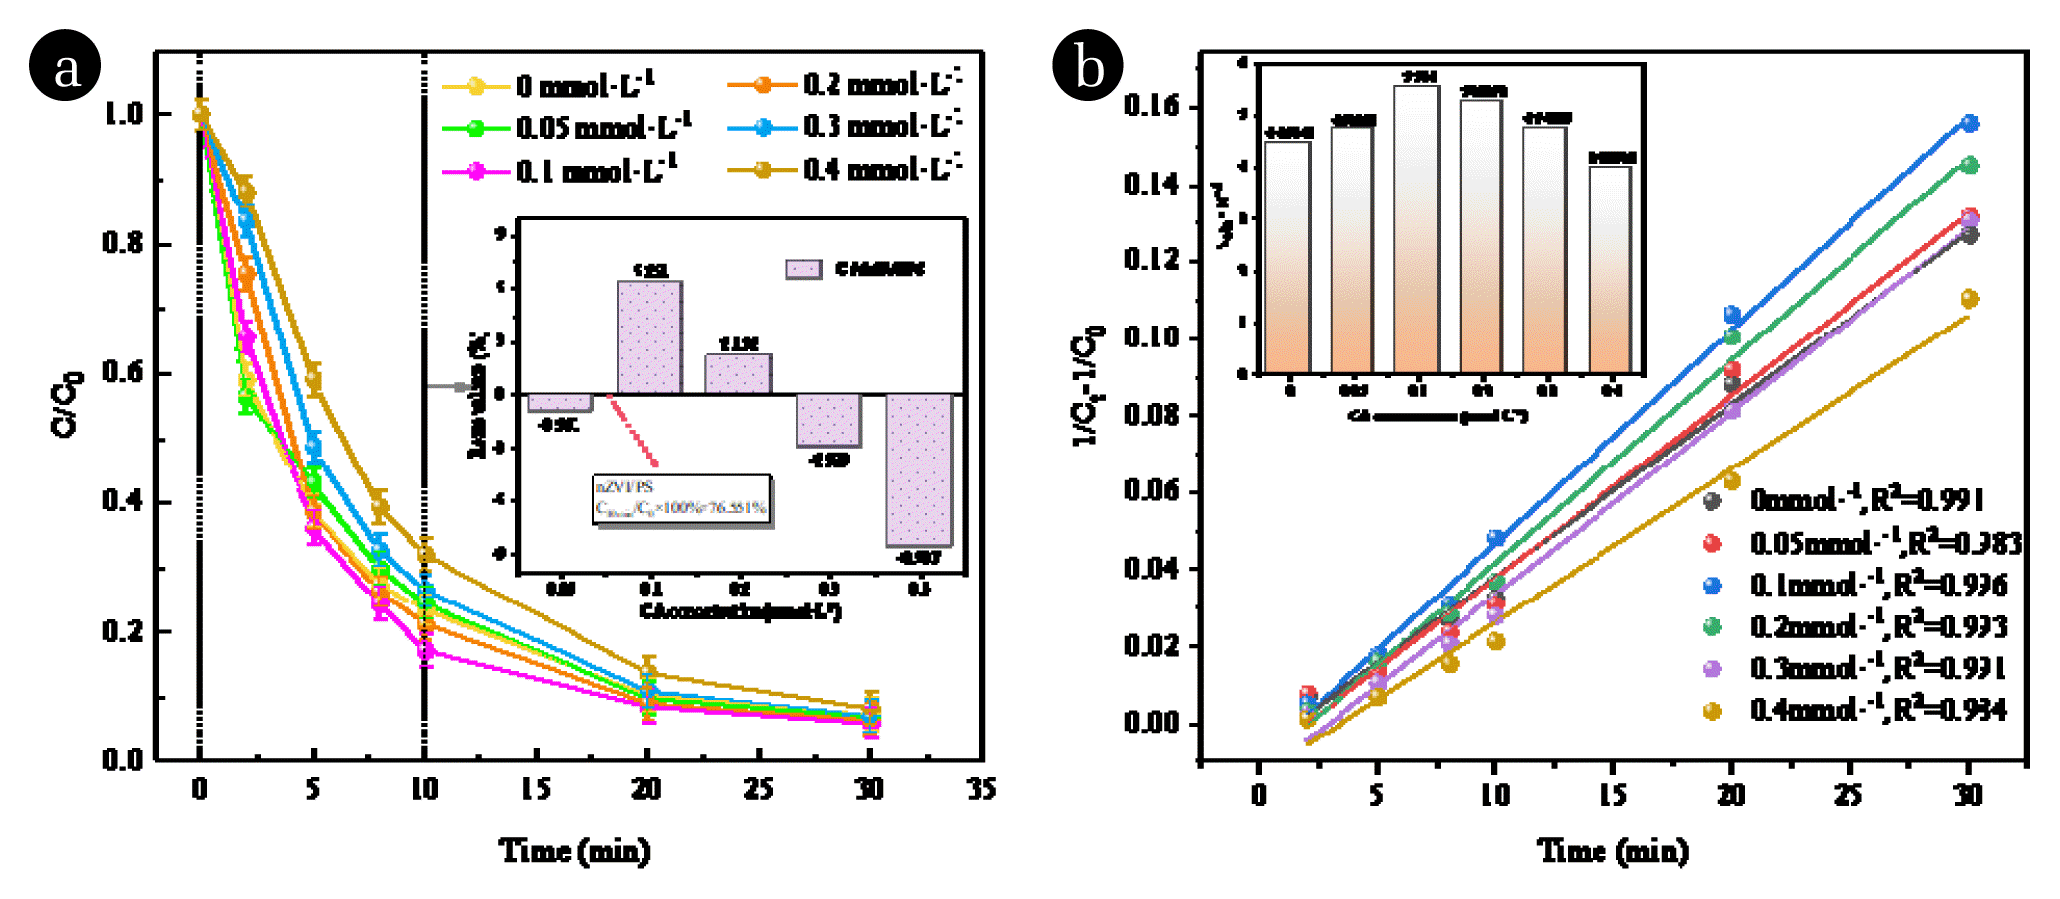
Fig. 4(a) Degradation of RhB under different systems. (b) The pseudo-second-order constant on different systems. Experimental conditions: nZVI/PS: [RhB]0 = 0.1 g·L−1, nZVI dosage = 0.3 g·L−1, PS dosage = 5 mmol·L−1, initial pH = 5; mZVI/PS: [RhB]0 = 0.1 g·L−1; nZVI dosage = 0.9 g·L−1; PS dosage = 10 mmol·L−1; initial pH = 5. 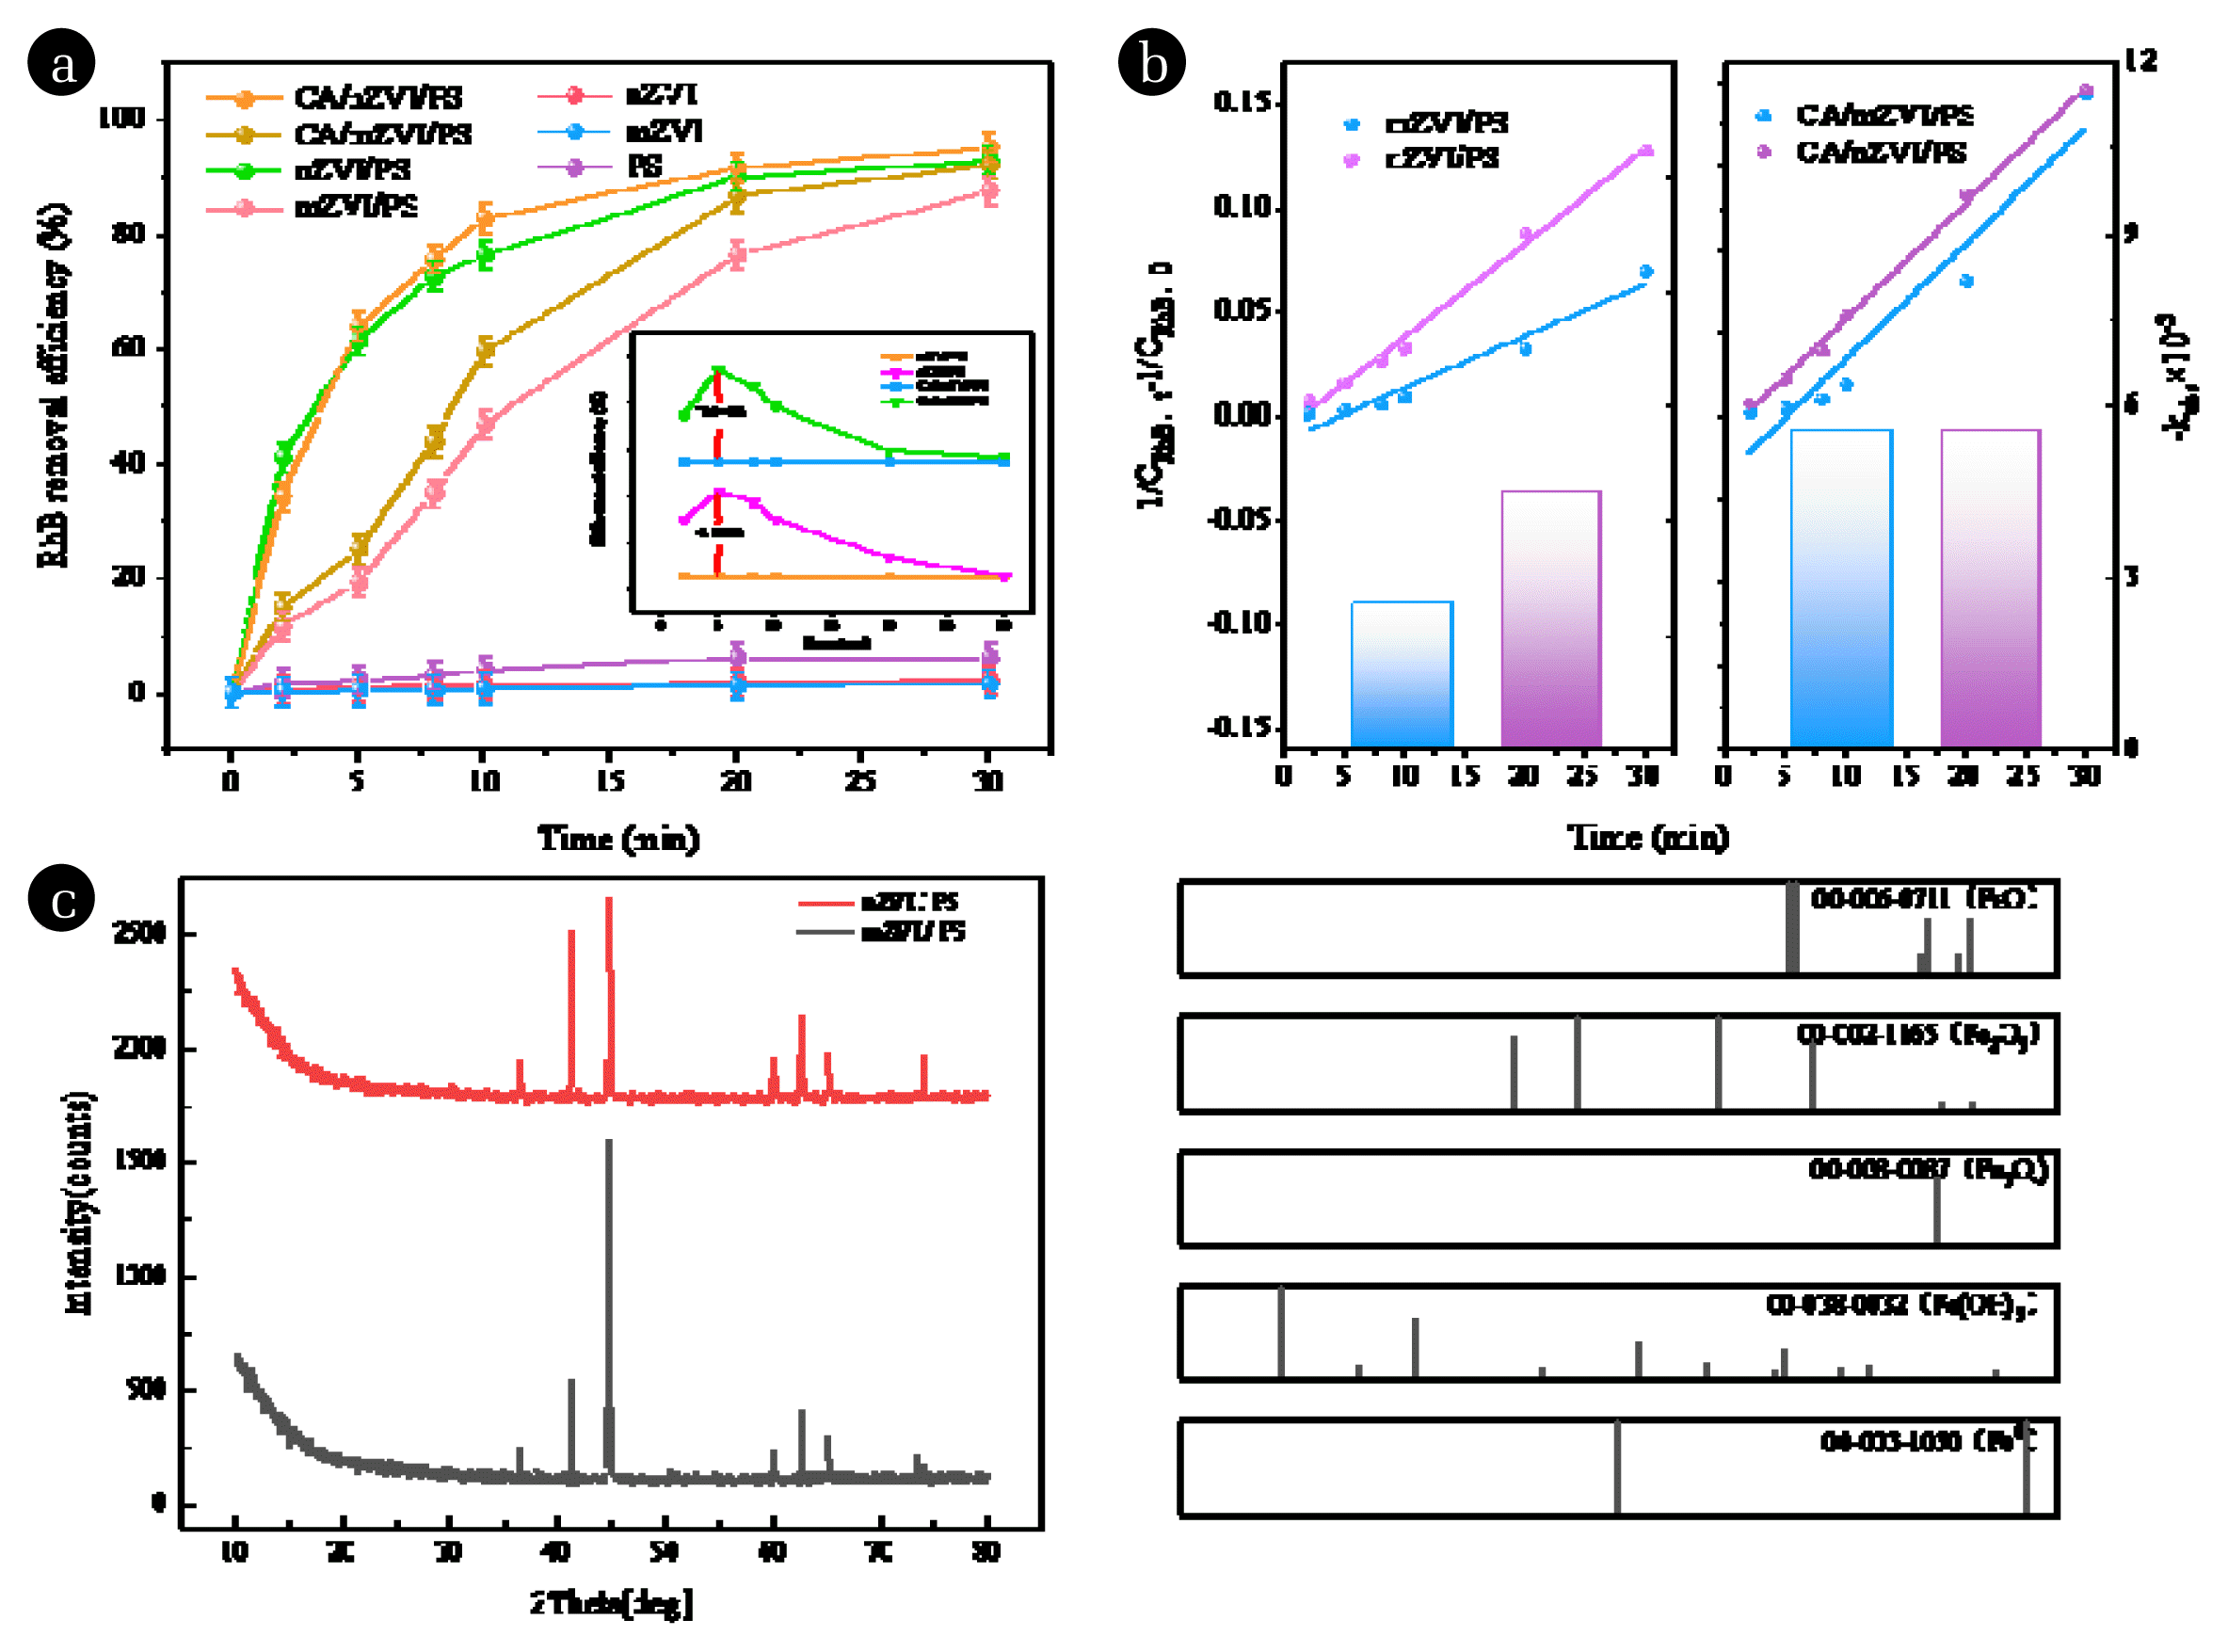
Fig. 5(a) Determination of PS residual amount. (b) Effect of batch dosage on RhB removal. (c) The curve of TOC. Experimental conditions: nZVI/PS: [RhB]0 = 0.1 g·L−1; nZVI dosage = 0.3 g·L−1; PS dosage = 5 mmol·L−1; initial pH = 5. mZVI/PS: [RhB]0 = 0.1 g·L−1; mZVI dosage = 0.9 g·L−1; PS dosage = 10 mmol·L−1; initial pH = 5 
Fig. 63D response surface diagram of the effect of PS dosage, nZVI dosage and initial pH factor interaction on RhB removal rate 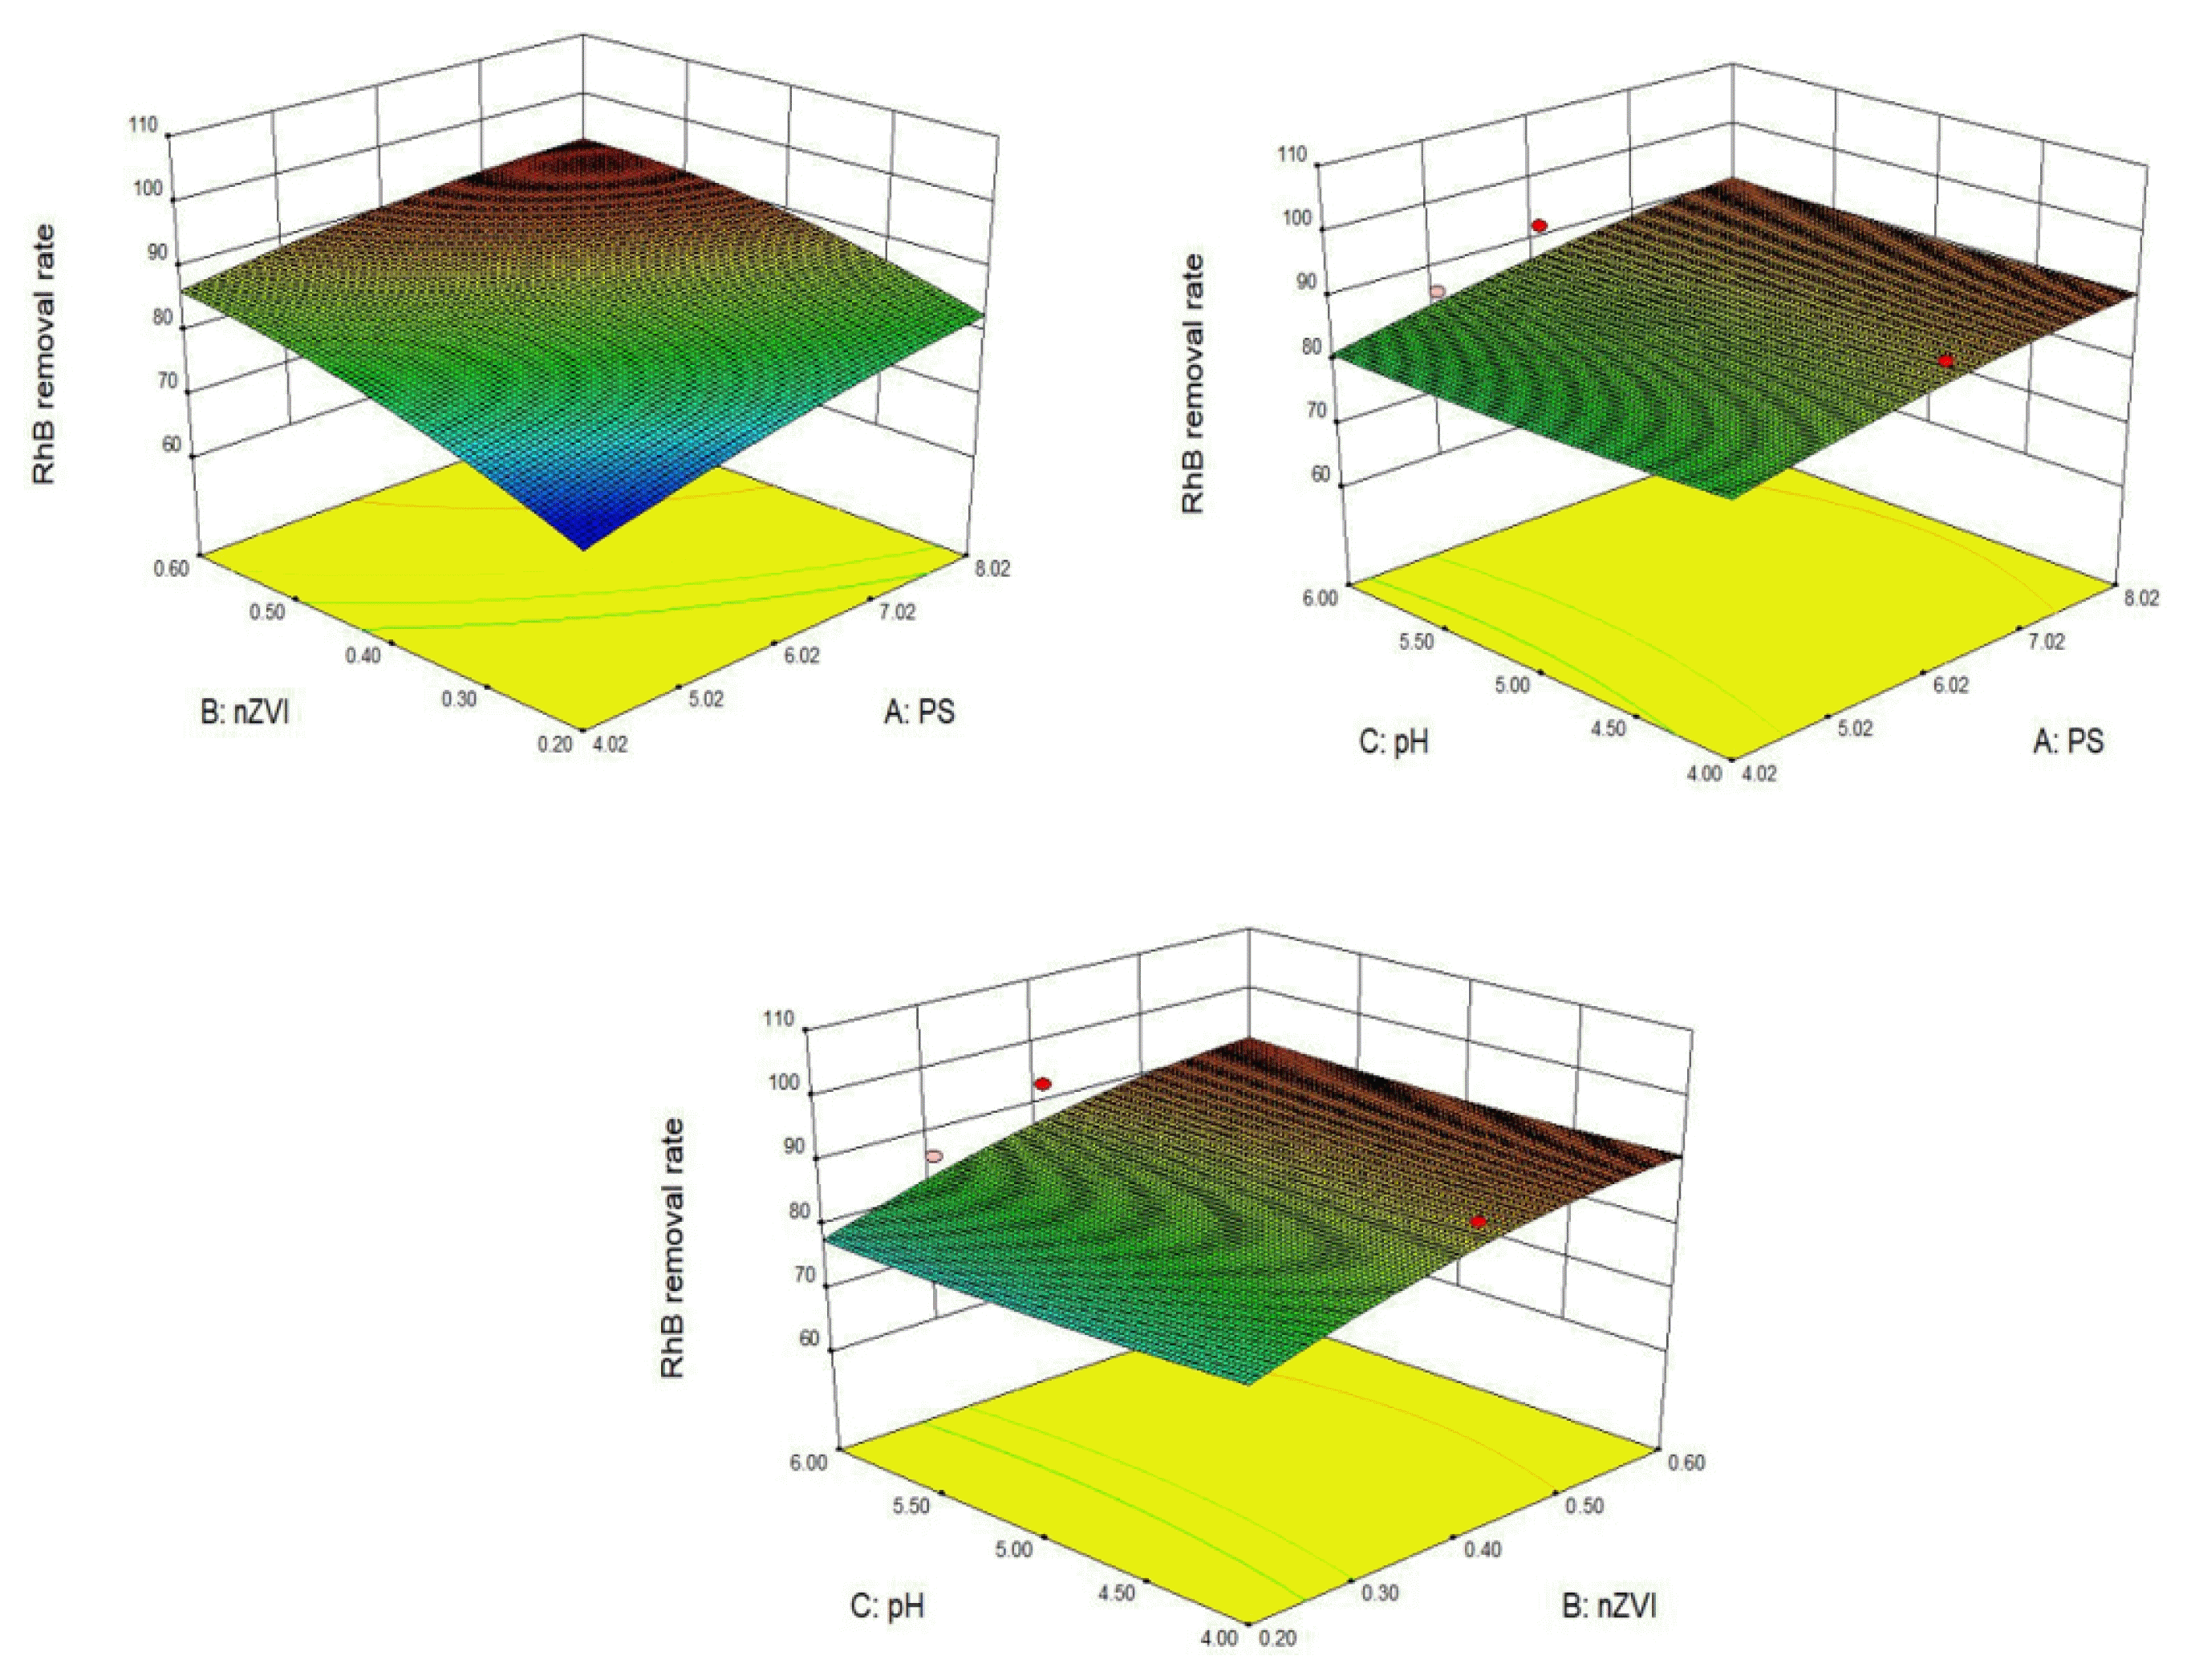
|
|
|||||||||||||||||||||||||||||||||||||