1. Introduction
Aquaculture is an increasingly important source of global food production and reduces poverty by enhancing the source of income [1]. However, the culture posed a challenge to the environment as substances such as ammonia, nitrite, nitrate, phosphate, and suspended solids accumulate over time due to fish metabolism and the bacterial decomposition of uneaten feed and feces [2]. The composition of aquaculture wastewater varies by cultured fish species, culture's intensity, production, and the strategy involved in the management. The nutrient level in the waters of some commercially important aquaculture species was compiled to range between 0.1 – 24 mg/L TAN, and 10 – 62.8 mg/L phosphate for tilapia fishes. The water for shrimp culture has TAN in the range of 0.23 – 100 mg/L and phosphate at 3.7 – 10.8 mg/L [3, 4]. However, it’s important to note that in most cases, the nutrient concentration is low in the growing tanks or the supernatant of aquaculture wastewater compared to the system's sludge obtained from the bottom of aquaculture systems [5] or settling tanks. For example, Barnharst et al. [3], show that the settling tank of shrimp accumulates up to 204.6 mg/L TAN. Further, Malibari et al., [6] reported the ammonium concentration of shrimp farm wastewater as 443 mg/L.
Nitrite and ammonia are aquatic organisms' most common toxic nitrogenous pollutants [7]. However, the toxicity of TAN depends on the pH of the wastewater, which affects the equilibrium of NH3 and NH4+ forms of TAN in a solution. A pH above 9.0 is of concern since TAN will have more concentration of NH3, which is toxic and detrimental to aquatic life [8, 9]. On the other hand, nitrite is toxic as it affects blood haemoglobin to carry oxygen [10]. Therefore, the combined effects of toxic substances decrease the water quality [11], necessitating the discharge of the water to avoid a negative impact on cultured fish. However, discharging such water negatively affect the receiving environment [2], directly or indirectly, hence human health. Thanks to the recent research focus on biological approaches, which involved the use/manipulation of microbial processes to recycle nutrients for water quality and generate biomass as feed, thus preventing wastewater discharge and minimizing or achieving zero-water exchange. Some aquaculture systems that use microbial nutrient recycling for water quality control include biofloc technology [12], and photosynthetic-based or microalgae-assisted aquaculture systems [4, 5, 13].
Photosynthesis, nitrification, and heterotrophic are three microbial processes dominating water quality control in pond aquaculture [13]. Photosynthetic organisms like microalgae absorb inorganic carbon dioxide and bicarbonate (CO2 and HCO3) through photosynthesis while utilizing the available nutrients of wastewater, such as nitrogen and phosphorous in their soluble inorganic forms, as the primary source of growth and maintenance [14, 15]. Further, microalgae can use organic carbon through mixotrophy or heterotrophy [16]. Like microalgae, nitrifiers can use inorganic carbon [17] or organic carbon [18, 19] for growth through the nitrification processes leading to the conversion of ammonia to nitrate. On the other hand, heterotrophic bacteria utilize the available organic carbon in the wastewater to directly convert the ammonia and other nutrients into biomass and generate CO2 as the end product. Although microalgae and bacteria constantly interact in aquaculture, managing the water quality through biological approaches takes advantage of the differences in substrate utilization of these processes.
A carbon to nitrogen (C/N) ratio of more than 10 enhances the heterotrophic processes, which is the dominant process in the biofloc system. Meanwhile, the C/N ratio of 6 and 7 encourage microalgal growth [20, 21], which is the dominant process of microalgae-based aquaculture systems. Nitrification occurs at a high rate when the C/N ratio is 2 and decreases as the ratio increases [22, 23]. Mielcarek et al. [24] reported higher nitrification at a C/N ratio of 0.5 and decreased with an increase in the ratio. Thus, the extent of C/N ratio concentration in the system can determine the contribution of nitrification in either biofloc or microalgae-based systems.
Meanwhile, heterotrophic and nitrification processes consumed alkalinity and reduced the pH of culture water [10]. Nevertheless, microalgae increase the pH under light during photosynthesis by uptaking nutrients and CO2 and lowering the pH during respiration at dark [25]. Stoichiometrically for every 1 g of ammonia- or nitrate- nitrogen consumed to produce 15.85 g of algal biomass, about 18.07 or 24.4 g of CO2 is consumed to generate the corresponding oxygen (O2) of 15.14 or 19.71 g [21]. Thus, the consumption of CO2 elevates the pH of the culture [20, 26]. The population of bacteria is negatively affected in the microalgae-bacteria consortium at high pH [27]. The nitrification process is pH sensitive, requiring it to be 7.5 – 9 [27]. Similarly, high bacterial growth leads to excessive CO2 supply that causes pH to drop to acidic regions leading to algal cell lysis [26]. Although microalgae can thrive in the pH range of 4.4 – 7.9 [28], microalgae are stressed under extreme pH. Jiang et al. [29] indicate a pH of 7.5 – 8.5 to be conducive to microalgal growth. pH change inhibits the growth of microbial populations or even extinction in extreme conditions [30].
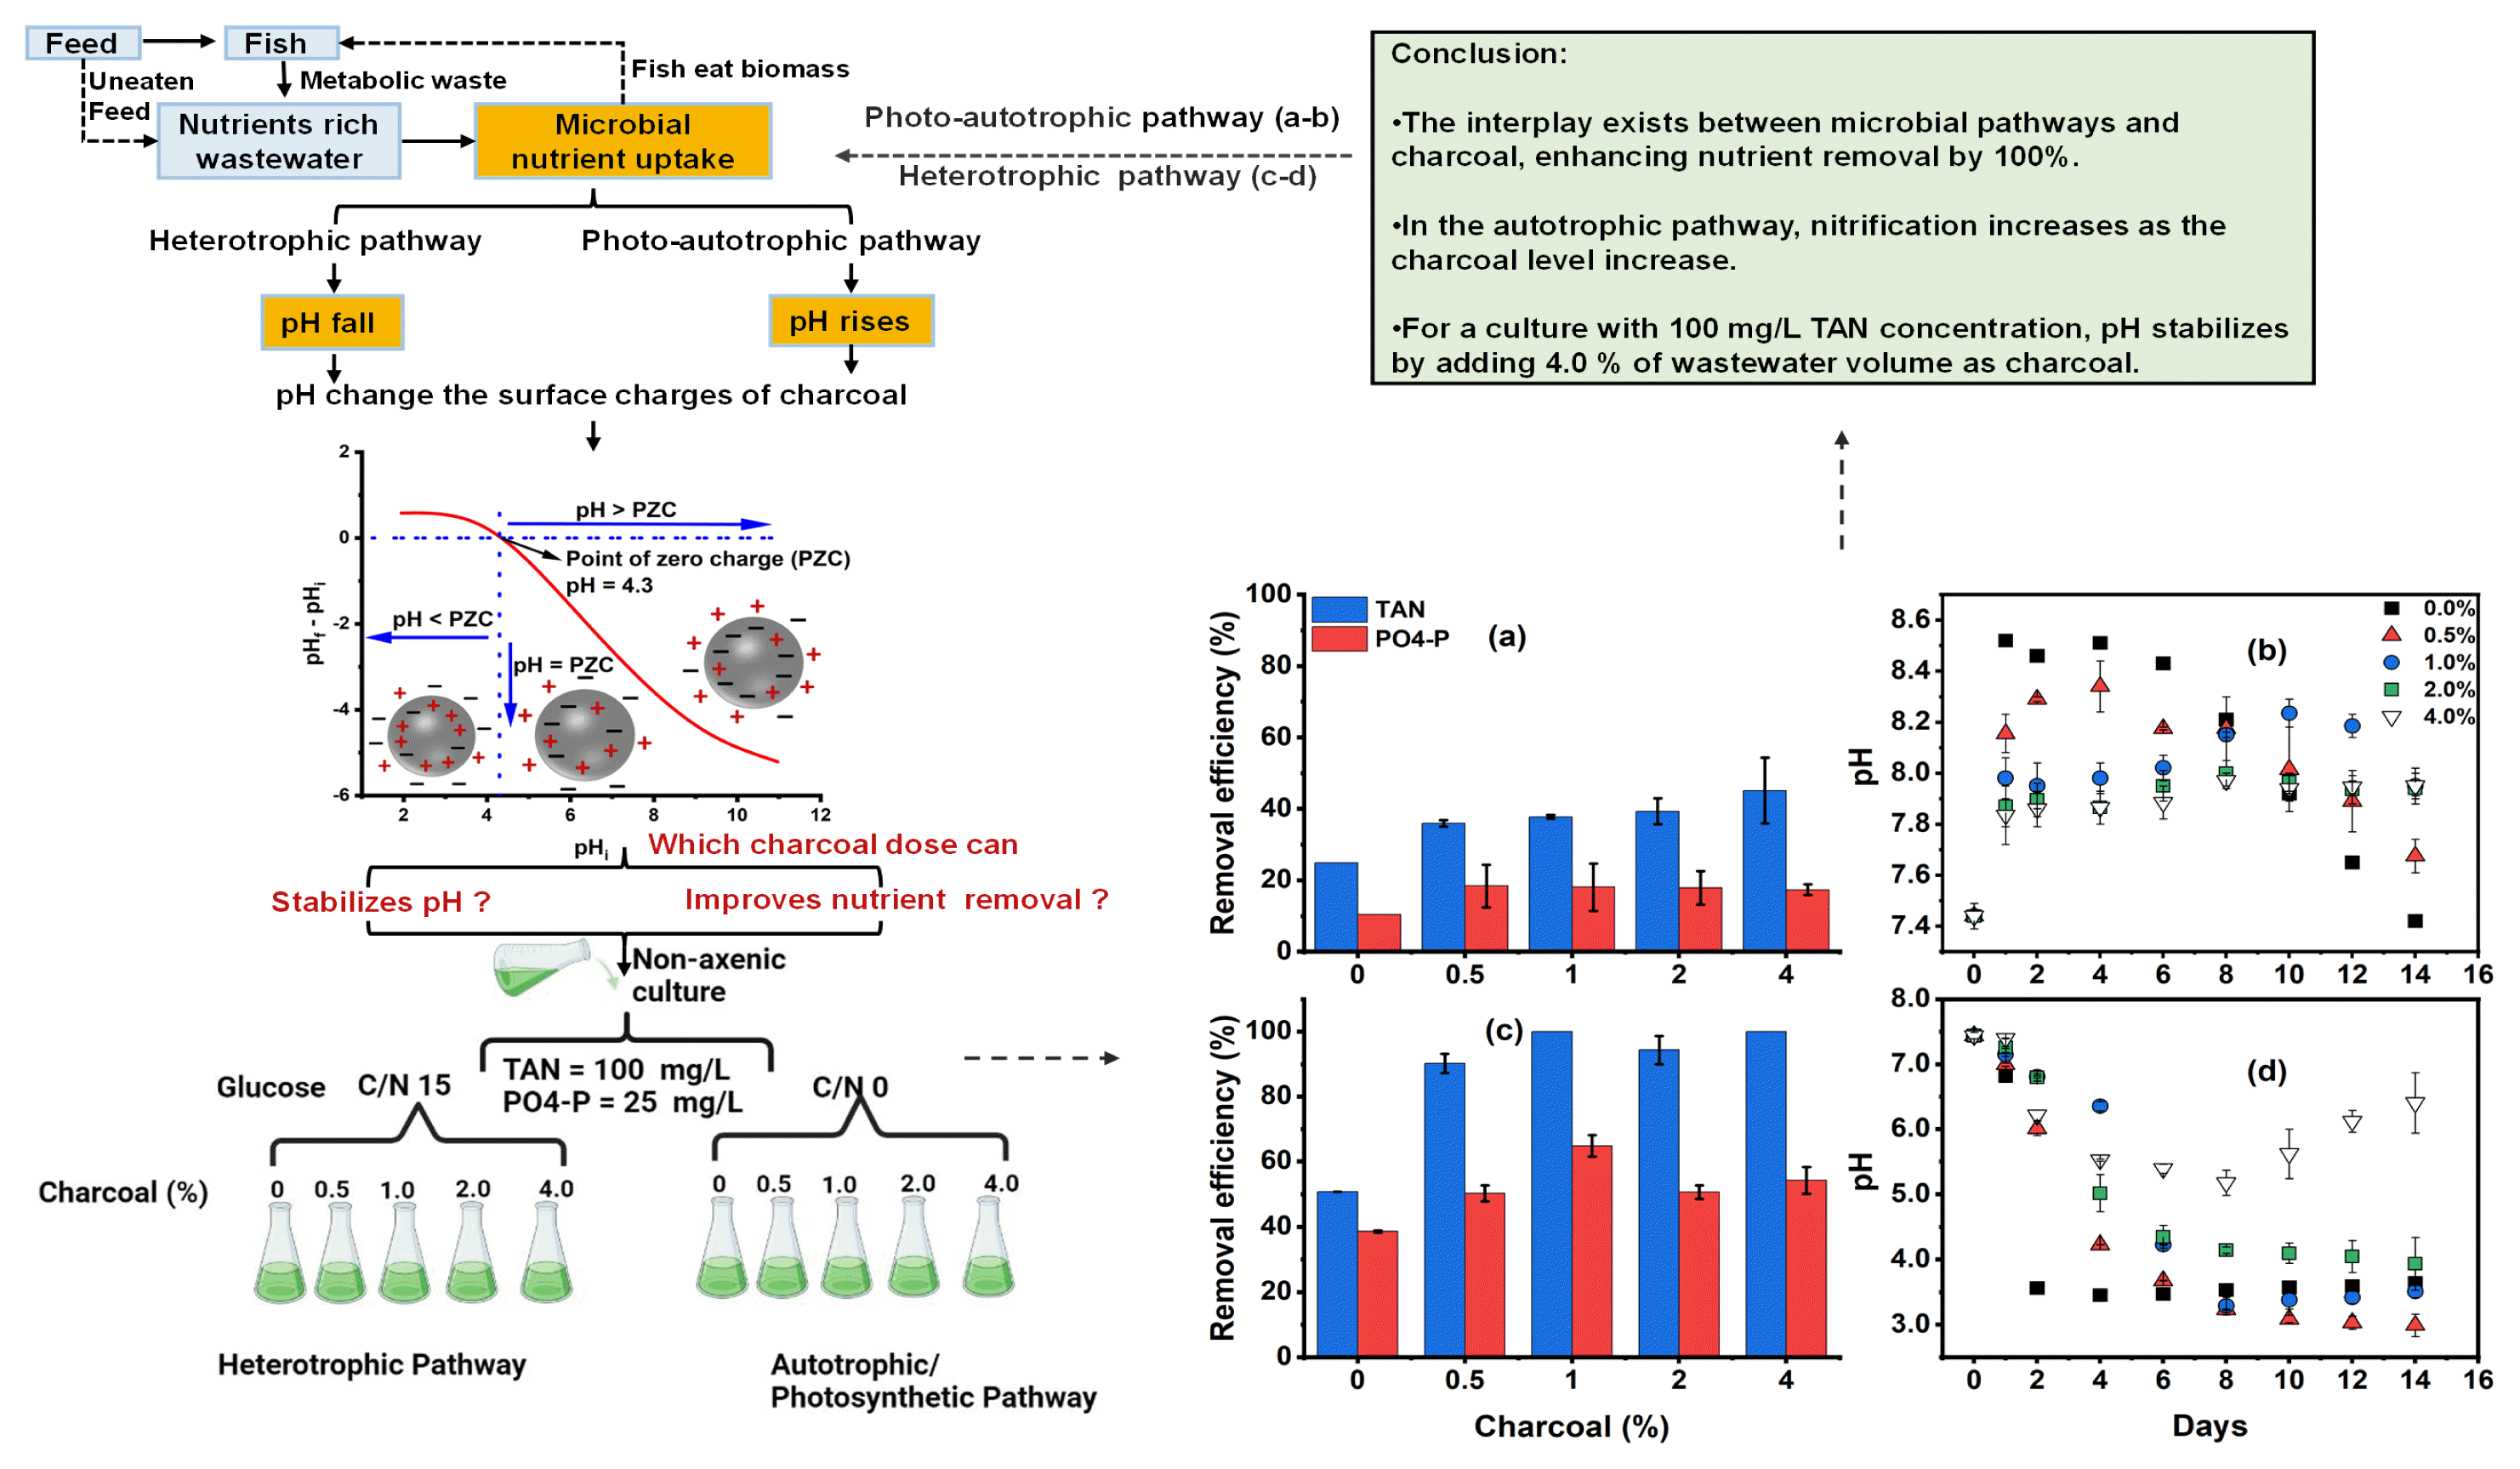
pH affects not only the microbial nutrient cycle but also fishes. According to Barnharst et al. [3] shrimp system requires a pH of 7.5 – 9.0, while 6.0 – 9.0 is appropriate for tilapia to grow. Therefore, pH above or below the optimum requirement of a cultured organism is detrimental to survival. Furthermore, pH affects the imbalances in the ammonia forms, which means pH regulation indirectly compels aquaculture wastewater to sustain life [31]. Thus, the water has to be discharged or supplemented the culture with a pH stabilizer. In aquaculture, chemicals like sodium bicarbonate (NaHCO3), calcium carbonate (CaCO3), and calcium hydroxide (Ca(OH)2) are employed to adjust alkalinity and stabilize pH in a system that is prone to pH decrease, like biofloc [32]. The acids, salts, or carbon dioxide injection has been the practice to bring down the pH for a system prone to pH rise. However, using a chemical is too dangerous and increases the running cost, while discharging the water may cause acidification and destabilize the flora and fauna of the receiving water body. Therefore, using a safe pH stabilizer is necessary for sustainable aquaculture.
Recently, adsorption studies using carbonaceous material such as biochar as an adsorbent have gained attention in pollutant removal. The functional groups on biochar serve as the site for nutrient exchange [33]. Functional groups depending on the heteroatoms bonded to the carbon surface can conventionally be classified into oxygen-containing functional groups (e.g., −OH, −COOH, -C=O and -C-O), nitrogen-containing functional groups (e.g., −NH2, −NH, -C=N and -C-N), and sulfur-containing functional groups (e.g., C-S, C=S, or S=O), etc. [34]. Biochar produced at low temperatures is less porous, characterized by oxygen-containing functional groups and high dissolved organic carbon; hence these types of biochar are more suitable for removing inorganic pollutants [35]. The capacity of biochar to sorb anion and cation (NO3− or NH4+-N) is reported to be the function of physical (high surface area and porosity) and chemical (negatively and positively charged functional groups) [36]. The cation exchange capacity of biochar depends on the nature and distribution of oxygen-containing functional groups on the biochar surface [37]. pH influences the complexation behavior of the functional group and surface charge of the adsorbent [34]. Change in the pH of the solution causes protonation and deprotonation reactions of the oxygenated functional groups of biochar. As the pH decreases, the positive charge surface of the biochar increases through protonation, whereas increasing the solution pH results in increasing the negative surface charge of the biochar. This reaction increases the electrostatic attraction between biochar and ions of the solution. The anions will be attracted to the positively charged surface while cations to the negatively charged surface of biochar [38]. Furthermore, carbonaceous material's porosity and biocompatibility can serve as a matrix for the growth of microorganisms to enhance their biodegradation capability to nutrients [39, 40]. A recent review by Li et al. [41] indicated that in addition to adsorption and porosity, which provide good habitat to microorganisms, electrostatic interaction could occur between the negatively charged surface of microorganisms and the positive charge surface biochar.
Thus, considering the pH variation from microbial growth in aquaculture, where heterotrophic and nitrification can decrease pH to add more hydrogen ions (H+ ions) or microalgae that elevate pH to add more hydroxide ions (OH− ions), the addition of biochar can adsorb either of the H+ or OH− ions to influence the pH of the medium and can positively or negatively charge the surface of biochar through reaction with functional groups. Thus, nutrient (NH4+, NO2−, NO3−, and PO43−) adsorption can be improved depending on the surface charge. Further, biochar can serve as a substrate to promote the growth of organisms and enhance nutrient removal. Although several studies use biochar for adsorption studies [33, 38], to our knowledge, there is little or no available information on the use of charcoal and the use of pH differences by microbial pathways to influence the properties of carbonaceous material toward pH stabilization and nutrient removal. Here we consider using charcoal produced in a similar procedure to the charcoal obtained after cooking with firewood, as it can be cheap and easy to obtain. However, the properties could vary with biochar. For this purpose, charcoal was first characterized to understand its physical and chemical properties. The nutrient adsorption capacity of charcoal without microbial inoculation was also conducted to quantify the nutrient removal or adoption by charcoal. Later, a batch culture experiment on two synthetic wastewater was conducted using non-axenic culture. Glucose at 15 C/N was added to one wastewater to favor the heterotrophic pathway. The other was deprived of organic carbon in favor of the autotrophic pathway. Powdered charcoal (w / v) was added to each pathway at 0.75, 1.5, 3.0, and 6 g corresponding to 0.5, 1.0, 2.0, and 4.0 % mass of charcoal in the media volume, and compared to the 0 % group without charcoal to understand the dose that best stabilizes pH and improves nutrient removal. Our study could aid in using charcoal to address the variation in pH posed by the microbial imbalance and improve nutrient removal in aquaculture.
2. Materials and Methods
2.1. Experimental Design
2.1.1. Preparation of synthetic wastewater
According to the previous study [42], two synthetic aquaculture wastewaters of 100 mg/L TAN concentrations were prepared with slight modifications to test the nutrient removal pathways and pH stability. The wastewaters are composed of (mg/L): 381.9 NH4Cl, 112 KH2PO4, 100 MgSO4.7H2O, 160 NaHCO3, 8.0 CaCl2, 3.43 KNO3, 0.563 NaNO2, and 1 ml hunter's trace element solution, a medium additive providing essential trace element for the growth of algae and certain microorganism. A 3750 mg/L of Glucose (C6H12O6) equivalent to 15 C/N was added to organisms in one wastewater to favor the heterotrophic pathway. The other wastewater was deprived of organic carbon to favor the photosynthetic pathway. The characteristics of the wastewater are presented in Table 1. High concentration was considered to represent the near-peak level of the reported nutrient compiled by Barharst et al. [3] and Nie et al [4]. This will allow us to understand the maximum nutrient the system can remove.
2.1.2. Wood charcoal production
In the present study, wood from pine trees was used as raw material source. The charcoal was produced traditionally by arranging the wood in a kiln, set on fire, and allowed to burn for around 2 hours and 30 mins. Thus, the airflow occurs naturally defending on the air in the environment. The obtained charcoal was brought to the laboratory and washed three times with ultrapure water, removing the ashes and impurities. The charcoal was then allowed to dry at room temperature for 3 days and then placed in an oven at 45 °C, drying further for another three days. The dried charcoal was ground in a mortar and sieved through 300 μm mesh, thereby collecting the powdered charcoal.
2.1.3. Characterization of the charcoal
2.1.3.1. Morphology of charcoal
The powdered charcoal was analyzed for its elemental composition, surface morphology, porosity, pore volume, pore size distribution, and surface charge distribution. Charcoal was coated with gold-palladium in an ion sputter (Hitachi Model E-1010) to enhance the image quality and observed surface morphology by Field Emission Scanning Electron Microscopes (FE-SEM; ZEISS Sigma 500). The SEM image was further processed for energy-dispersive X-rays spectroscopy (EDS) and revealed the elemental composition in the charcoal (Fig. S1). Micromeritics ASAP 2460 Version 3.01 was used for Brunauer-Emmett-Teller (BET) surface area analysis and Barrett-Joyner-Halenda (BJH) pore size and volume analysis.
2.1.3.2. Surface charge of charcoal
The point at which the surface charges are equal, also called the point of zero charges (PZC), was obtained, according to Paul et. al [43], with detailed procedures indicated in Fig. S2. In brief, 50 ml of 0.1 M NaCl was added to 5 caped glass containers. The solution's initial pH (pHi) was adjusted to pH of 2, 4, 6. 8, and 10 using 0.1 M HCl or 0.1 M NaOH. Following the pH adjustment, 0.05 g powdered charcoal was added to the solutions, and the caped containers were shaken at 150 rpm for 24 hours at 24 ± 1 °C. Subsequently, the solutions were filtered, and the final pH (pHf) was measured using a pH meter (Mettler Toledo FE20K). The point of zero charges was determined by plotting the difference between initial and final pH (pHf - pHi) against pHi. The point at which the curve intersects between pHf - pHi and pHi is considered the point of zero charges (Fig. S3).
2.1.4. Organism isolation and identification
2.1.4.1. Sample collection
The surface water sample was collected from the Qizhen pond/lake at Zhejiang University, Ocean College, Zhoushan, and transported to the laboratory in a sterilized one-liter bottle. Microalgae were isolated from water samples by plate streaking method [44]. In brief, a loop containing a small amount of water sample was streaked across the solid surface of the prepared triacetate phosphate media (TAP media) agar. After streaking, the plate was incubated in an incubator (LRH-250-g Light Incubator, Guangdong, China) at 26 ± 1°C under white fluorescent light for 5 d. A single colony grown from the solid surface was taken using a micropipette, transferred to the liquid TAP media, and incubated for 7 d. The isolate was later grown on the solid nutrient agar to confirm the association of bacteria. The stock organisms were maintained in liquid triacetate phosphate media (TAP) at 26 ± 1°C under continuous white fluorescent light illumination.
2.1.4.2. DNA extraction, PCR amplification, and Illumina MiSeq sequencing
The non-axenic culture of stock organisms was collected and centrifuged in a sterilized 10 ml tube at 5000 rpm for 10 min. The resultant supernatant was discarded, while the biomass pellet was stored at − 20°C until the sample was used for DNA and PCR amplification. The sample was transported to the Majorbio Bio-pharm Technology Co., Ltd., Shanghai, China, where DNA extraction, PCR amplification, and sequencing analysis were conducted. The total genomic DNA was extracted from the sample in duplicate using the FastDNA ® Spin Kit for soil (MP Biomedicals, USA) following the manufacturer's method. The V3–V4 hypervariable regions of the prokaryotic bacteria 16s ribosomal RNA genes sequencing were amplified by PCR system in the Illumina Miseq sequencing platform using the universal primers 338F (5’-ACTCCTACGGGAGGCAGCAG-3') and 806R (5’-GGACTAC HVGGGTWTCTAAT-3') [45]. Meanwhile, regions of the eukaryotes I8s ribosomal RNA genes sequencing were amplified using primers 3DNF (5’-GGCAAGTCTGGTGCCAG-3') and V4EUKR2R (5’-ACG GTATCTRATCRTCTTTCG-3') [46].
As described in the previous study [45], the PCR amplification consists of 1 cycle of initial denaturation at 95 °C for 3 min, followed by denaturing for 30 cycles, each at 95 °C for 30 s, annealing at 50 °C for 30 s, extension at 72 °C for 45 s, and finally ceased the extension step at 72 °C for 10 min. The PCR amplification was performed with ABI GeneAmpR 9700 using a 20 μl reaction system consisting of 4 μl 5 × FastPfu buffer, 2 μl 2.5 mM dNTPs, 0.8 μl 5 μM primers (each of forward and reverse), 0.4 μl FastPfu polymerase, 0.2 μl BSA (bovine serum albumin) and 10 ng DNA template. The normalized sequences of 16s and 18s were quantified and classified using Quantitative Insights into Microbial Ecology (QIIME 1.9.1) software. A 97% identity threshold was used to cluster the reads into operational taxonomic units (OTUs). The database and programs used for microbial analysis of the sequencing data were presented in the supplementary material (Table S1 and Table S2).
2.1.5. Experimental setup
The experiment was conducted in a 250 ml Erlenmeyer flask containing 150 ml of synthetic wastewater in three replicates. The media with initial pH of 7.39 (Table 1) were inoculated under a laminar flow (SW-CJ-IF, Suzhou, China) with a non-axenic culture at the initial microalgal densities of 5 x 10⁶ cell/ml counted using a 0.1 mm deep Neubauer improved hemocytometer observed under a microscope (40× objective). Powdered charcoal at 0.75, 1.5, 3.0, and 6 g was added to the media volume corresponding to 0.5, 1.0, 2.0, and 4.0 % mass of charcoal in the media volume (% mean w/v ratio) compared to the reference point without adding charcoal (0 %). The organisms were incubated in an incubator (LRH-250-g Light Incubator, Guangdong, China) at 26 ± 1°C under continuous illumination of white light from fluorescent tube bulbs with a cycle of 24:0 h (light: dark) for 10 days and compared the nutrient removal and pH change at different levels of charcoal of each pathway. Meanwhile, the experiment was conducted without microbial inoculation but maintaining the above % ratio of charcoal to quantify the nutrient removal or adsorption by charcoal.
2.2. Analytical Methods
2.2.1. Water quality analysis
Aliquots of samples from the culture media were withdrawn at regular intervals for nutrient analysis. The 5 ml samples were centrifuged using a centrifuge machine (Anke TGL-205R) at 5000 rpm for 10 minutes, followed by the filtration of the supernatant with a 0.22 um syringe filter. The concentrations of total ammonia nitrogen (TAN), nitrate (NO3−), nitrite (NO2−), and phosphate (PO4-P) were spectrophotometrically measured using UV/Vis spectrophotometer (TU-1810DS, Beijing, China) following the standard methods corresponding to 4500-NH3 F: Phenate method, 4500-NO2 − B Colorimetric method, 4500-NO3 − B: Ultraviolet spectrophotometric screening method, and 4500-P E: Ascorbic acid method of the American Public Health Association [47]. The pH meter (Mettler Toledo FE20K) was used to measure the pH. The amount of adsorbed nutrient per unit mass of charcoal at equilibrium qe (mg/g), nutrient removal R (mg/L), and nutrient removal efficiency Re (%), were obtained using Eq. (1), (2), and (3), respectively:
where V = volume of solution, W = mass of the corresponding charcoal, Ci = initial concentration of nutrients (TAN/ NO3− / NO2− / PO4-P) at t = 0, Ce = the concentration at equilibrium beyond which there is no significant change in the removal, and Cf = final concentration at a time of a day at which the concentration is either completely removed or reached the maximum beyond which there is no significant change in the removal.
2.2.2. Statistical analysis
The differences in nutrient removal efficiency at different charcoal densities of each pathway were analyzed in SigmaStat3.5 using a one-way analysis of variance (ANOVA). Fisher LSD posthoc test was used to rank the groups based on the differences in the mean value. The data was visualized graphically in Origin software 2021 (©Origin Lab Corporation, United States of America).
3. Results and Discussion
3.1. Characterization of Charcoal
The charcoal's surface morphology and elemental composition are shown in Table 2. The Energy-dispersive X-ray spectroscopy (EDS) result shows that charcoal composes of 78.6 % carbon and 21.4 % oxygen. Paul et al. [43] found the elemental composition of biochar obtained by carbonizing Pine nuggets without any modification at a temperature of 350 °C for a period of 2.5 – 3 h to contain 79.8 % carbon and 20 % oxygen, nearly similar to our result. Upon conducting FTIR spectra analysis, their result revealed considerable spectral band absorbance at 1030, 1200, 1600, 1700, 2360, and 3600 cm−1, a distinctive feature of C=C, C=O, and C-O bonds. Yaashikaa et al. [35] reported that biochar produced at low temperatures are more suitable for removing inorganic pollutant because they possess oxygen-containing functional groups, highly dissolved organic carbon, and is less porous. The cation exchange capacity of biochar depends on the nature and distribution of oxygen-containing functional groups on the biochar surface [37]. The functional groups serve as the site for nutrient exchange [36]. Yang et al. [34], suggest adsorption mechanisms onto the adsorbent as physical adsorption, electrostatic interaction, ion exchange, surface complexation, and precipitation. The medium's ionic environment and the adsorbents' chemistry nature influence the interaction between functional groups and molecules of the medium [34]. pH is another important factor influencing the complexation behavior of the functional group and surface charge of the adsorbent. Table 2 presents the point of zero charges of charcoal to be around the pH of 4.3. Thus, the net surface charge is zero, and the surface cation and anion exchange capacity are equal at this pH point. Hence, exposure of charcoal in this study to a pH above 4.3 will make it negatively charged. Similarly, exposure to a solution with a pH lower than 4.3 will make the charcoal positively charged.
Similarly, Table 2 presents the charcoal's surface area, pore volume, and pore size distribution. Porosity and specific surface area provide a conducive environment for the attachment of bacterial communities [48]. Moreover, pore size distribution and surface area affect physical adsorption, with micropores exhibiting high adsorption [49]. Furthermore, carbonaceous material's porosity and biocompatibility can serve as a matrix for the growth of microorganisms to enhance their biodegradation capability to pollutants [39, 40]. Therefore, incorporating charcoal in the culture of microalgae-bacteria interaction can sustainably improve water quality.
3.2. The Microbial Composition
In the present study, the Chlorella sorokinia and associate bacteria spp, including cyanobacteria, were the identified eukaryote and prokaryotes, respectively (Fig. S4). The Chlorella sorokiniana is the eukaryotic microalgae, while cyanobacteria are the prokaryotic microalgae. Chlorella (Chlorophyta) and Cyanobacteria (Cyanophyta) have a high abundance in shrimp and finfish ponds. The variation in their abundance is affected by culture conditions [50, 51]. Meanwhile, the isolated bacterial communities contain ammonia-oxidizing bacteria (AOB) and nitrite-oxidizing bacteria (NOB), collectively called nitrifying bacteria. Some members of proteobacteria, such as Gammaproteobacteria, contain AOB and NOB. Furthermore, alphaproteobacteria have some NOB [52].
Interestingly, the bacteria communities containing genera like Hydrogenophaga, Rhodobacter, Flavobacterium, etc., were aerobic denitrifiers involved in denitrification processes [53]. Similarly, the dominant bacterial communities are heterotrophic bacteria and occur in our isolates. Therefore, our non-axenic culture contains organisms of the dominating microbial pathways involved in water quality control in aquaculture. The three microbial processes dominating water quality control in aquaculture systems include nitrification and photosynthesis (autotrophic) and heterotrophic bacterial re-growth [13]. The development of either of these processes can be stimulated by adding inorganic or organic carbon and regulating the C/N ratio.
3.3. Charcoal Adsorption
The nutrient removal by charcoal without adding microorganisms was studied to quantify the adsorption capacity of charcoal. The nutrient removal was fast within the first 1 d from where the removal was insignificant over time (Table S3). The fast removal could be due to the larger surface area of charcoal available for nutrient adsorption at the beginning [54]. The result shows that while a reduction in TAN concentration becomes high as the percentage of charcoal increases, the phosphate reduction was relatively insignificant among the charcoal. The nutrient removal at equilibrium conditions was around 13.8, 17.6, 26.2, and 34.1 mg/L for TAN, and 4.3, 4.2, 3.7, and 3.9 phosphates at 0.5, 1.0, 2.0, and 4.0% charcoal, respectively (Table S4). While the point of zero charges of the charcoal in this study was 4.3, the pH of the media throughout this condition was around 7.5 – 8.0, above the pH at PZC. Thus, the charcoal surface becomes negatively charged [43, 55]. This implies that the negatively charged surface can attract the available cations like NH4+ in the culture to improve the TAN removal. As the exchangeable sites become saturated, the adsorption decreases [54]. Thus, increasing charcoal percentages provide more exchangeable sites explaining the differences in the TAN removal. However, due to the effect of charcoal quantity, charcoal's adsorption capacity for TAN at equilibrium per unit mass of charcoal decreases from around 2.8 to 0.9 mg/g as the percentage of charcoal increased from 0.5 to 4.0% (Table S4).
Meanwhile, the low PO43− removal achieved irrespective of charcoal dose can be attributed to the simple adsorption. The negatively charged ions from pH presented a far high concentration of OH− ion that outcompetes adsorption of the PO43−, sharing the same binding sites on the charcoal, hence the observed low reduction. This can also be confirmed by the low reduction in NO3− and NO2− (Table S3). Gai et al [33] indicate that because of the negatively charged surface of biochar, NO3− fails to be adsorbed, while NH4+-N is adsorbed. Zhang et al. [56] reported that the negatively charged surface of unmodified biochar repels NO3− and PO43− anions, reducing their adsorption.
3.4. Response of Autotrophic Pathways to Charcoal Addition
3.4.1. The pH changes over time
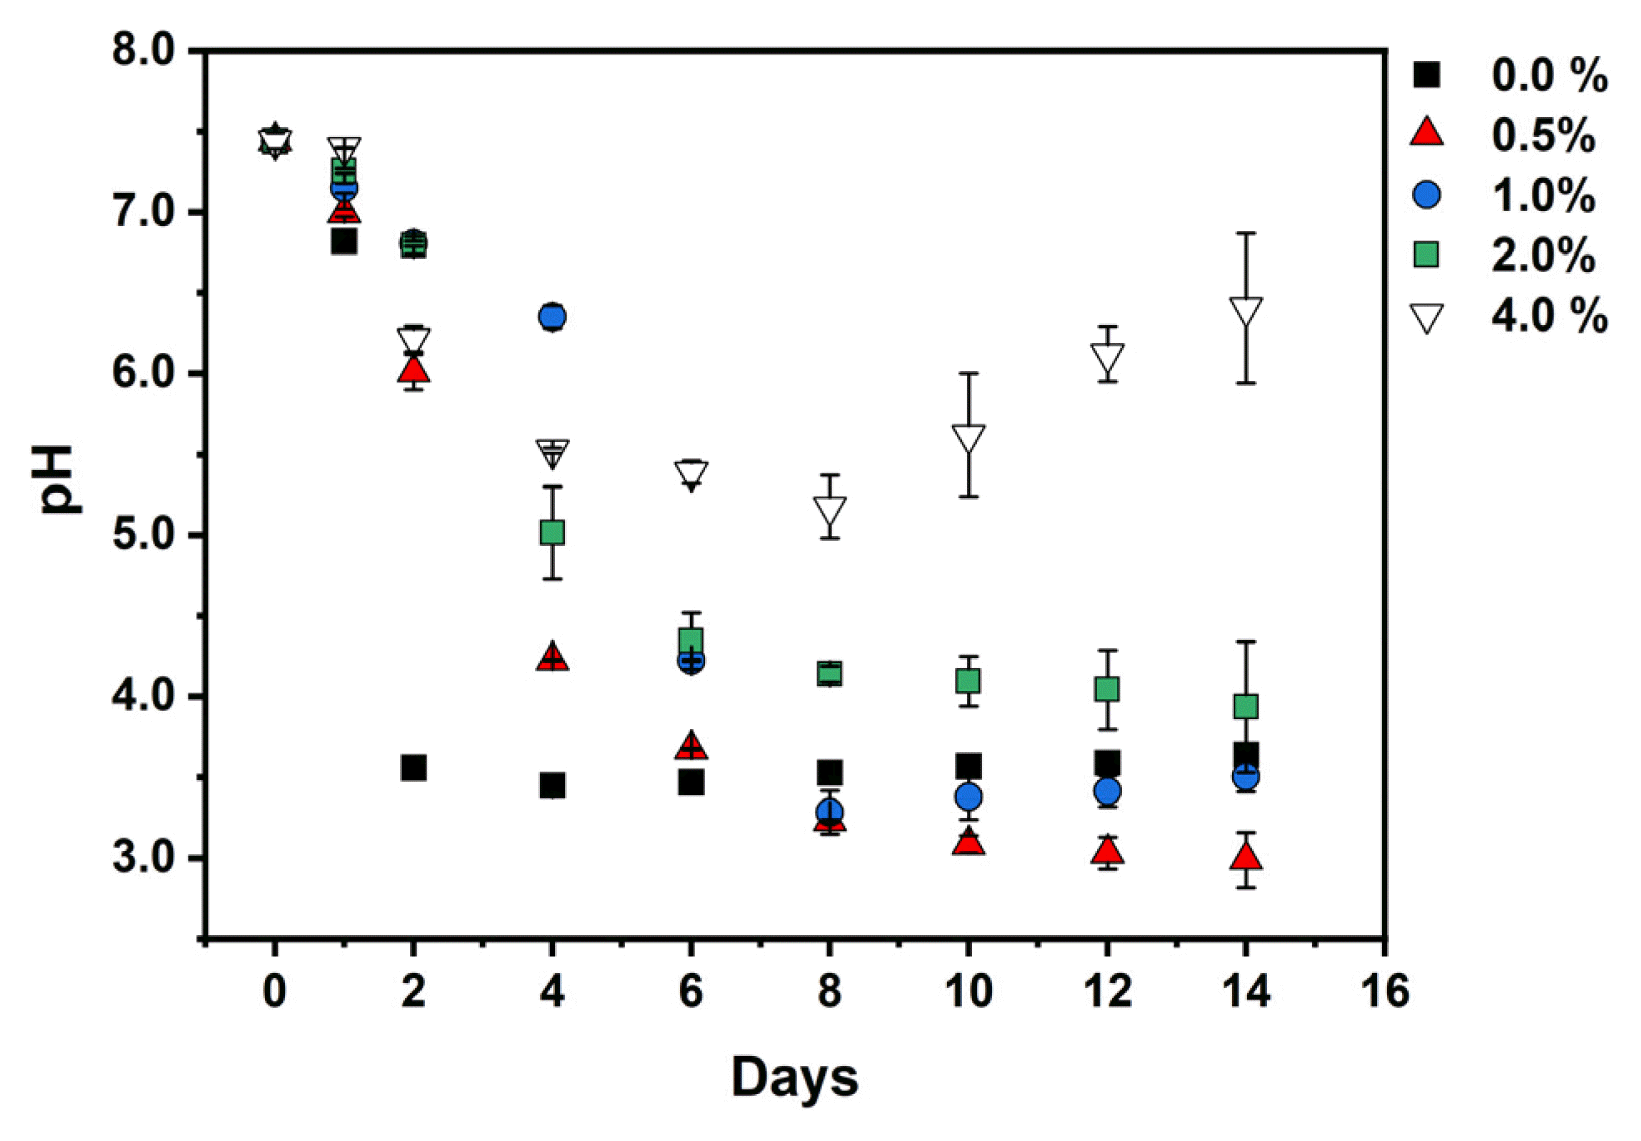
Fig. 1 shows how pH rises from the initial of 7.4 until it reaches the maximum pH of 8.5, 8.3, 8.2, 8.0, and 7.9 in the medium containing 0, 0.5, 1.0, 2.0, and 4.0 % charcoal, respectively. The bacteria and microalgae interact to support and grow together for nutrient uptake. However, the domination of nutrient uptake by bacteria or microalgae depends on the available resources [57]. Microalgae grow through inorganic carbon fixation during photosynthesis, which leaves hydroxyl ions in the cell. The cell neutralizes the hydroxyl ion by taking hydrogen ions from the culture medium resulting in an increased pH of the culture [58]. Thus, the observed pH rise indicates the growth of microalgae on the initial inorganic carbon. Although the pH increase, the rise in pH diminishes by increasing the charcoal percentage. Here microalgae can be considered to have grown low, preventing pH spikes as the dark nature and particulates of charcoal can prevent microalgae from accessing the light, especially at a high percentage of charcoal. The presence of particulate organic matter in wastewater is explained to have prevented microalgae from accessing full light utilization for photosynthesis [59]. Therefore, the lower the charcoal concentration, the higher the spike in pH due to microalgal growth, as observed in 0 – 1.0 % charcoal.
After the pH rise attained the maximum level, the pH dropped at 0, 0.5, and 1.0 % charcoal, but no further drop at 2.0 or 4.0 % was observed as the pH stabilized throughout the experiment, even by extending the experimental period from 10 to reach 14 d. The pH drop at 0% – 1.0% charcoal can be attributed to the gradual growth of bacteria by utilizing the extracellular organic carbon produced by microalgae, thereby generating the CO2 and other metabolites hence dropping in the pH [14]. Microalgae release oxygen via photosynthesis and secrete extracellular organic compounds such as protein, carbohydrates, lipids, amino acids, organic acids, etc. [60]. Bacteria may have later consumed organic matter as essential nutrients for maintaining survival, contributing to the pH drop [14]. Dissolved organic carbon induces the activity of bacteria [60, 61], and bacterial activity causes pH to drop due to CO2 production [42]. Further, bacterial activity through the nitrification process can release hydrogen ions (H+), reducing pH [62].
3.4.2. The performance of nutrient removal
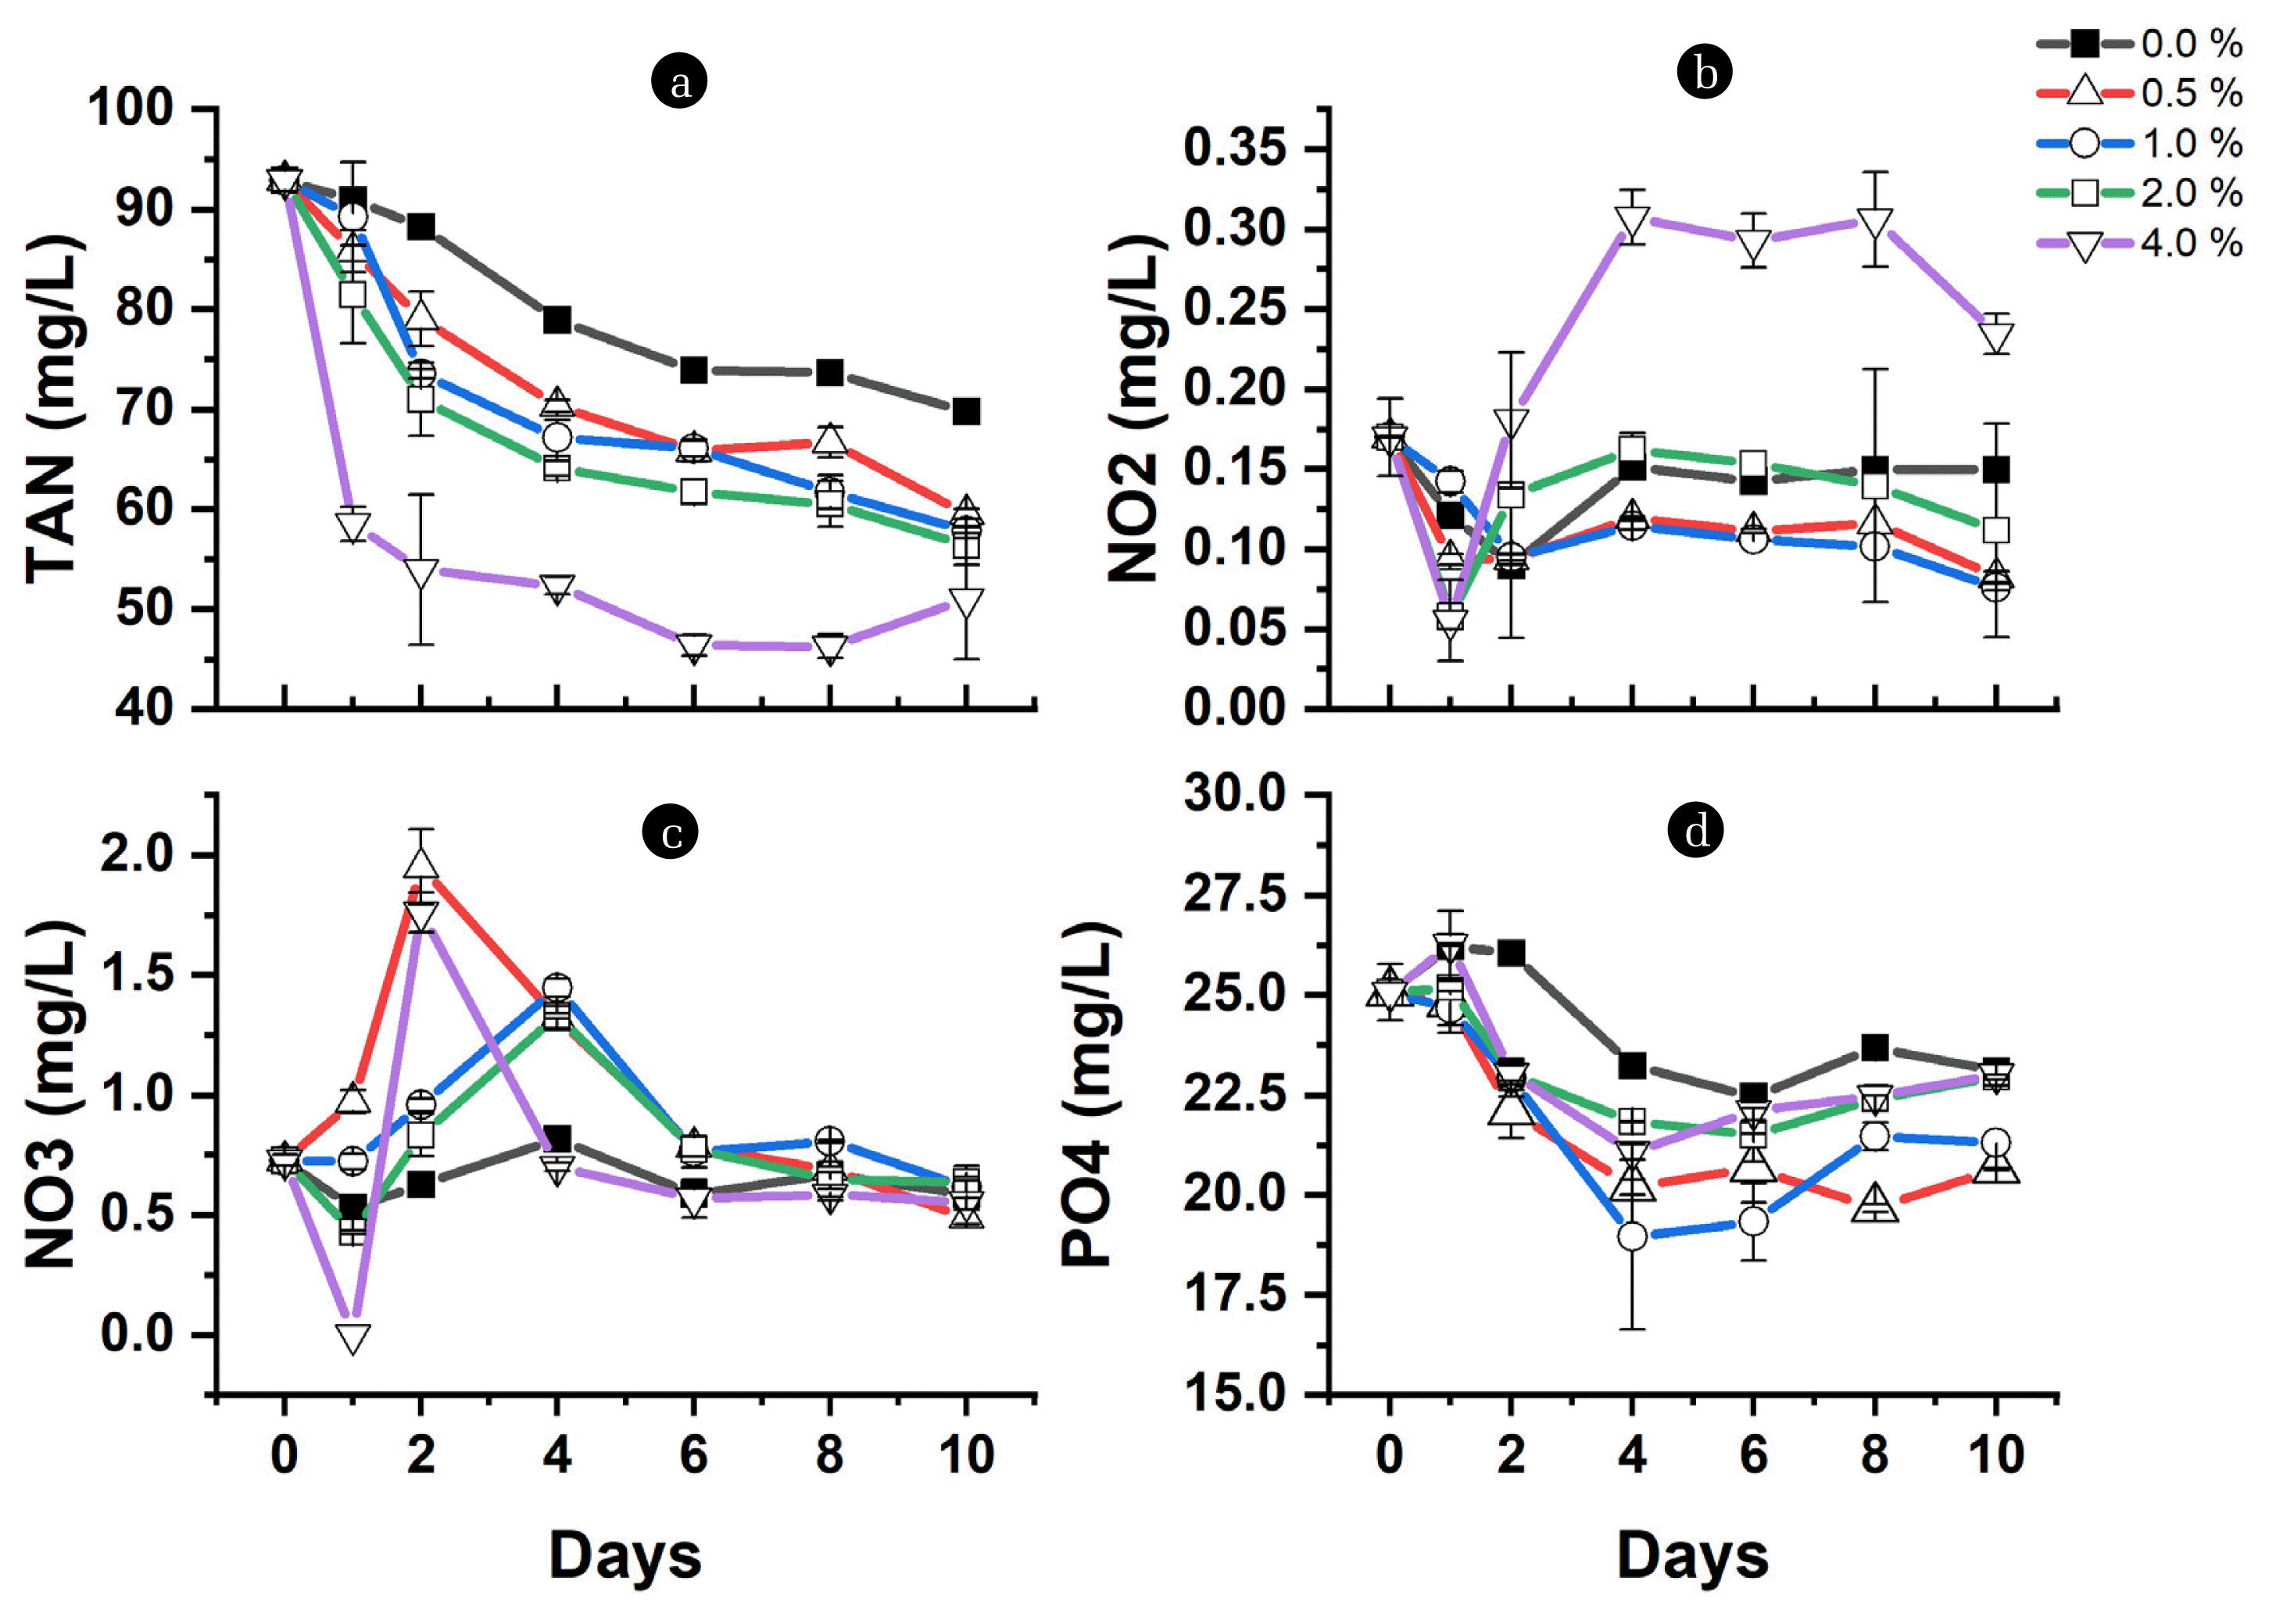
It can be observed that when pH attained the maximum level in a medium with 0% charcoal on day 6, the TAN and phosphate removal level reached 19 mg/L and 2.6 mg/L, respectively (Fig. 2a, d). In contrast, adding charcoal at 0.5 – 4.0 % enhances the nutrient removal to the rates of between 27 – 46 mg/L TAN and 3 – 5 mg/L phosphate on day 6, respectively. The low TAN and phosphate removal at 0 % indicate that microalgae growth majorly contributes to the nutrient uptake since no organic carbon is added to support the bacterial growth, especially heterotrophs [63], and the charcoal is absent for adsorption and bacterial attachment. The oscillation of nitrite and nitrate within the initial concentration confirms the domination of microalgae, as microalgae prefer TAN for minimizing the energy used during protein synthesis [64]. Also, the presence of light inhibits nitrification [62]. Thus, charcoal provides a conducive environment for nitrification, which also enhances the nutrient removal observed at 0.5 – 4.0 %. The development of this process is especially true considering nitrite and nitrate concentration are affected differently at 0.5 – 4.0 % charcoal. The charcoal's porosity and specific surface area provide a conducive environment for the bacteria [48]. Electron microscopy of biochar after culture with E. Coli bacteria revealed that bacteria could form biofilm on the surface of biochar [65].
As the charcoal level increases, the nitrite accumulation becomes high while nitrate concentration becomes low and vice versa (Fig. 2b, c). Culture with 0.5 – 2.0 % charcoal is characterized by reduced nitrite concentration and high nitrate accumulation, suggesting that the available oxygen produced by microalgae, in addition to the attachment surface provided by charcoal, favors nitrification to the extent of available oxygen concentration in the individual charcoal levels (Fig. 2b, c). According to Sepehri et al. [66], oxygen supply to nitrifying bacteria via photosynthesis by microalgae enhanced ammonia removal. Sufficient dissolved oxygen (DO) is essential for complete nitrification [67]. However, it is observed that at a 4.0 % charcoal level, the nitrate accumulation becomes low while the nitrite concentration over time rises high, which suggests low oxygen resulting in incomplete nitrification [68]. Ruiz et al [69] show that more than 65 % of ammonia nitrogen likely accumulated as nitrite under 0.7 mg/L DO and 6.50 – 8.95 pH. Similarly, a partly submerged rotating disc reactor set without aeration at pH 7 and 1.3 mg/L DO accumulate more than 75 % of ammonia as nitrite [70].
Consequently, nitrification contributes to TAN and phosphate removal. However, unlike TAN, where the removal increases with the percentage of charcoal, the high phosphate removal occurred at 0.5 – 1.0 % charcoal (Fig. 2d). The high removal of phosphate under 0.5 and 1.0 % could be attributed to the nitrification coupled with microalgae uptake. As previously mentioned, low particulates allow microalgae to access light [59], and the presence of particulates provide a surface for bacterial attachment. Although charcoal is anticipated to prevent microalgae from accessing full utilization of light, preventing pH spikes, the nitrification process is known to release hydrogen ions (H+), which also contributes to pH reduction [62]. The nitrification is high with increasing the percentage of charcoal, as indicated by pH decrease. According to Zhang et al. [67], the more the pH decrease, the more the nitrification. Thus, nitrification coupling with microalgae growth is expected to stabilize pH by decreasing the charcoal level (0.5 – 1.0 %). However, the pH becomes more stable as the charcoal level increase (2.0 – 4.0 %). The pH stability at 2.0 or 4.0 % suggests that ions' adsorption occurs on the charcoal surface.
Based on the Point of Zero Charge (PZC) result, Table 2 shows that charcoal in this study has a PZC at a pH of around 4.3. The initial pH of the culture in this study is above the pH at PZC. Moreover, the spike in pH by microalgae increases the OH− concentrations of the culture, making the charcoal have a negatively charged surface. The pH of the media above PZC makes the surface of particles become negatively charged [43, 55]. This implies that the available cations in the culture are attracted to the negatively charged surface. Therefore, the H+ generated during nitrification, and the ammonium ion (NH4+-N) is adsorbed to the surface of the charcoal. As the exchangeable sites become saturated, the adsorption decreases [54], explaining the differences in the TAN removal and pH stability at different levels of charcoal. However, by the end of the experiment, a comparable TAN removal efficiency was attained at 0.5 – 2.0 % charcoal, strengthening the extent of the microalgal and bacterial establishment at different levels of charcoal over time. At the end of the 10 d, 25, 36, 38, 39, and 50 mg/L of TAN were removed, corresponding to the efficiency of 26 %, 38%, 40%, 41%, and 53% at charcoal levels of 0, 0.5, 1.0, 2.0, and 4.0 %, respectively (Fig. 3). Meanwhile, the negatively charged ions from pH spike by microalgal growth presented a far high concentration of OH− ion that outcompetes adsorption of the NO3−, NO2−, and PO43− sharing the same binding sites on the charcoal. Gai et al. [33] indicate that because of the negatively charged surface of biochar, NO3− fails to be adsorbed, while NH4+-N is adsorbed. Zhang et al. [56] reported that the negatively charged surface of unmodified biochar repels NO3− and PO43− anions, reducing their adsorption. Thus, PO43− is largely removed by photosynthesis and nitrification processes. The PO43− level rises toward the end of the study, which can be attributed to the death of microbial cells that causes the rupturing of the cell, thereby releasing the intercellular phosphate into the medium [71].
Given the above, it can be deduced that the contribution of nutrient removal by adsorption and nitrification increase as the charcoal level increase but the contribution from microalgal uptake decreases. This is especially true comparing the nutrient removal efficiency in the autotrophic path (Fig. 3) and the adsorption of charcoal at equilibrium, as indicated in Table S4. Nevertheless, the ability of charcoal and microalgae-bacteria interaction in autotrophic conditions to enhance nutrient removal by 100 % and maintain safe pH indicates considerable potential for aquaculture wastewater treatment. For example, by removing around 25 to 50 mg/L of TAN in this study, depending on the charcoal dose, the effect of some nutrient levels under certain aquaculture conditions is solved. Similarly, pH is maintained in an optimum condition, sufficient for fish survival under this condition. According to Barnharst et al. [3], the shrimp system requires a pH of 7.5 – 9.0, while 6.0 – 9.0 is appropriate for tilapia to grow. Furthermore, the known challenges of low nutrient removal rate and increase of pH associated with microalgae-based culture systems [72] are solved through this study.
Although other studies show improved nutrient removal and pH stability by charcoal in the constructed wetland for water reuse in aquaculture [73], the present study shows the highest nutrient removal. Part of the reason could be that our study uses microalgae-bacteria and charcoal conditions instead of macrophytes and charcoal used in their research. However, despite the high nutrient removal achieved in our study, some effort is needed to remove more nutrients beyond for example the 50 mg/L TAN that is removed under autotrophic conditions, as some aquaculture conditions are shown to have TAN of more than 50 mg/L TAN [3, 4]. Thus, in the next experiment, we add organic carbon (glucose) at C/N 15 to favor the heterotrophic path in the presence of charcoal.
3 .5. Response of Heterotrophic Pathway to Charcoal Addition
3.5.1. The pH changes over time
Unlike High Rate Algal Ponds (HRAPs) or microalgae-based systems, where microalgae dominate, in biofloc, the development of heterotrophic pathways is stimulated by adding carbohydrates as organic carbon sources to dominate the water quality control. The microbial metabolism to carbohydrate sources affects microbial growth, resulting in bacteria or microalgae proliferation differences. As a simple carbohydrate and highly reduced molecule, glucose is the preferred organic carbon source for many organisms like bacteria [74] and microalgae [75]. And the more reduced the compound is, the more energy can be obtained from its oxidation, and the more proliferation can be achieved, resulting in a pH drop [74]. However, the rate of heterotrophic microbial production occurs at 10 h generation times than either photosynthesis or nitrification with 24 h or 48 h [13]. Mainly C/N ratio above 10 enhances heterotrophic bacterial growth [20, 21]. Regulating the C/N ratio of the feed to 15 in biofloc is shown to improve water quality, enhance shrimp's growth, and change the microbial diversity with bacteria dominating the community [76]. Bakar et al. [77] show that the highest ammonia removal efficiency, and biofloc formation, was achieved at a C/N of 15 in a culture of Clarias gariepinus. C/N 15 enhances nutrient removal and water quality in the biofloc culture of tilapia fish (Oreochromis niloticus) and red claw crayfish (Cherax quadricarinatus) [78]. Despite the benefit, the proliferation of heterotrophic microbial communities in a limited water exchange system generates high CO2 [42] and other metabolites, which reduce the pH.
Thus, the sudden pH drop observed in Fig. 4 in the culture with 0 % charcoal from the initial value of 7.4 to 3.5 in 2 d indicates the domination of the heterotrophic microbial community. Bacterial growth overcrowds algal cells and limits light and, thus, insufficient oxygen production due to low microalgal growth [79, 80]. Similarly, the pH requirement for microalgae lies between pH 6 – 8. Any value below 4 or above 9 is an extreme condition for microalgae [4]. Thus, excessive CO2 supply due to bacterial growth will cause pH to drop to acidic regions leading to algal cell lysis [26]. pH affects not only microorganisms but the survival of the fish, as tilapia and shrimp require the corresponding pH of 6.0 – 9.0 and 7.5 – 9.0 [3], and most aquatic organisms need around 5.5 [81].
Interestingly, adding charcoal prevents the sudden drop, and the pH stabilizes by increasing the charcoal percentage. It takes 6 and 8 days for 0.5 and 1.0 % before the pH drops to 3.5, respectively. The pH value falls in 8 days to afterward stabilize at 4.14 in 2.0 % and 5.2 – 6.5 when 4.0 % of the charcoal is added. It is important to note that even when the condition was extended from 10 to 14 d, the pH remained stable within the optimum condition at 4.0% charcoal. The prevention of sudden drop and pH stability can be attributed to the adsorption of H+ ion concentration produced at low pH onto the charcoal surface through a protonation reaction which can also help to increase the electrostatic attraction between the charcoal surface and the negatively charged ions, such as nitrate [38]. H+ ions can be adsorbed to the adsorbent surface to outcompete other cations, such as Pb(II) ions sharing the same binding site [82]. Furthermore, biochar is reported to increase the pH and reduce water and soil acidity [81, 83].
3.5.2. The performance of nutrient removal
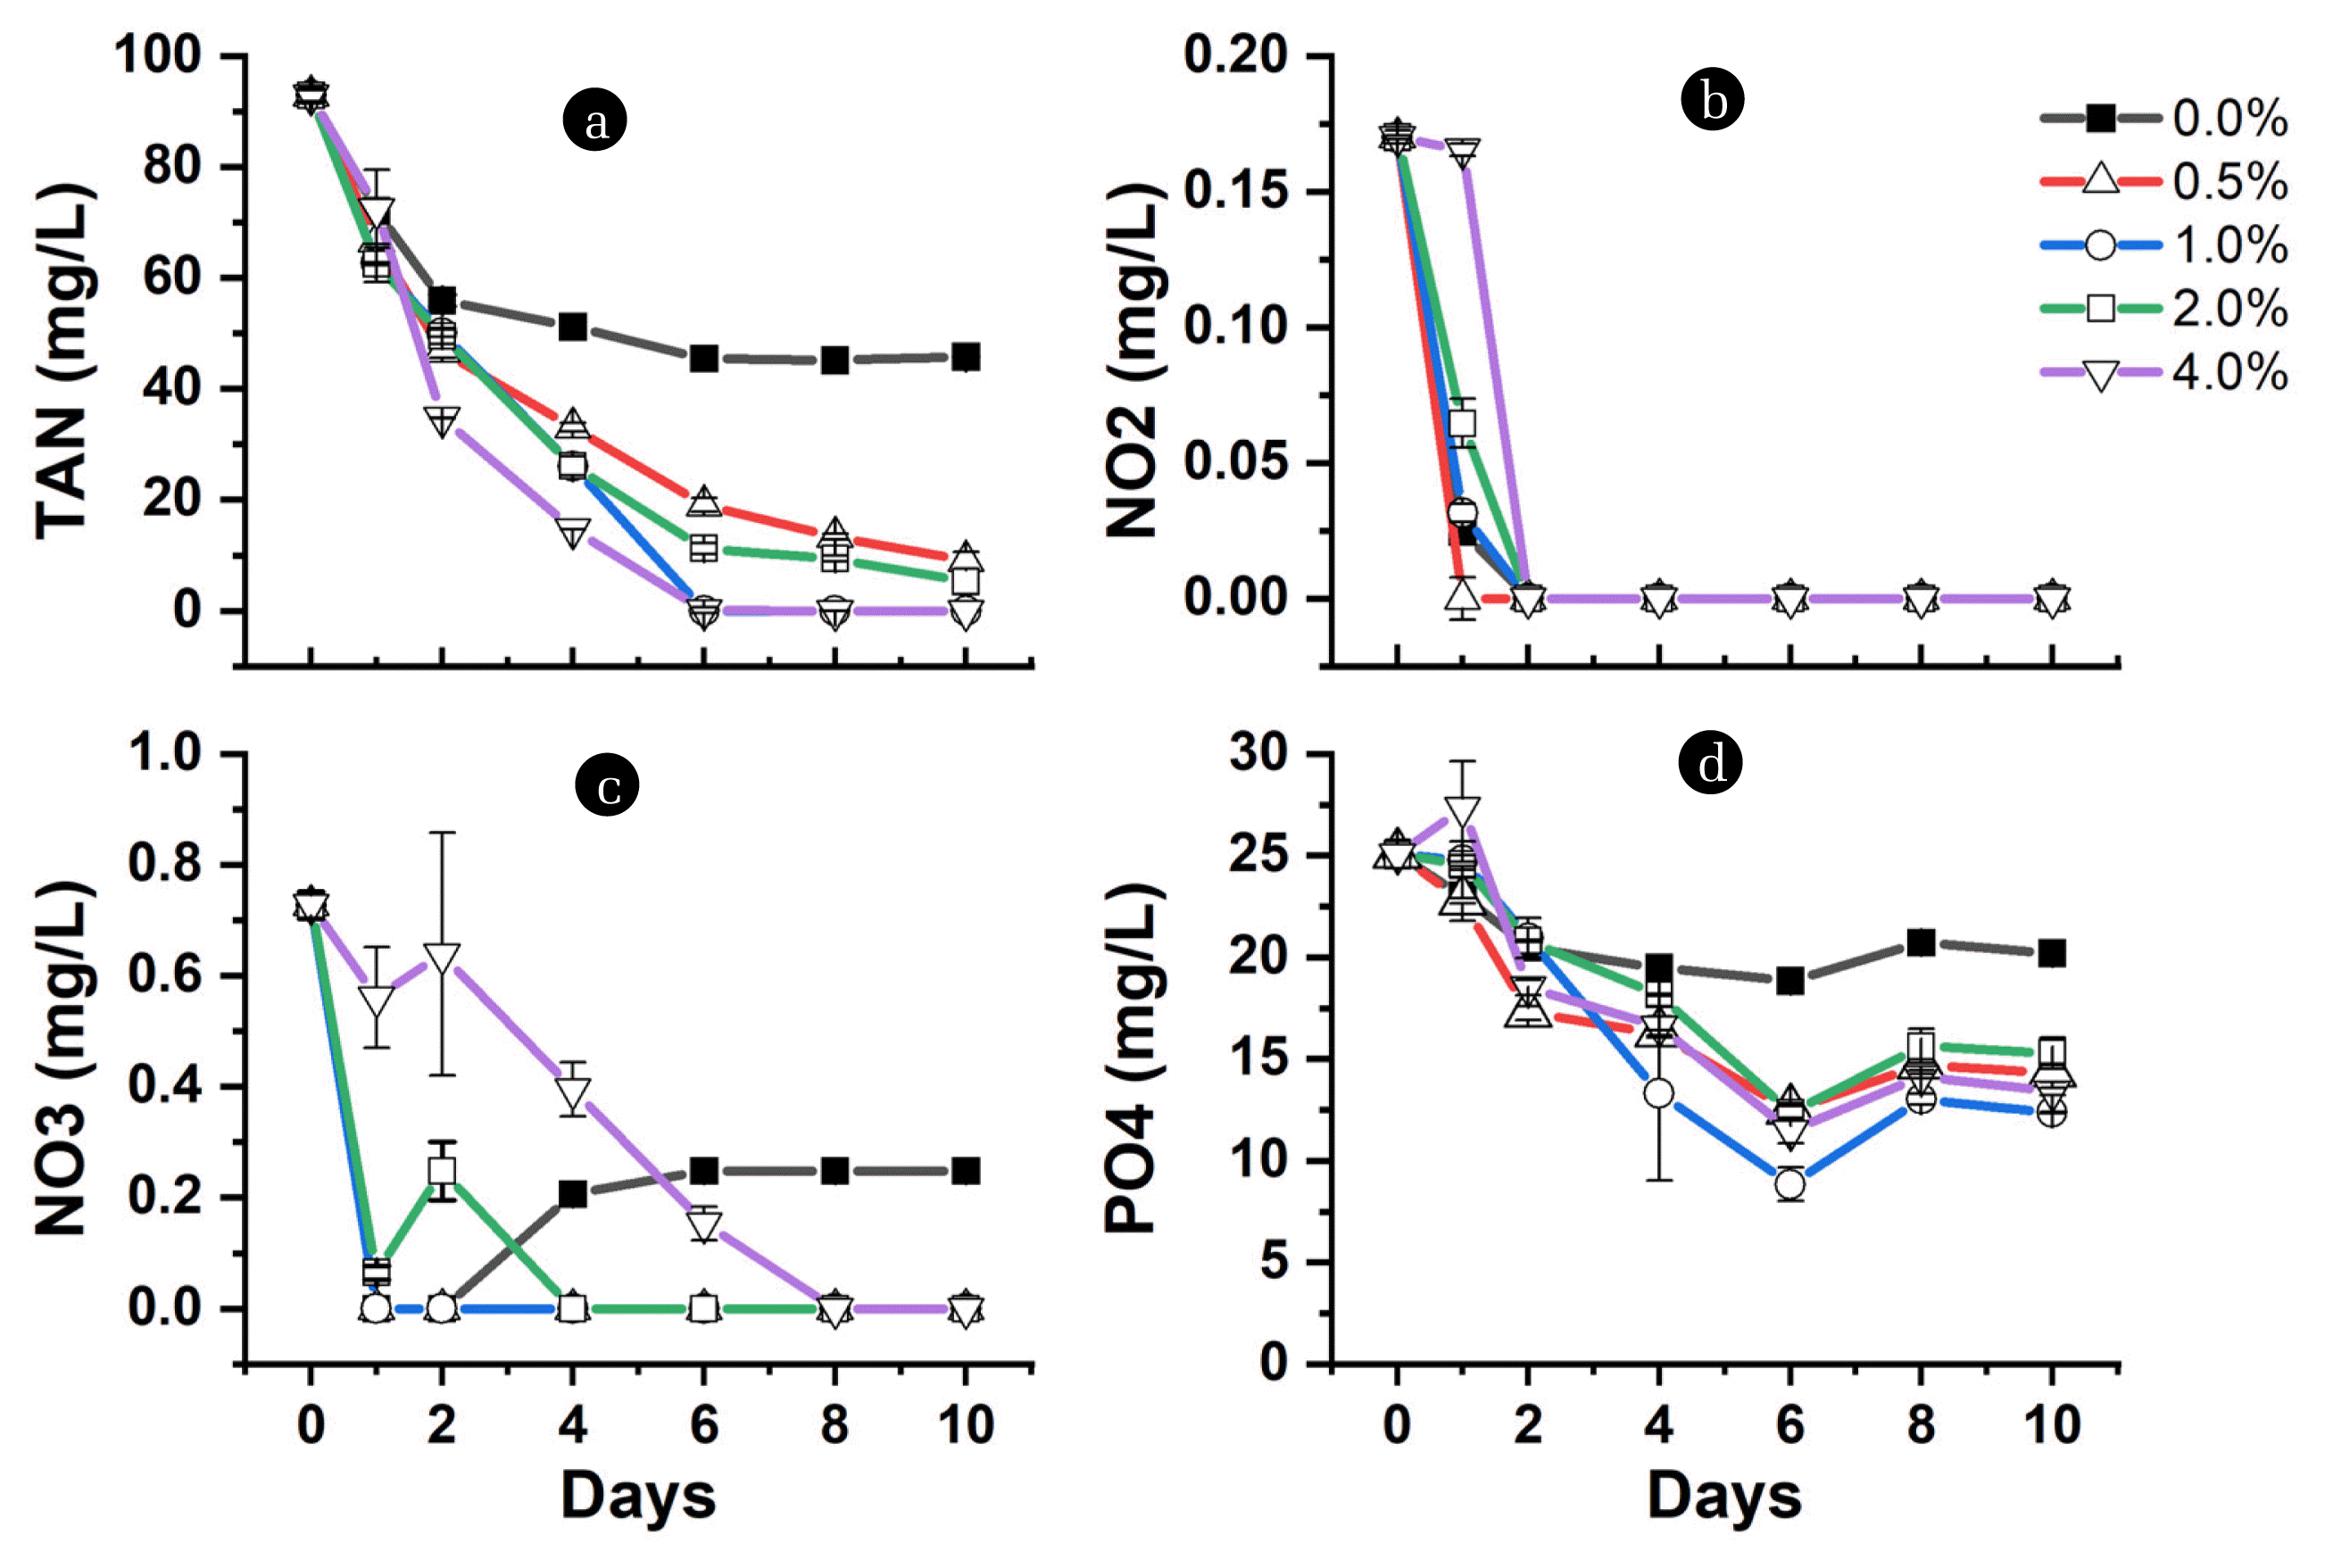
It is noted that during this period of pH drop at 0 %, the nutrient removal is high, in which 37 mg/L TAN and 4.6 mg/L phosphates were removed within 1 – 2 d (Fig. 5a, d). Upon addition of charcoal at 0.5 – 4.0 %, the TAN removal improved to reach 45 – 60 mg/L, while 4 – 9 mg/L phosphate within the same 1 – 2 d. The high nutrient removal in the added charcoal is attributed to the enhanced surface area for bacterial attachment and the adsorption from charcoal. The charcoal porosity and specific surface area provide microorganisms with a growth substrate to promote the organisms' biodegradation capability [40, 84]. Electron microscopy of biochar after culture with E. Coli bacteria revealed that bacteria could form biofilm on the surface of biochar [65]. The bacteria and microalgae readily assimilate glucose to grow together to remove nitrogen and phosphate concentrations [85].
Beyond day 2 characterizes the decline in TAN and phosphate removal in 0% charcoal, probably due to a decrease in microbial growth. Dissolved organic carbon causes short-lived (≤ 48h) peaks in bacterial productivity [86]. Further, heterotrophic bacterial growth is known to reduce pH; however, pH change inhibits the growth of microbial populations or even extinction in extreme conditions [30]. Thus, the delay in the sudden pH drop, which increases with increasing charcoal levels, enhances nutrient removal. Fig. 5b and c show the nitrite and nitrate removal to be higher as the charcoal level decreases. After it falls to the below detectible limit at 0 % charcoal, nitrate concentration rises continuously from day 2. This suggests a shift to nitrification, which further contributes to TAN removal. However, no rise in nitrate concentration is observed when the concentration falls below the detectable limit at 0.5 – 4.0 % charcoal. Part of it might be adsorbed to charcoal since exposure to a low pH solution makes the surface positively charged [43].
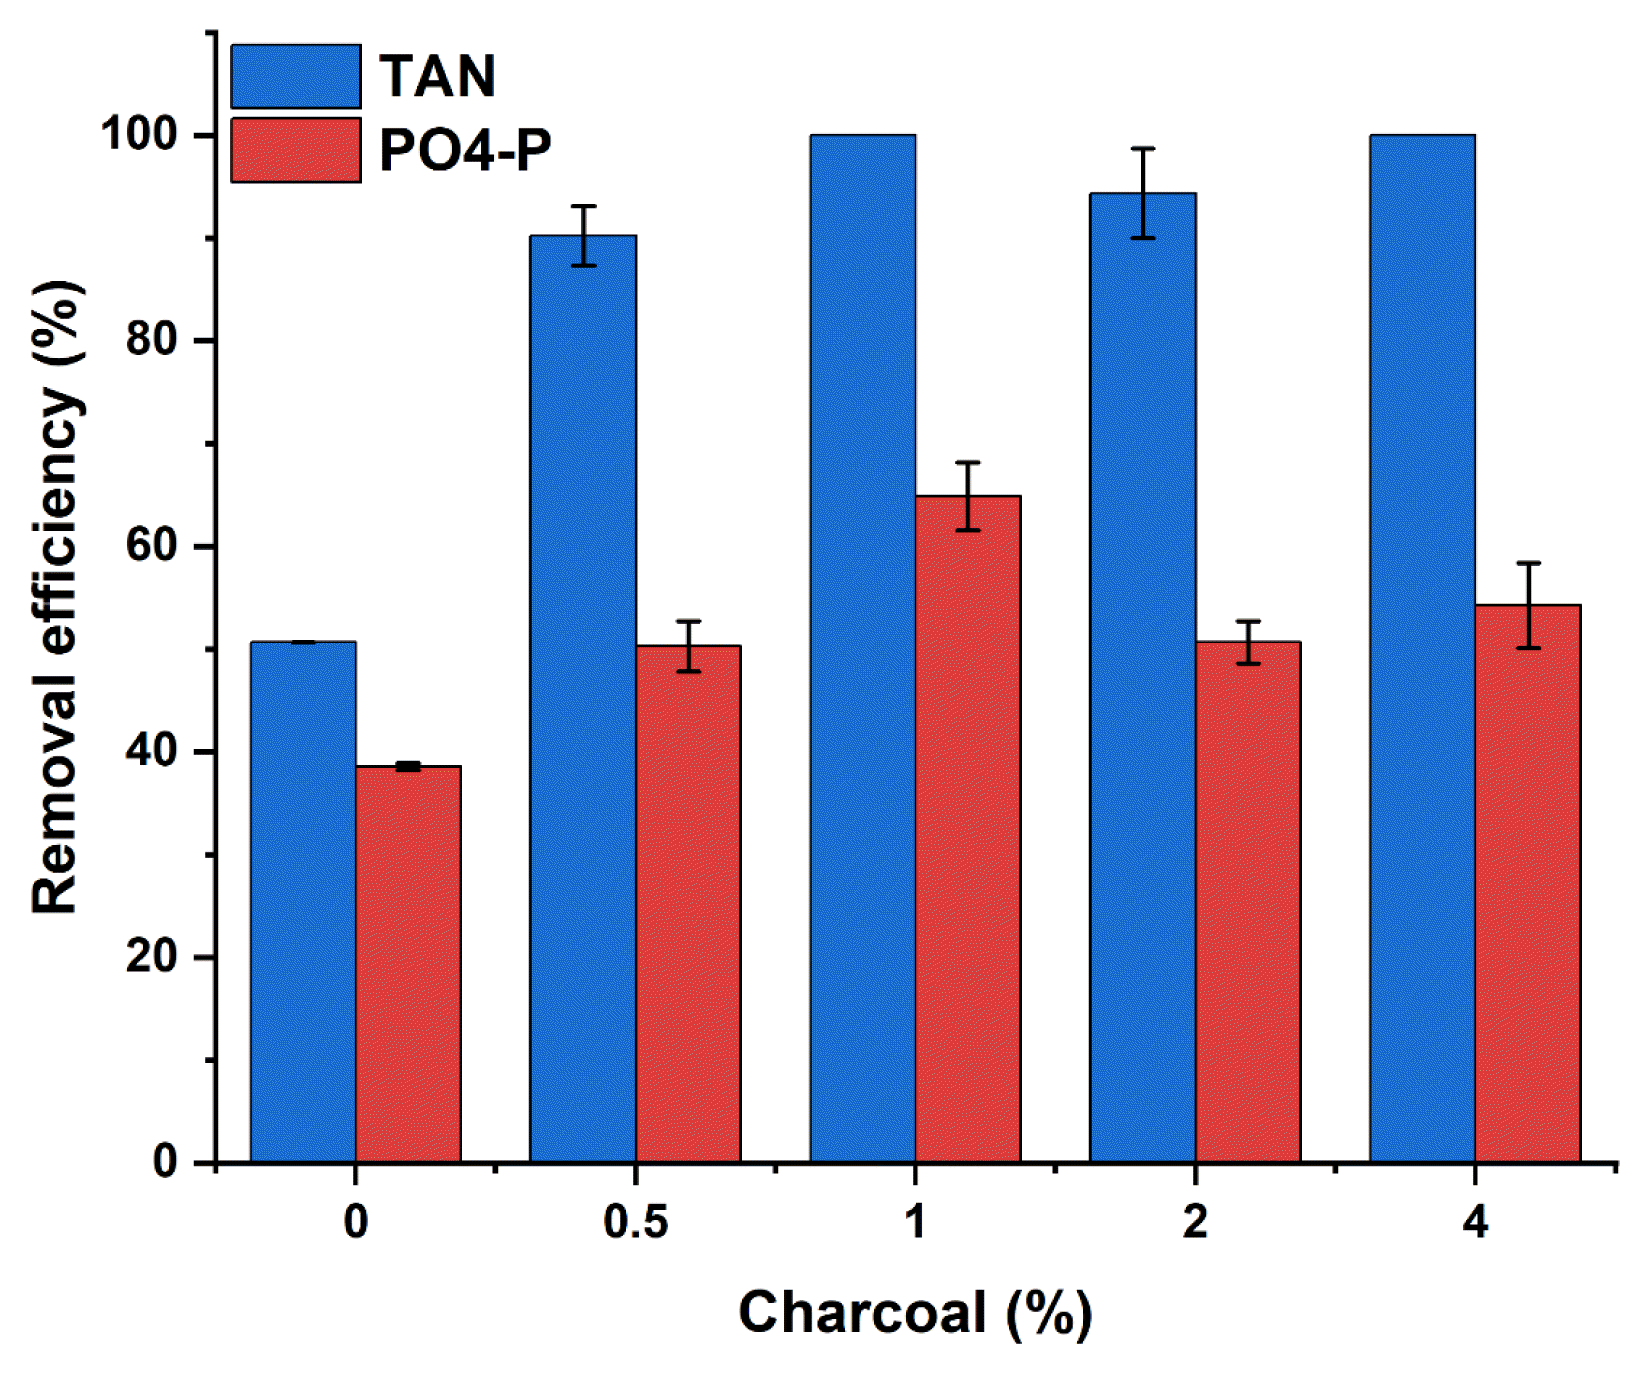
The positively charged surface allows the negatively charged molecules, such as the NO3−, NO2−, and PO43−, to be adsorbed on the charcoal. However, the adsorption of these negatively charged molecules will be higher as the pH becomes low because the anion exchange capacity increase with decreasing pH [87]. This is especially true considering that due to the high pH value at 4.0 % charcoal, nitrate takes 8 d before complete removal, instead of 1 to 2 d observed at 0.5 – 2.0 % charcoal (Fig. 5c). Although the delay in the complete removal of NO3− at 4.0 % may be considered to have been caused by PO43− adsorption since the sorption site prefers highly negatively charged potential anions [38]. Fidel et al. [36] indicated the high adsorption of NO3− to biochar in a solution with low pH of 3.5 – 4.0 and adsorption for NH4+-N at a pH of around 7.0 – 7.5, which signifies the importance of pH of a solution and adsorbent's chemical composition in ion exchange mechanisms. This implies that the adsorption of cations occurs in 0.5 – 4.0 % charcoal levels at a point the pH is above the PZC, which improves the TAN removal and prevents the sudden pH drop. Over time, the decrease in pH presented a high concentration of H+, which will compete with NH4+-N for available cation exchange sites [36, 56], which explained the difference in TAN removal and pH stability as the charcoal percentage increased. It can be seen that 92.8 mg/L (99.96 %) of TAN was removed within 6 days at 4.0 %. However, by the end of the experiment, a comparable TAN removal efficiency was attained at 0.5 – 4.0 % charcoal, strengthening the extent of microbial assimilation of TAN, nitrification, and adsorption at different levels of charcoal over time (Fig. 6). Unlike TAN, which remains steady after attaining maximum efficiency, a rise in the concentration of phosphate was observed from day 6 (Fig. 5d). Cell death may cause phosphate release [71] or the occurrence of phosphate desorption from charcoal due to pH change [88]. Nevertheless, the phosphate removal efficiency was high at 0.5 – 1.0 % of charcoal (Fig. 6), suggesting high adsorption from charcoal due to low pH below PZC, which provides a more positive charge surface for anions adsorption.
Given the above, it can be considered that ability to remove around 92.8 mg/L (99.96 %) TAN and 13 mg/L (55%) phosphate while stabilizing pH in a condition sufficient for the survival of aquatic organisms through the addition of carbohydrates coupled with charcoal addition as a huge potential for aquaculture and environmental management. This is because to produce just a ton of fish, around 78 kg N, and 9.5 kg P can be released into the environment, leading to eutrophication and environmental and economic challenges. According to Nie et al. [4], the Chinese government budgeted 16 billion dollars to control eutrophication, causing a harmful algal bloom in Taihu lake. Thus, achieving high nutrient removal in the present study could aid in sustaining the environment. Furthermore, charcoal can longer support the culture system since most of the reported level of ammonia concentration throughout the culture period in the biofloc system was, for example, 0 – 15 mg/L in a culture of Nile tilapia [32], 0.1 – 1.0 for Nile tilapia–redclaw crayfish co-culture systems [78], etc.
4. Conclusions
The present study reveals the interplay between microbial pathways and charcoal. Through this, charcoal conditioned the pH of the medium within the tolerance limit of microbial survival and development, thereby enhancing the nutrient absorption efficiency and resulting in the successful removal of TAN and phosphate. However, the influence of charcoal varies as the percentage of charcoal increases. At 4.0 % charcoal, the pH was stabilized at 6.0 – 7.5 in heterotrophic and 7.5 – 7.9 in autotrophic pathways, which are both optimum ranges for the survival of culture organisms, while respectively removed 99.96 % and 50 % TAN, and 55 and 17 % phosphate concentrations within 6 d. Hence, considering the stability of pH within the optimum range for the survival of the aquatic organism and improved nutrient removal, charcoal, as used in this economical and handy form, has significant functions in improving water quality, which is essential for sustainable aquaculture. And thus, more should be explored on how to perpetuate the property to retain and/or strengthen charcoal effectiveness as its property changes with a change in pH towards nutrient removal in aquaculture and wastewater management.