1. Introduction
Most of water resources in Korea - annual average water consumption is 37.7 billion m3 - depend on rivers and lakes and such water resources require continuous management in order to meet the purpose of their appropriate usage [1, 2]. For proper water quality managements of water resources, the water quality monitoring plays an important role to prevent water pollutions caused by flows from non-point pollution sources and industrial wastewater as well as sewage throughout observing changes of water qualities of water resources. In addition, the physical, chemical, and ecological characteristics of water resources could be figured out using data accumulated by the water quality monitoring.
Water quality monitoring systems mostly depend on the analyzing in-situ grab water samples. Such process is both cost- and labor-intensive and makes time gaps between sample collection and measurement. To overcome those disadvantages, automatic water quality monitoring networks were developed. However, automatic water quality monitoring networks require expensive equipment as well as manpower for continuous maintenance and repair. Moreover, water quality data from current monitoring systems show the status of water quality for sampling points only, so the data are insufficient to represent the state of the entire water body [3–5].
Remote sensing is a technology which could get information about an object or phenomenon on the surface, the atmosphere, and the ocean without making physical contacts by using propagated signals, e.g. electromagnetic radiation from satellite or aircraft-based sensor. Remote sensing technologies make possible to observe a wide area at the same time as well as collect data from geographically inaccessible areas. Due to these advantages, remote sensing technology is widely applied for efficient water quality monitoring and not only water quality factors with clear optical properties such as turbidity and chlorophyll-a, but also those with unclear optical properties i.e. total nitrogen and total phosphorus which are soluble substances could be observed [6–12].
In this study, an approach to support deficiencies of the current water quality monitoring system i.e. timing issue, cost-, labor-intensive, was investigated. The approach took an advantage from satellite images, specifically Landsat 8 images, to estimate the quality of river’s water. The study focused on five water quality factors to estimate their levels of the river using the optical band and thermal infrared band data of satellite images. Results of the study could assist the current water quality monitoring system.
2. Methods
2.1. Study Area (Kumho River)
The Kumho River is located at the Southeast of South Korea and its total length is about 118 km, from City of Pohang to Daegu Metropolitan City. Its watershed covers 2,110 km2 of area and has 23 branches. The average annual precipitation in the Kumho River basin is 1,030.6 mm, which is 128.4 mm and seasonal variations of precipitation are large since 677.9 mm of precipitation (65.8% of total annual precipitation) is concentrated in summer season (June to September). This variation brings several issues, i.e. flood during summer season, lack of river’s maintenance flow during winter season, deteriorating water quality during low flow rate season etc.
Historically, the Kumho River was the most polluted river in Korea in 1980s - its BOD level at the end of river was 191 mg/L in 1983 - because of urbanization and population growth in adjacent areas such as Daegu Metropolitan City and City of Gyeongsan while the river had abundant clean water and its ecosystem was well preserved until the 1970s. The river’s water quality, however, has dramatically improved - its annual average BOD reached at 3.8 mg/L at the end of Kumho River in 2017 because Korean government as well as local government, especially for Daegu Metropolitan City, put their huge investments to recover the Kumho River’s water quality [13~15].
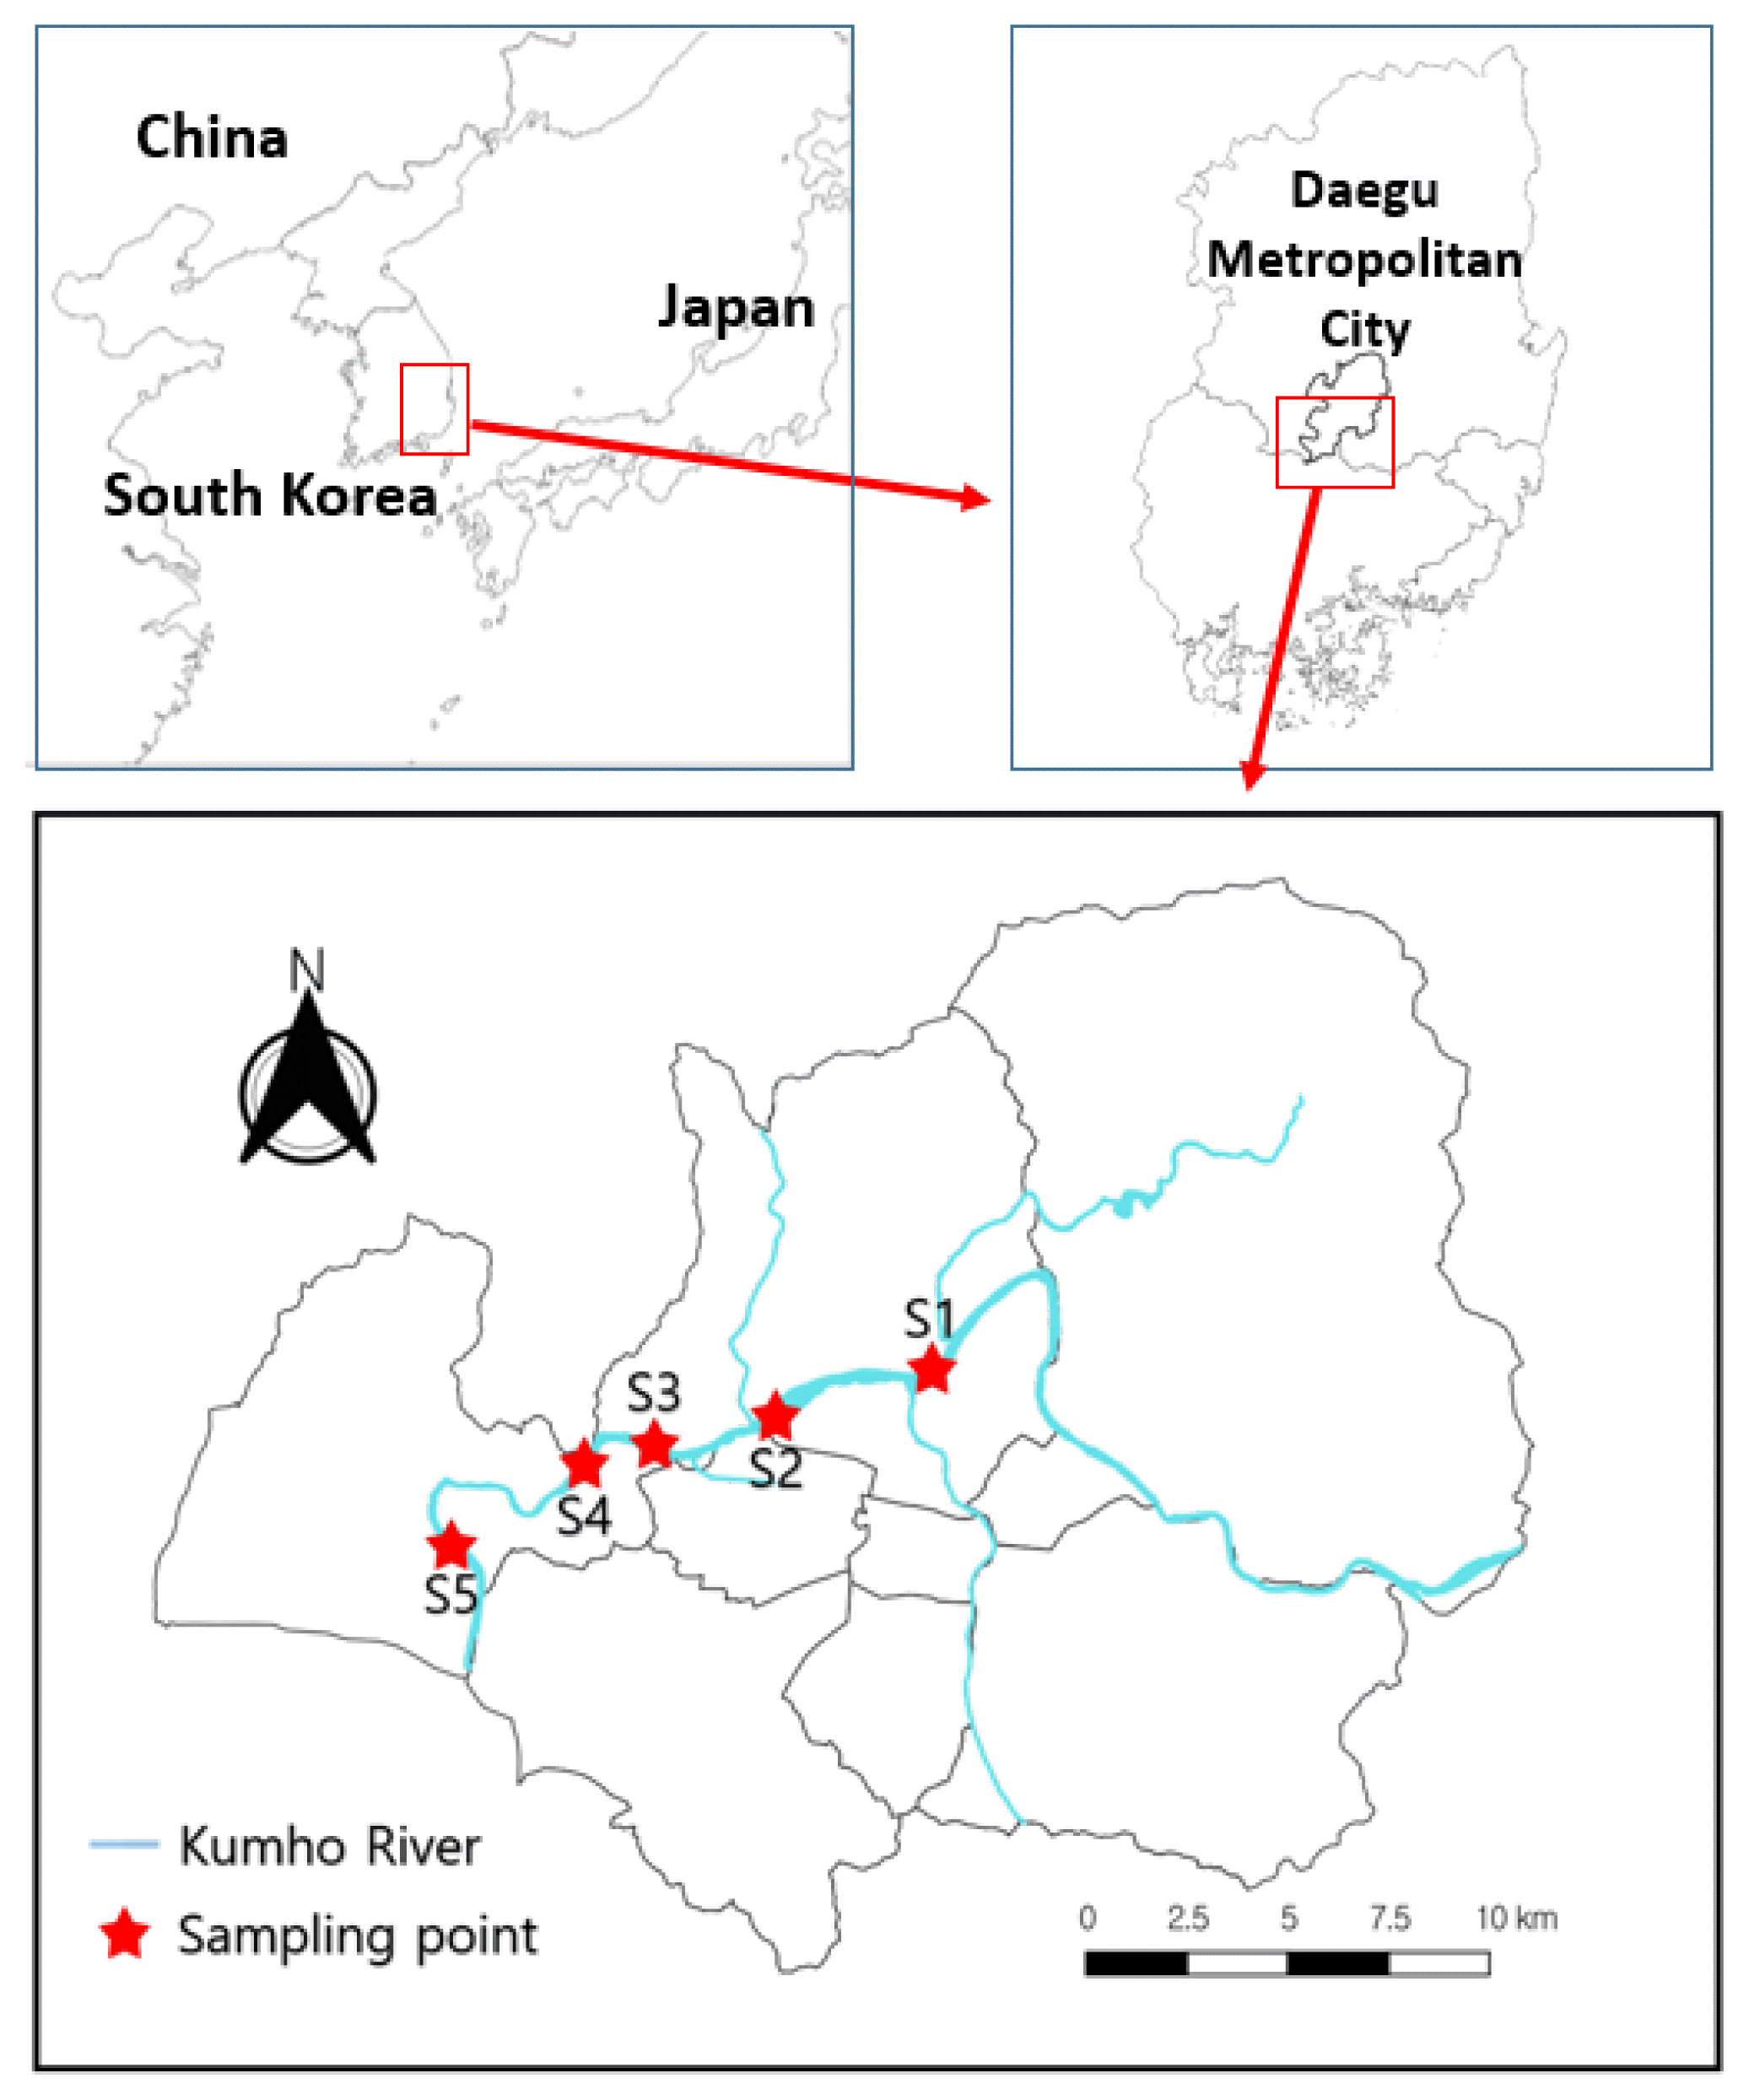
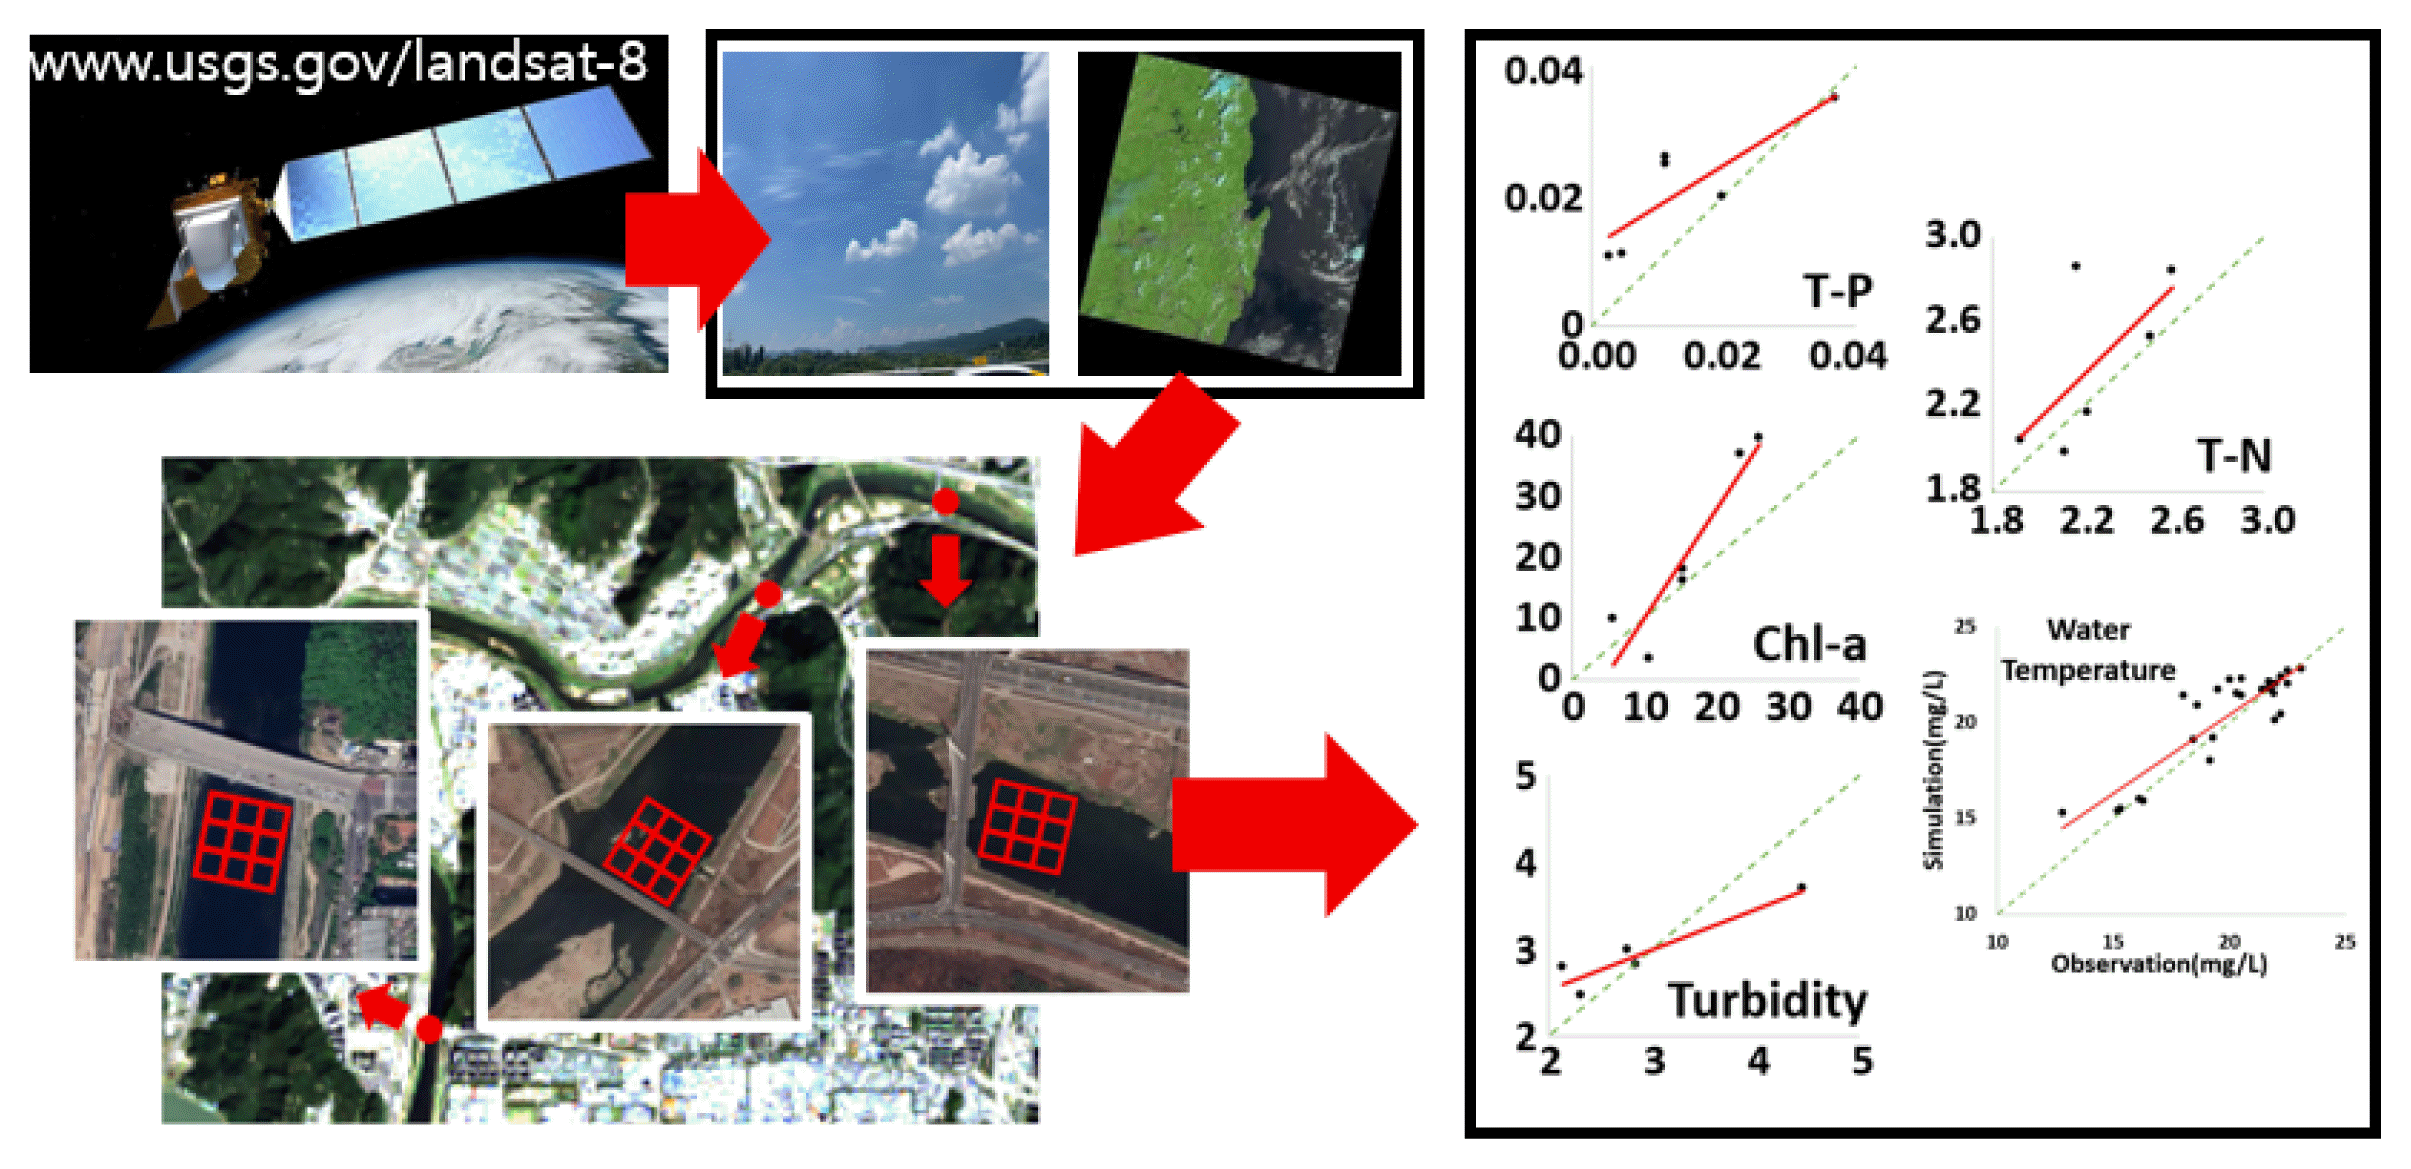
Fig. 1 shows the study area and sampling points. The study area is the downstream of Kumho River which located at the middle of Daegu Metropolitan City and five sampling points were selected for water quality monitoring to compare their water quality data to the satellite data.
2.2. Landsat 8
Landsat 8, launched on February 11, 2013, is the 8th satellite of the Landsat program which is being carried out in collaboration with the National Aeronautics and Space Administration (NASA) and the United States Geological Survey (USGS). The Landsat 8 satellite has an imaging cycle of 16 days, and is equipped with an Operational Land Imager (OLI) composed of nine optical bands and a Thermal Infrared Sensor (TIRS) composed of two thermal infrared bands. The OLI sensor has a resolution of 30 × 30 m and collects properties of objects as information in the visible region, near infrared region, and short wave infrared region and The TIRS sensor provides information about the brightness and temperature of objects by detecting the long-wavelength thermal infrared region.
Compared to Landsat 7 satellites, Landsat 8 adds three new spectrum bands – two for OLI and one for TIRS. Band 1 (Coastal/Aerosol) of OLI sensor is to more accurately detect low-wavelength, especially for blue light scattered by small dust or water vapor in the air and the purpose of Band 9 (Cirrus) of OLI sensor is to measure atmospheric conditions and the range of cirrus clouds. Currently, two additional bands (Band 1 and Band 9) of OLI are used in many studies to detect clouds and restore images by analyzing the spectral characteristics of clouds.
The TIRS of the Landsat 8 satellite divided by two narrower spectral bands to collect more accurate data while the TIRS of the Landsat 7 satellite had one broad spectrum band for the thermal infrared region. The spatial resolution for the TIRS of Landsat 8 satellite is lowered from 60×60m (Landsat 7) to 100×100m, but the acquired 100×100m data are registered to the OLI data and then rearranged by radiation correction, geometric correction, and topography correction to provide 30m×30m resolution data. Table S1 shows characteristics of each band on-board in Landsat 8 [16–18].
2.3. Satellite Image Processing
The correction of the satellite image data must be prioritized since errors occur in image processing because distortion and damage arise in the data collection process due to various factors such as the Earth’s rotation, atmosphere, topography, and scanning systems [19]. The processes of correcting the interference factor of satellite images, called image preprocessing, include atmospheric correction, geometric correction, radiation correction, masking etc.
2.3.1. Radiometric correction
Corrections for radiation distortion are required since the brightness value of the image changes depending on the altitude angle of the sun, the atmospheric condition at the time of observation, and topographical factors, etc. In addition, the brightness value, size, direction, etc. of the shadow, even between images acquired from the same sensor, may appear differently depending on the relationship between the satellite and the sun and/or weather conditions. Radial normalization is required to detect changes accurately, and normalization is performed using histogram matching, etc.
The radiation correction includes absolute radiation correction and relative radiation correction. An absolute radiation correction is to perform radiation correction using terrestrial observations in the same time zone for which satellite data were acquired and the method is regarded as the most effective method for removing atmospheric influence and correcting sensors. A relative radiation correction is a method that uses satellite images from different periods to minimize the difference in brightness values between the input image and the reference image [20].
2.3.2. Atmospheric correction
In this study, satellite image data needed to convert to reflectance values of water body for statistical analysis and regression analysis to estimate water quality factors since Landsat 8 satellite image data is provided as a digital number (DN) value. Landsat satellites include image files (TIFF) and metadata files (MTL) for each band when providing data and by using the multiple conversion factor (MULT_BAND) and the addition conversion factor (ADD_BAND) of this MTL file, it can be converted into radiant luminance or reflectivity values. In this study, atmospheric correction was performed using the FLAASH tool in the ENVI software. The FLAASH tool has high accuracy because it can effectively remove the scattering of water vapor and aerosol than other methods in atmospheric correction and Fig. S1 shows the process of FLAASH tool.
Firstly, radiation correction was performed to convert the low and DN values into radiance values. Eq. (1) calculates radiance at the top of atmosphere and the values of the Landsat 8 MTL files were used for ML and AL values.
LTOA = Radiance at the top of atmosphere
ML = MULT_BAND_Radiance value at MTL file
AL = ADD_BAND_Radaiance value at MTL file
The obtained radiance value of the upper atmosphere was converted to a value of reflectance at the top of atmosphere by Eq. (2) which is calculated by normalizing the LTOA to the average solar irradiance.
ρTOA = Reflectance at the top of atmosphere
d = Distance from the Earth to the Sun
θS = Solar zenith angle
ESUNλ = The direct solar radiation component
Reflectance at the top of atmosphere value is calculated by converting the surface reflectance value by applying the Atmospheric model and Aerosol model of the FLAASH module. Various atmospheric models apply differently depending on latitude and surface temperature. Kumho River is located near latitude 35.8 / longitude 128.5, so the model was selected according to the target site. The FLAASH module provides a list of models based on season, latitude and surface temperature. At 30° latitude, it is recommended to use the Mid-Latitude Summer (MLS) model from January to June and November to December, and the Tropical model from June to October. Table S2 shows the list provided by the FLAASH tool for seasonal-latitude surface temperature model.
Aerosol models are divided into Rural / Urban / Maritime/Tropospheric and the study used the Urban model since the Kumho River is located within the city. The calculated surface reflectance (ρω) value was divided by π and finally converted into a remote sensing reflectance (Rrs) value as shown in Eq. (3) [11].
2.3.3. Calculation for brightness temperature
The brightness temperature equation of the TIRS sensor, commonly used for estimating water temperature using satellite images regardless of location, was used to simulate the water temperature of the study are. Band 10 and Band 11, included in the TIRS sensor, could be converted into brightness temperature values by using the addition conversion factor and multiple conversion factor of the MTL file provided by the Landsat 8 satellite. For more accurate temperature calculation, the formula of (B10Temp+B11Temp)/2 applied to both bands is sometimes used. However, Band 11 of the TIRS sensor, which has an expected lifespan of 3 years, has a problem of stray light affected by causes other than regular refraction or reflection in optical devices, so USGS recommended not to use Band 11 for surface temperature analysis [21]. The study, therefore, adopted Band 10 only for water temperature analysis.
Similar to the atmospheric correction procedure, the value of the MTL file was used to convert the DN value to the Radiance value. For Band 10, the multiple conversion factor value is 0.0003342 and the addition conversion factor value is 0.1 for above Eq. (1). The calculated radiance recalculated for ‘at-satellite brightness temperature’ using following Eq. (4);
2.4. Sampling
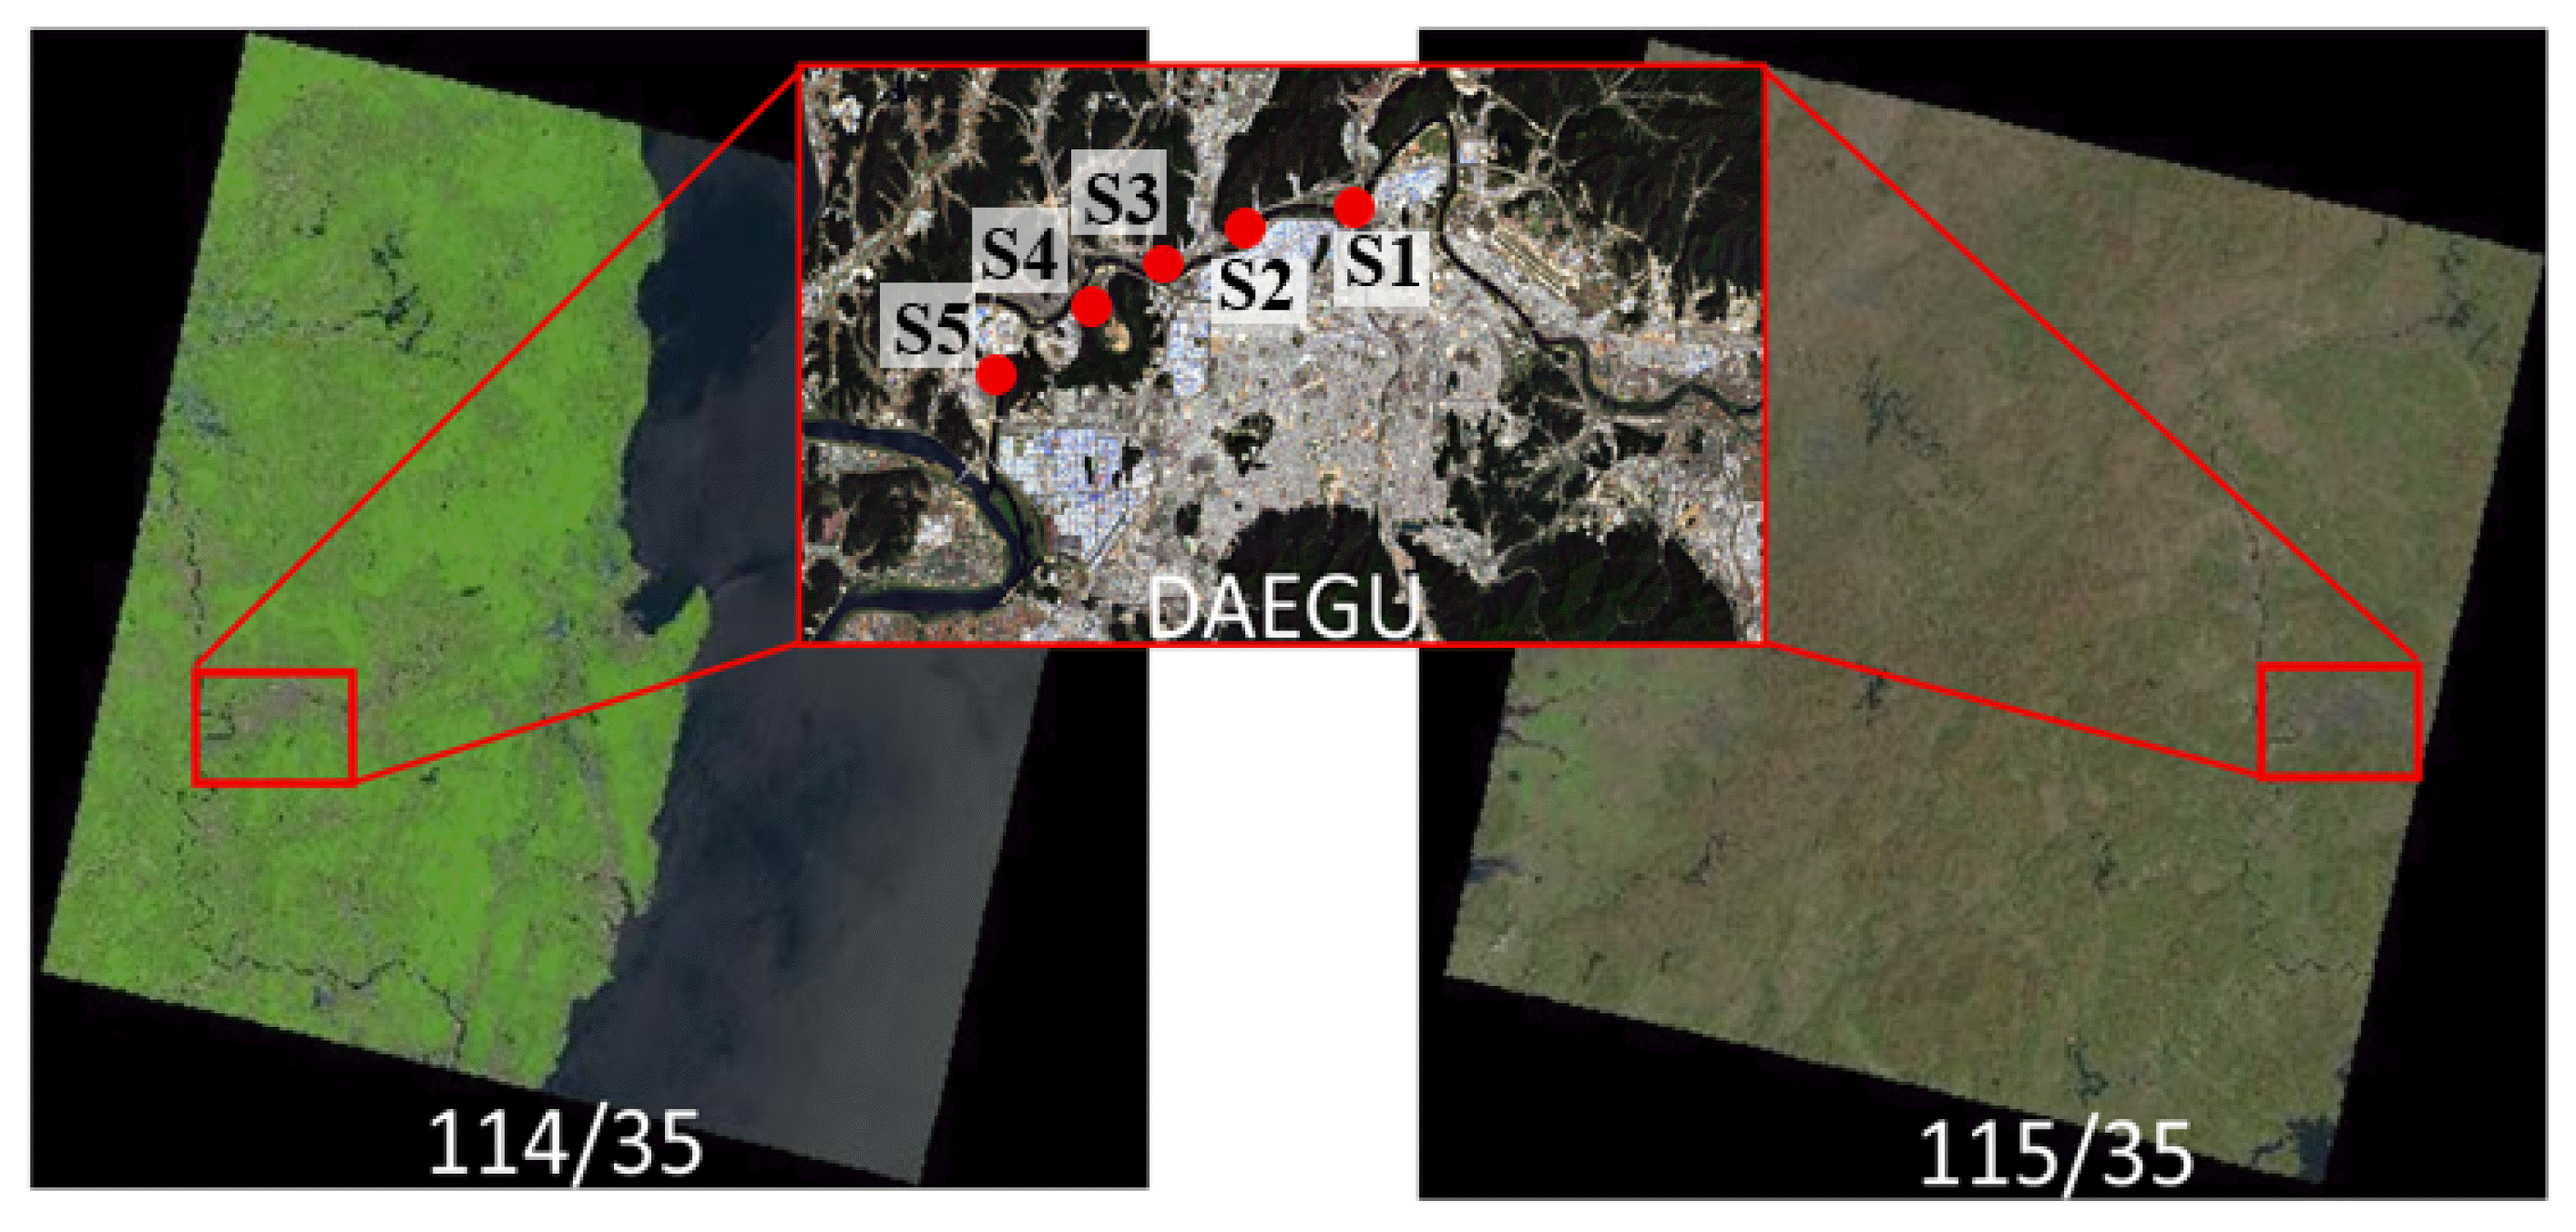
Six times of samplings for five sampling sites, as shown in the Fig. 1, were conducted from May to October 2021 along with the Landsat 8 OLI/TIRS satellite cycle (16 days). As shown in the Fig. 2, the points of satellite images to cover the study area are Path 114 / Row 35 and Path 115 / Row 35, and the observing interval between each point is approximately 7 days. The shooting time for the study area is approximately 02:00 (UTC+0:00), so when converted to UTC+9:00, it is approximately at 11 am and field samplings carried out at the same time.
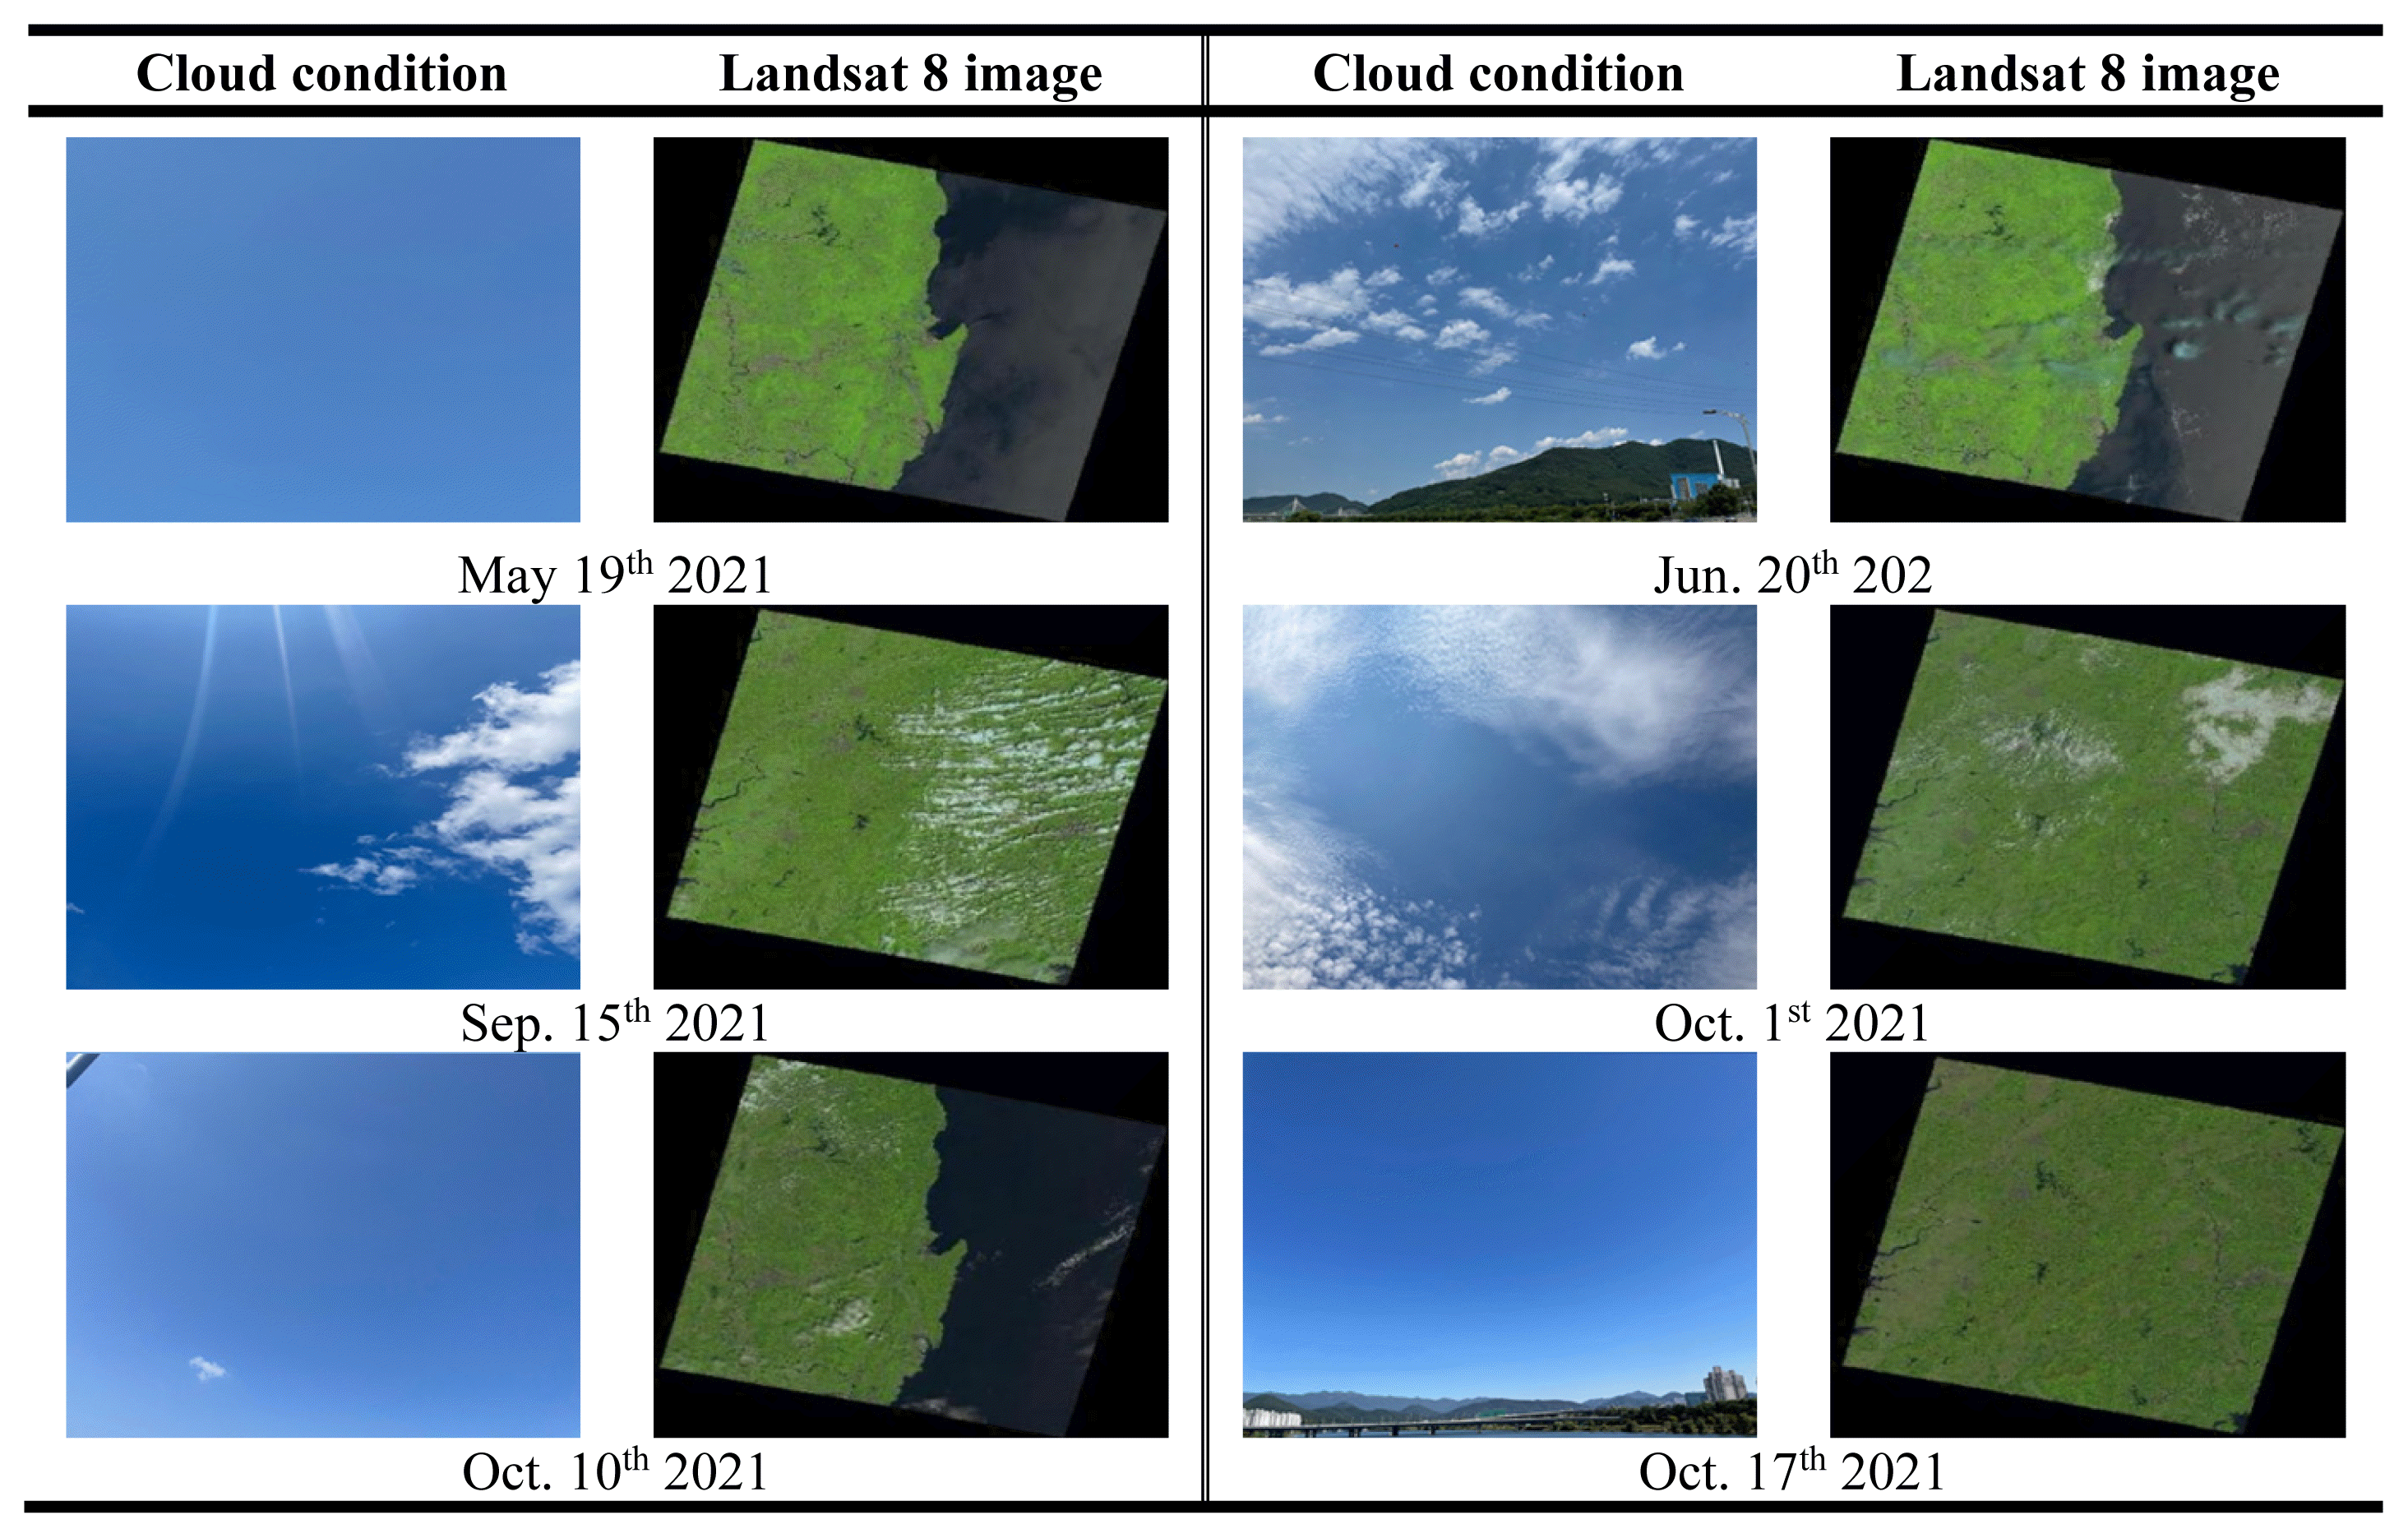
Weather conditions, especially for cloud, were predicted after reviewing weather forecast, provided by the Korea Meteorological Administration based on GEO-KOMPSAT-2A, for real-time cloud information in accordance with the satellite cycle date. Samplings were not performed although the day was matched with the satellite period when the cloud cover value at the time of shooting is high since remote sensing using satellites is greatly affected by clouds. Table S3 shows the locations for the weather stations for the study and Table S4 shows the weather conditions, temperature, path/row, and cloudiness on each sampling date.
2.5. Water Sample Analysis
6L of samples were taken and mixed at each points and immediately transported to the laboratory to analyze water quality factors except water temperature and turbidity. Water temperature and turbidity were measured at the field using thermometer and turbidmeter. Other water quality factors were analyzed according to the Standard Methods for water, absorbance spectrophotometry method for Chlorophyll-a (Chl-a), Total Nitrogen (T-N) and Total Phosphorus (T-P) [22].
2.6. Statistical Analysis
Six Band data (Band 2 ~ Band 7) of the OLI sensor were used to estimate concentrations of five water quality factors; Temperature, Turbidity, T-N, T-P and Chl-a. Correlation analysis was applied to analyze relationships of the converted reflectance values. Highly correlated band data based on the results of correlation analysis were used as independent variables for the regression analysis and the observation data for each water quality factor were used as dependent variables. Correlation coefficient (R value) for observation values and simulation ones were calculated by Eq. (5) to check the correlation strength between the two values and Table S5 shows Linear relationship of the Pearson’s correlation coefficient ranges. Root Mean Square Errors (RMSEs) between the simulated value and the observed value were calculated by Eq. (6) to analyze the degree of inconsistency of the simulations.
3. Results and Discussion
3.1. Water Quality Monitoring
Photos for cloud conditions and satellite images of study area for the sampling dates are shown in the Fig. 3. The scene cloud cover of sampling dates were 0.06 % (May 19th), 12.44 % (June 20 th), 22.18 % (Sep. 15th), 12.94 % (October 1st), 4.98 % (Oct. 10th) and 0.04 % (Oct. 17th), respectably. As shown in the Fig. 3, satellite images for clear days, May 19th and Oct. 17th, were not affected by cloud while those for other days affected by clouds. Images, however, for study area of other days were clear although scene cloud covers were high because most of clouds of those days were positioned outside of the study area.
The results of the water quality monitoring for the Kumho River conducted from May 2021 to October 2021 are shown in the table S6. Based on preliminary survey, three sampling points were selected and water samples were collected on May 19, but the distance between S2 and S5 is much farther than that of S1 and S2. Therefore, two more sampling points, S3 and S4, were added after Jun. 20th because longer distance of intermediate sampling points can lead to errors for the regression analysis.
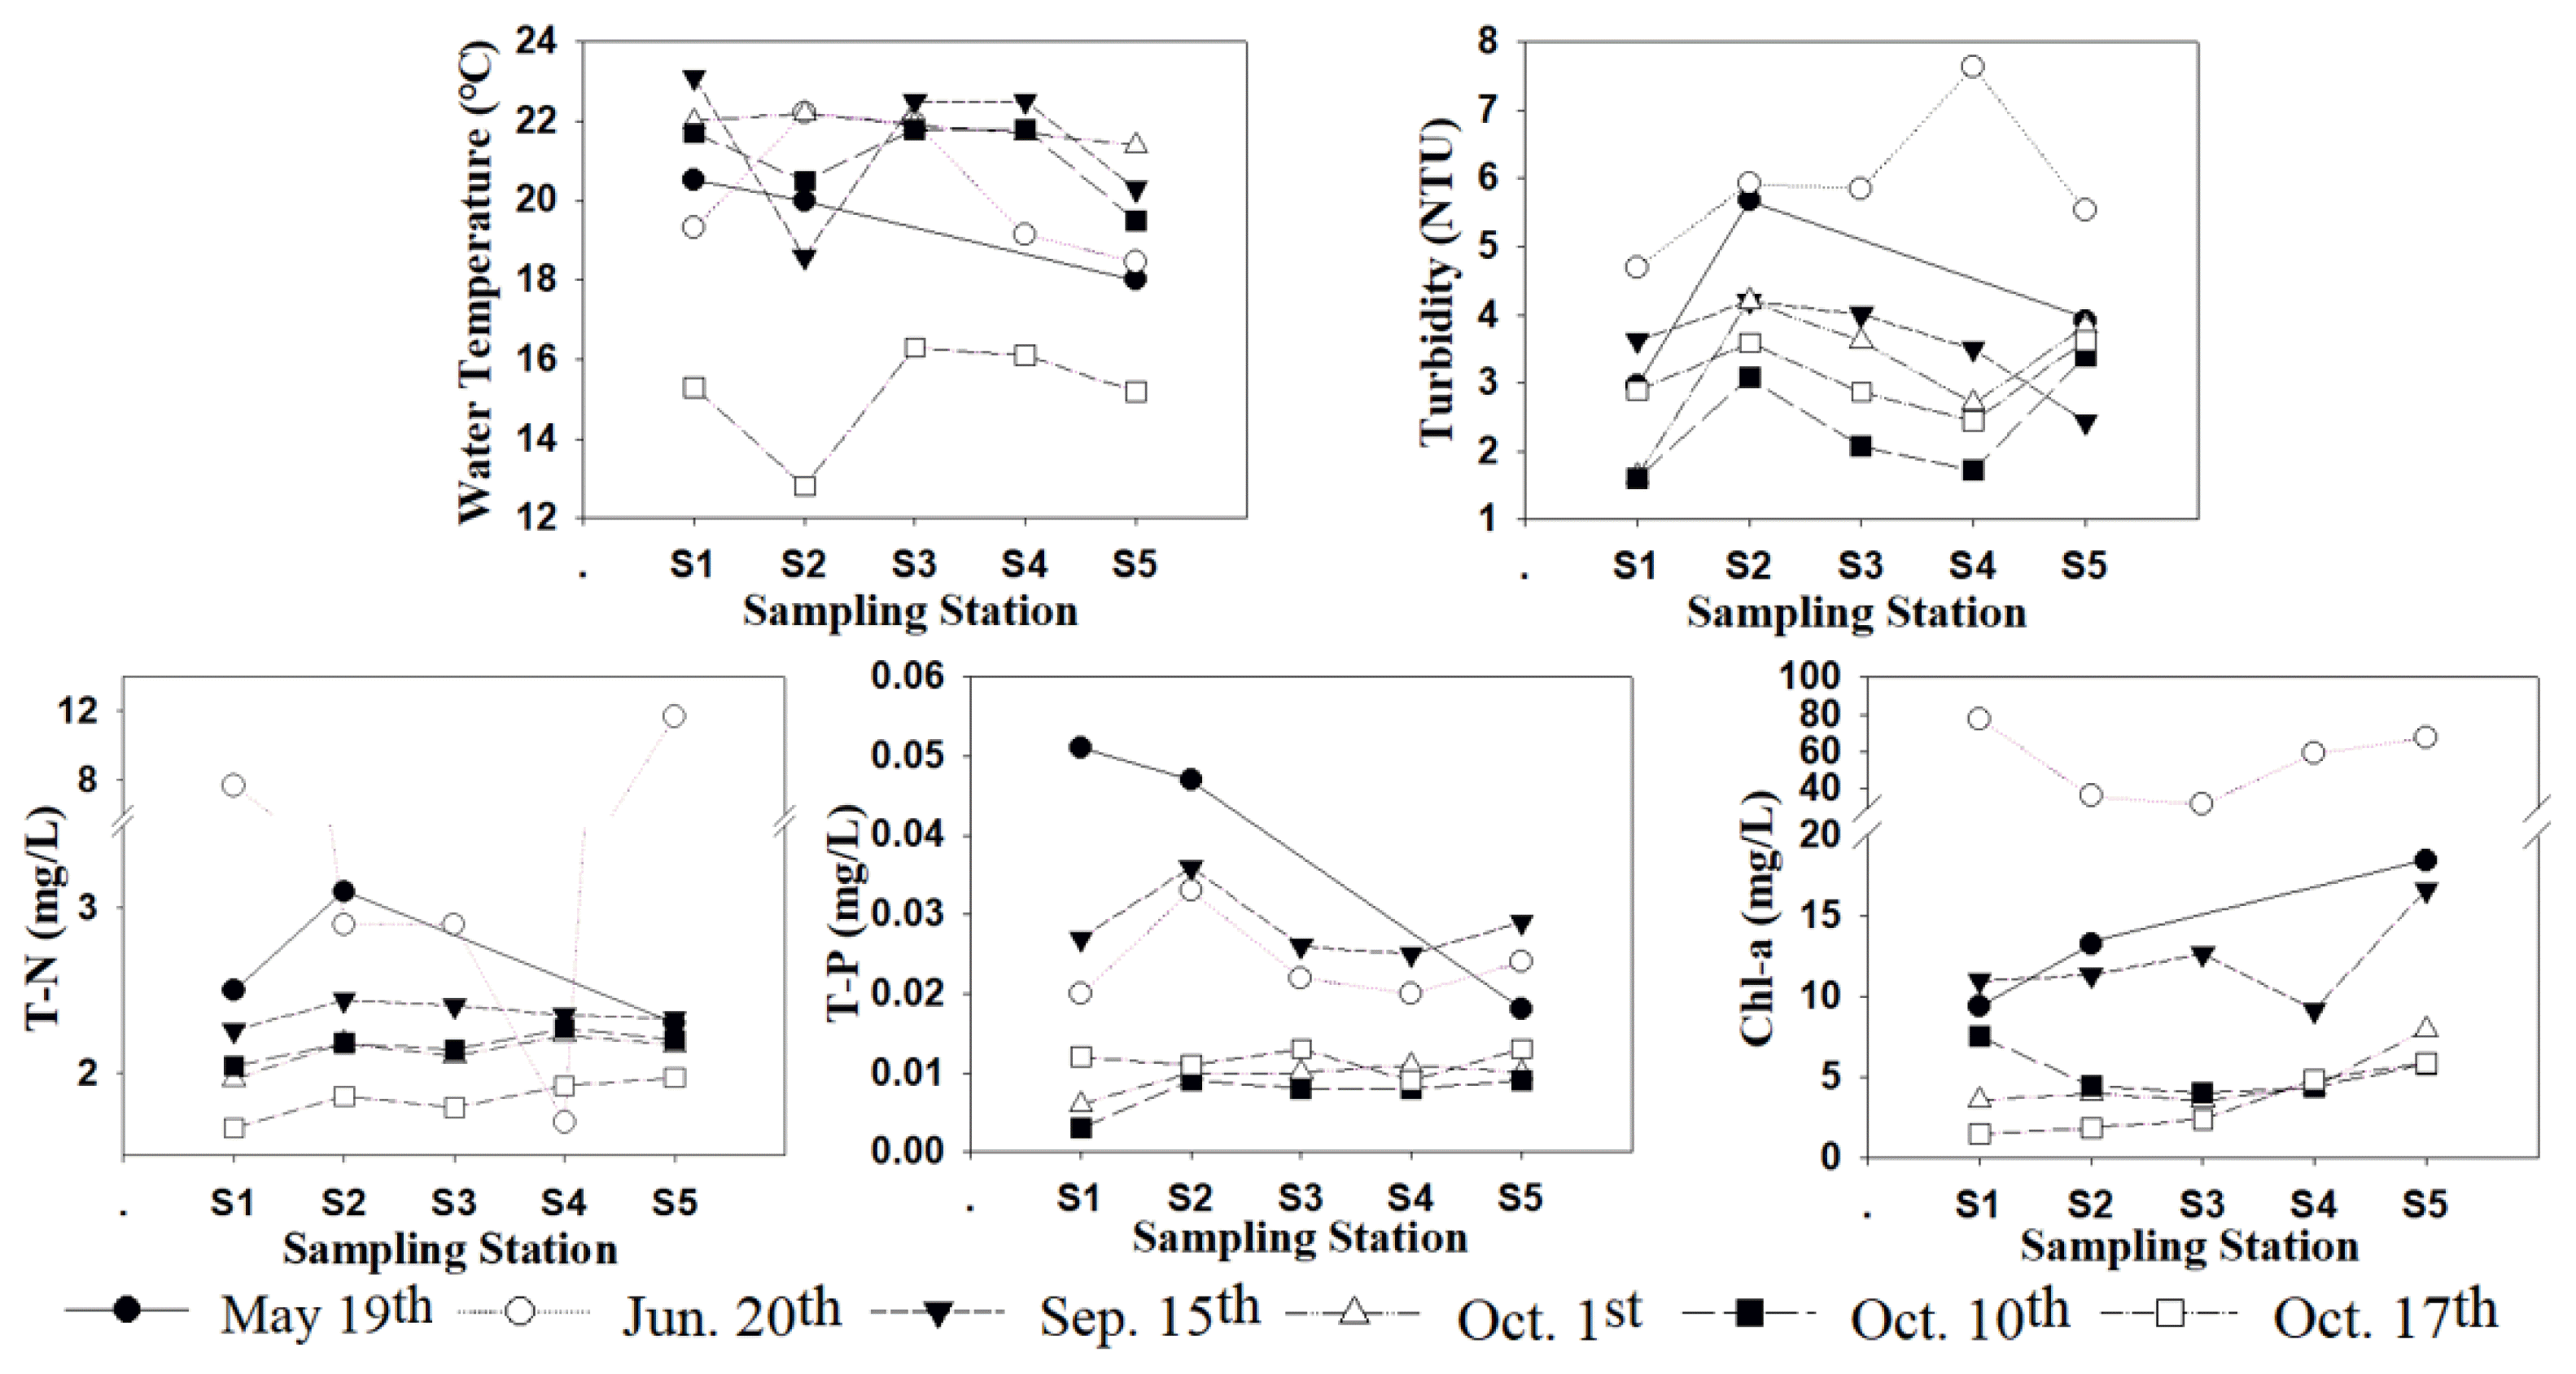
The highest values of water quality factors - water temperature, turbidity, T-N, T-P, and Chl-a - during the study period were 23.1 °C at S1 on Sep. 15th, 7.63 NTU at S4 on Jun. 20th, 11.7 mg/L at S5 on Jun. 20th, 0.05 mg/L at S1 on May 19th and 77.65 mg/L at the S1 point on Jun. 20th, respectably. The lowest concentrations of those factors were 12.8 °C at S2 on Oct. 17th, 1.61 NTU at S1 on Oct. 10th, 1.67 mg/L at S1 on Oct. 17th, 0.003 mg/L at S1 on Oct. 10th, 1.48 mg/L at S1 on Oct. 17th, respectably. Any factor did not show consistently high concentrations at a specific date or point.
Fig. 4 shows changes in water quality at each point during the study period. Unlike air temperatures were between 24 °C and 25 °C for other days, the air temperature for the day of October 17th dropped to 9.3 °C and the water temperature of the day also decreased about 5 °C. Overall, water quality factors show high levels during Jun. and Jul. which months are the part of rainy season in Korea.
3.2. Simulations for Each Water Quality Factor Using Satellite Data
The regression equation was calculated by combining selected band data of Landsat 8 which highly correlated with the observation data for water quality factors throughout the correlation analysis. The RMSE was used to check the performance of estimations from the regression analysis.
3.2.1. Relationships between each band and water quality factors
Table S7 shows Pearson’s correlation coefficients among water quality factors and reflectance values of Band 2 to Band 7 from Landsat 8. The turbidity showed good relationships with reflectance values of Band 2, Band 3, and Band 4, which are RGB (Red, Green, Blue) in the previous study [11]. The turbidity in this study, however, showed good relationships with reflectance values of Band 6 and Band 7 and the result indicated that the turbidity of the Kumho River reacted more sensitively in the short-wave infrared region (1.566~1.651 μm) than in the RGB region (0.452~0.673 μm).
T-N concentrations were highly correlated all bands with a correlation coefficient value of 0.75 or higher within the significance level of 0.01. Among them, Band 3 had the highest value at 0.809, followed by Band 2 and Band 5 at 0.806. Lim et al. [10] reported that T-P concentrations of the Geum River were highly correlated to the red and green regions (0.45–0.52 μm). T-P concentrations for the Kumho River, however, showed low correlations with all bands unlike other water quality factors had good relationships with all bands. The wide range of T-P concentrations for the Kumho River, Max/Min = 17, is the reason why T-P concentration for the study area showed such low relationship with all bands since max-min ratios of all bands are between 1.06 and 1.20. In addition, T-P concentrations are the one of non-optical properties, so correlations with optical bands may be somewhat lower. Various combinations, therefore, of each band were considered, not limited to the optimal band, in derivation of the regression equation since the value of the correlation coefficient was remarkably low.
The Chl-a concentration also showed a high correlation with all bands just like T-N did. In a previous study, correlation analysis for Chl-a was performed from Band 1 to Band 8 and the correlation coefficient with Band 1 & Band 3 were 0.475 & 0.421, respectably [6]. In this study, Chl-a showed the highest correlation with Band 6 - correlation coefficient 0.889 - and also with Band 5 & Band 7, 0.886 & 0.883, respectably. Regression equations, therefore, were derived based on the combination of bands as well as Band 6.
3.2.2. Calibration for regression equations with satellite data to simulate water quality factors
Regression equations for water quality factors - turbidity, T-N, T-P and Chl-a, were derived by using combinations of each band after reducing collinearity that may occur among independent variables since correlation coefficient values between the bands are all 0.9 or higher as shown in the table S7.
Table 1 shows regression equations for estimating water quality factors for Kumho River using combinations of reflectance values of each band and Fig. 5 illustrates calibration results of the selected regression equations. The regression equation with Band 4, Band 5, and Band 7 were selected for the turbidity since the equation had the highest correlation coefficient, 0.797. To check the accuracy of simulations using the selected regression equation, the RMSE value was calculated and as shown in Fig. 5 (a). The RMSE for simulations of turbidity was 0.857 NTU, significantly low compared to the observations, 2~5 NTU.
The regression equation for T-N was induced using Band 2, Band 3, and Band 5 since those three bands were highly related to T-N concentrations as shown in the table S7. The regression equation with Band 2 and Band 5 - correlation coefficient 0.877 - was selected to simulate T-N concentrations. Although the equation using Band 3 showed the highest correlation coefficient for T-N simulations, the equation with Band 3 was excluded since collinearity of each band for the equation were higher than 10. The RMSE of the selected equation for T-N was 0.992 mg/L, observations 1.7~11.7 mg/L, as shown in Fig. 5 (b).
T-P concentrations showed significantly lower relationships with each band compared to other water quality factors, so various combinations of bands were considered without being limited to the optimal band to derive the regression equation for T-P concentrations. The regression equation for T-P concentrations applied to all bands except Band 3 was the highest R value, 0.804. The equation for T-P concentrations showed reliable simulation results, R = 0.804 & RMSE = 0.0073 mg/L.
Collinearity increased with the increase of R value during multiple regression analysis with each band for Chl-a concentrations. Especially, collinearity between Band 6 and Band 7 was 0.998, so both bands was not considered simultaneously when combinations of each band were built for the regression analysis. As results, the regression equation using Band 6 was selected and showed the best results for simulating Chl-a concentrations, R = 0.889 & RMSE = 9.161 mg/L. The error value of calibrations for Chl-a concentrations was relatively high because of high levels of Chl-a concentrations.
In other words, the Chl-a concentration was observed in the range of 0–80 mg/L and most values were concentrated in 0–20 mg/L. All values above 40 mg/L were measured on June 20 and calibrations for these values showed underestimations. The performance of the model could be improved if more observation data of high Chl-a concentrations were added in the future.
3.2.3. Validation for regression equations with satellite data to simulate water quality factors
Fig. 6 shows the results of validation processes for regression equations for each water quality factor with new water quality data obtained from water environment information system operated by Korea Ministry of Environment [15]. Validation processes for simulating water quality factors showed even better results than calibration process did except simulating T-N concentrations (R value for turbidity 0.933, for T-N 0.663, for T-P 0.845 and for Chl-a 0.931). The RMSE values from results of simulation for validation process were also low (RMSE for turbidity 0.467 NTU, for T-N 0.308 mg/L, for T-P 0.0091 mg/L and for Chl-a 8.682 mg/L). The outlier (the one in red circle of Fig. 6 (b)) may be the reason for relatively low performance for validation process of T-N concentrations, but validation results for T-N were not totally poor since R value was 0.663. The validation process, overall, of the regression equations with satellite data for estimating water quality factor were reliable.
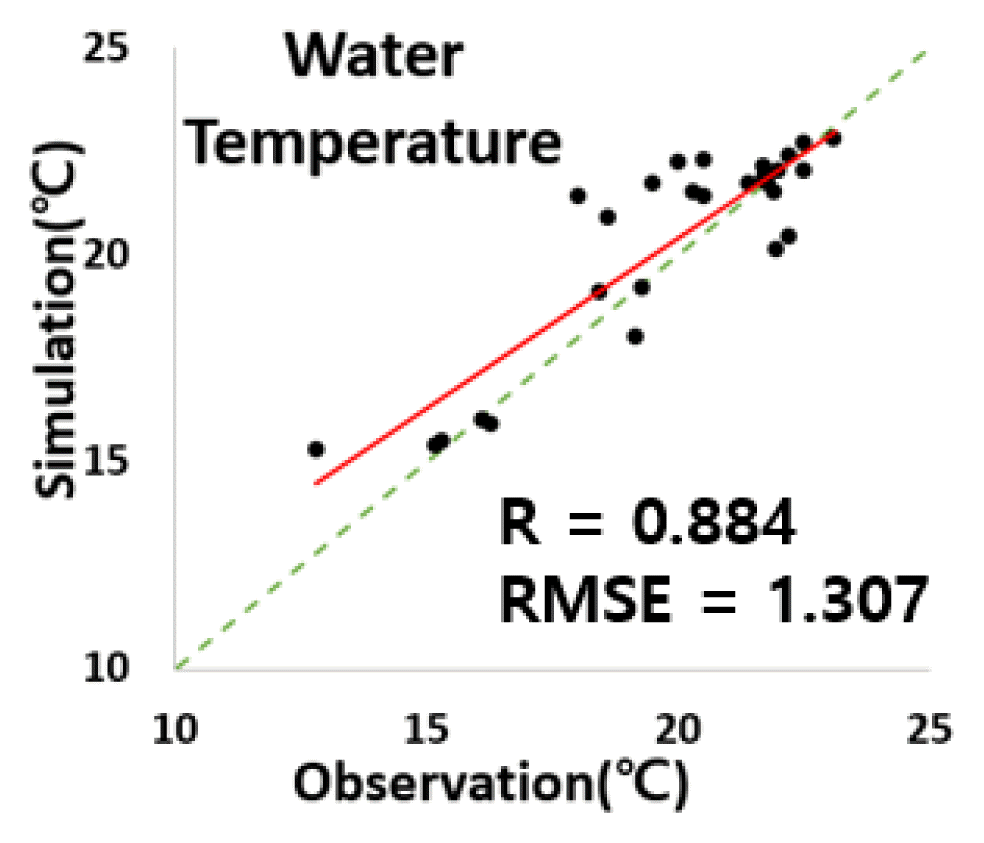
3.2.4. Simulations for water temperature using satellite image
Fig. 7 shows simulation results for water temperature and as shown in the figure, the correlation coefficient of the equation is 0.884 and the RMSE is 1.306 °C, which shows high precision considering that the average water temperature value is 19.88 °C. The equation for water temperature is commonly used regardless of location (Eq. 4) and is well suited in this study area as well.
4. Conclusions
In this study, water quality factors (water temperature, turbidity, T-P, T-N, Chl-a) in the downstream of the Kumho River were simulated through multiple regression analysis using remote sensing data of the Landsat 8 satellite. The approach for simulating water quality factors in Kumho River using Landsat 8 satellite data showed reliable results since the R values of turbidity, T-N, T-P, and Chl-a were 0.797, 0.877, 0.804, and 0.889, respectively, within the significance level (p) 0.01 for the calibration processes and those were 0.933, 0.663, 0.845 and 0.931 within the significance level (p) of 0.01, respectively, for the validation processes. The water temperature calculation using Band 10 of the TIRS sensor of the Landsat 8 satellite also showed stable results with an R value of 0.884 and an RMSE of 1.306 °C.
Overall, the approach for estimating water quality factors using satellite data was reliable, so water quality prediction using satellite data is considered to be a very useful method for water quality management of the Kumho River. Current water quality monitoring relies on in-situ sampling of on-site samples. Such a water quality monitoring system makes it difficult to observe the status of water quality in short periods of time since agencies which manage natural water systems have to monitor the water quality for many points. In fact, in Korea, the sampling cycle for each sampling is from one week to several months. Moreover, checking the status of water quality in timely manner is almost impossible because water sample analysis takes time, from few hours to days. In this respect, water quality monitoring system with remote sensing data, in this study satellite data, could be able to complement the current water quality monitoring system.
In addition, the current water quality monitoring system provides information on the point where the water sample was collected, but monitoring system with remote sensing could provide information on a wide area of waterbodies. This system makes it possible to observe the water quality of areas which physically difficult to access. As a result, the monitoring system using satellite data is expected to support the water quality monitoring system for the Kumho River.