1. Introduction
In recent years, the extensive use of antibiotics has enhanced microbial resistance in the environment, which has induced antibiotic-resistant bacteria (ARB) and antibiotic resistance genes (ARGs). ARGs enter the sewage pipeline, wastewater treatment plants (WWTPs) and surrounding rivers, which allows ARGs to enter the drinking water system through raw water [1–4]. The treatment processes in drinking water treatment plants (WTPs) cannot completely remove the ARGs in source water [5–7]. Mobile genetic elements (MGEs) such as integrons and transposons in bacteria can facilitate the activities of horizontal gene transfer (HGT) of ARGs in water [8], resulting in the spread of ARGs in drinking water systems. In drinking water distribution systems (DWDSs), a small number of microorganisms attach to the pipe wall and contribute to the formation of multi-species biofilms, and ARGs can be transferred horizontally by different bacteria in these biofilms. In addition, ARGs and MGEs in DWDSs interact with human intestinal flora after entering the human body and spread ARGs to bacteria inside the human body [9,10], which is potentially harmful to human health.
In addition, chlorinated disinfectants usually added in WTPs also affect ARB growth and ARGs distribution in DSWSs. It was reported that chlorination leads to enrichment of ARB and proliferation of ARGs, and induces the emergence of Pseudomonas alcaligenes, which carries multiple ARGs [11]. Xu et al. reported that the absolute concentration of ARGs decreased after chlorination, but their relative abundance increased significantly [12]. Guo et al. found that chlorination significantly increased the relative abundance of all ARGs in WTPs [13]. Shi et al. found that chlorination led to the enrichment of seven ARGs (ampC, aphA2, blaTEM-1, tetA, tetG, ermA and ermB), and metagenomic analysis confirmed that various MGEs, as well as plasmids, insertion sequences and integrons involved in HGT were all enriched after chlorination [14]. Hu et al. found that chlorination significantly enriched ARGs (sul2, qnrB, ermB, ermC, etc) in WWTPs, but the intI-1 was removed by 1.9 log [15]. The effect of chlorination on microbial resistance in drinking water confirmed that chlorination could not only concentrate ARGs but also increase the diversity of ARGs, which was due to the change in microbial community and the enrichment of MGEs caused by chlorination [14].
Furthermore, disinfection by-products (DBPs) produced by chemical reactions between residual chlorine and precursors of DBPs could be one of the most important environmental stressors for ARGs and MGEs in biofilms and effluents in DSWSs. For example, it was reported that various DBPs contribute to the change in ARGs abundance [16–18]. Matter and drinking water containing DBPs are mutagenic, as shown by the Ames tests and mutagenicity tests [19,20], and chromosomal mutations are the basic mechanism for producing ARB [21]. In DBPs generated after chlorination disinfection of drinking water, trihalomethanes (THMs) and haloacetic acids (HAAs) are the major group of DBPs, and the concentration is usually around half the concentrations of THMs [22]. Besides, these two DBPs have been regulated in water quality standards in WTO and many countries, such as USA, EU and Canada. Moreover, THMs and HAAs have been shown to induce multidrug resistance in bacteria and stimulate conjugative transfer of ARGs [23,24]. Thus, THMs and HAAs were selected to investigate the effect of DBPS on ARGs in this study.
To date, the influence of the two typical DBPs in drinking water, THMs and HAAs, on the influence of ARGs and MGEs in the biofilm phase and water phase of DWDSs is still unclear. In this study, microbial indices, THMs, HAAs, ARGs, and MGEs were detected in biofilms and effluents of a simulated DWDS reactor during 150 d of operation, and their relationships were investigated, with the aim of determining the influence of DBPs on the production, amplification and HGT of ARGs in DWDSs.
2. Materials and Methods
2.1. Simulated DWDS Reactor
A Center for Disease Control and Prevention (CDC) biofilm reactor was used to simulate an actual DWDS. This reactor has the characteristics of a stable water outlet and uniform shear force, which can better simulate the hydraulic conditions of the actual DWDS [25,26]. In the experiment, the rotational speed was set to 200–300 rpm, ensuring uniform shear force and stable hydraulic conditions in the reactor. During the operation process, the reactor ran steadily for 60 days, after which water and biofilm samples were obtained and measured every 30 days, up to 150 days.
During continuous operation, the CDC reactor was fed tap water from the city of Beijing, China, and the main quality parameters of the influent were as follows: turbidity: 0.10–0.28 NTU, pH value: 7.5–7.8, total hardness: 117–126 mg/L, total dissolved solids: 135–158 mg/L, sulfate: 36–42 mg/L, chloride: 0.52 mg/L, fluoride: 0.22–0.24 mg/L, and nitrate nitrogen: 1.0–1.3 mg/L.
2.2. Sampling of the Water Phase and Biofilm Phase
Samples of the biofilm phase and water phase (influent, effluent) from the CDC reactor were collected separately. For the water-phase samples, 10 L of influent or effluent were collected and filtered through a 0.22-μm polyether sulfone membrane filter (GPWP, Millipore), respectively. The membrane was clamped with alcohol sterilizing clamps and folded in half, then placed in a 50 mL centrifuge tube at −20°C. When extracting total DNA, the filter was thawed first. The filter membrane was then taken out on a clean bench and placed into a disposable sterile Petri dish. The microflora on the filter membrane were scraped off with a scraper, and 10 mL sterile PBS solution was added for elution of the microflora on the surface of the scraper and the filter membrane, and the eluted solution was collected into a 50 mL centrifuge tube. For the biofilm-phase samples, six coupons from the CDC reactor were obtained and placed in one 50 mL centrifuge tube with 15 mL sterile PBS solution. The mixture was vortexed (2 min) and ultrasonicated (40 kHz, 500 W, 5 min). The procedure was repeated three times, and the coupons were removed. The centrifuge tube containing the suspension was placed in a centrifuge (10000x g, 10 min) and the supernatant was discarded. The remaining precipitate in the centrifuge tube was used for the extraction of total DNA.
2.3. Microorganism Indices
Heterotrophic bacterial plate count (HPC) analysis was carried out using the spread plate method with R2A agar, and cultured in a constant temperature incubator at 22°C for 7 d. For the water phase samples, 1 mL of the influent or effluent sample from the reactor was obtained for HPC determination. For the biofilm-phase samples, 100 μL bacterial suspension was determined. HPC was reported as colony-forming units (CFU)/mL.
The total cell count (TCC) was detected by multidimensional high-resolution flow cytometry (LSRFortessa, BD Biosciences, Franklin Lakes, NJ, USA). A total of 100 μL of the water phase (influent, effluent) or biofilm phase samples were placed in 96-well plates, and 1 μL SYBR green fluorescent dye (100 × diluted 10000 × dye concentrate) was added to each well. The plate was covered with aluminum foil and incubated at 25°C for 20 min. After incubation, the samples were collected for analysis at the wavelength of 488 nm, and sterile water was used as the blank control. Five parallel samples were used for each sample.
2.4. Detection of DBPs
THMs and HAAs were analyzed according to the modified methods, EPA551.1 and EPA552.2 [27], respectively. Two types of standards consisting of four mixed standard solutions for THM (EPA 501/601) and nine mixed standard solutions for HAA (EPA 552.2), respectively, were obtained from Supelco (USA). Methyl tert-butyl ether was purchased from J.T. Baker (USA). THM4 was extracted from the water samples by methyl tert-butyl ether (MTBE). HAA9 was recovered by liquid/liquid extraction with MTBE, followed by methylation with acidic methanol. The DBP concentration was monitored by a gas chromatograph equipped with an electron capture detector (GC-ECD, Agilent, USA), a J & W HP-5 fused silica capillary column (30 m × 0.25 mm ID with 0.25 μm film thickness, Agilent, USA) was used with the system. For THM4 analysis, the GC program was an initial temperature of 30°C, holding time of 3 min, rising to 60°C at 2.5°C / min, and a holding time of 5 min. For HAA9 analysis, the initial temperature was 40°C for 5 min, and increased at 2.5°C / min to 65°C, 10°C / min to 85°C, and 20°C / min to 205°C, and held for 5 min.
2.5. DNA Extraction and High-throughput Quantitative PCR
After pretreatment of biofilm-phase samples and effluents, the FastDNA® Spin Kit for Soil (MP Biomedical, USA) was used to extract the total DNA. High-throughput qPCR reactions were performed using the ABI VIIA@7 (Wcgene, Shanghai, China) qPCR system. According to the research on ARGs in the references and the research on ARGs in drinking water in China, there were altogether 200 primer sets targeting 186 subtypes of selective ARGs, 11 subtypes of transposases, two subtypes of class 1 integrons and the 16S rRNA gene [28,29]. The 186 subtypes of selective ARGs involved eight categories of antibiotics conferring resistance to aminoglycosides, β-lactams, FCA, MLSB, sulfonamide, tetracycline, vancomycin and other/efflux. The 186 ARGs detected in this study were classified into eight categories (aminoglycosides, β-lactams, FCA, MLSB, sulfonamide, tetracycline, vancomycin and other/efflux) according to the antibiotics to which they conferred resistance. The Roche PCR kit was used for qPCR. The system consisted of 10 μL Roche FastStart Universal SYBR Green Master (ROX), 0.75 μL forward primer F, 0.75 μL reverse primer R, 0.5 μL target DNA and 3 μL ddH2O.
The thermal cycle was as follows: initial denaturation at 95°C for 10 min, denaturation at 95°C for 30 s, annealing and extension at 60°C for 30 s, with 40 cycles in total. The melting curve was analyzed automatically by the program. According to the detection limit and sensitivity of the ABI VIIA@7, the Ct value of 40 was determined as the detection threshold of the instrument. When the Ct value was > 40, the corresponding Ct value was replaced by 40. The relative abundance of ARGs was calculated by the following formula.
Ct refers to the cycle threshold detected by high-throughput fluorescence quantification, 16S refers to the 16S rRNA gene of the sample, and ARGs refers to the resistance gene to be determined.
3. Results and Discussion
3.1. Microorganism Indices
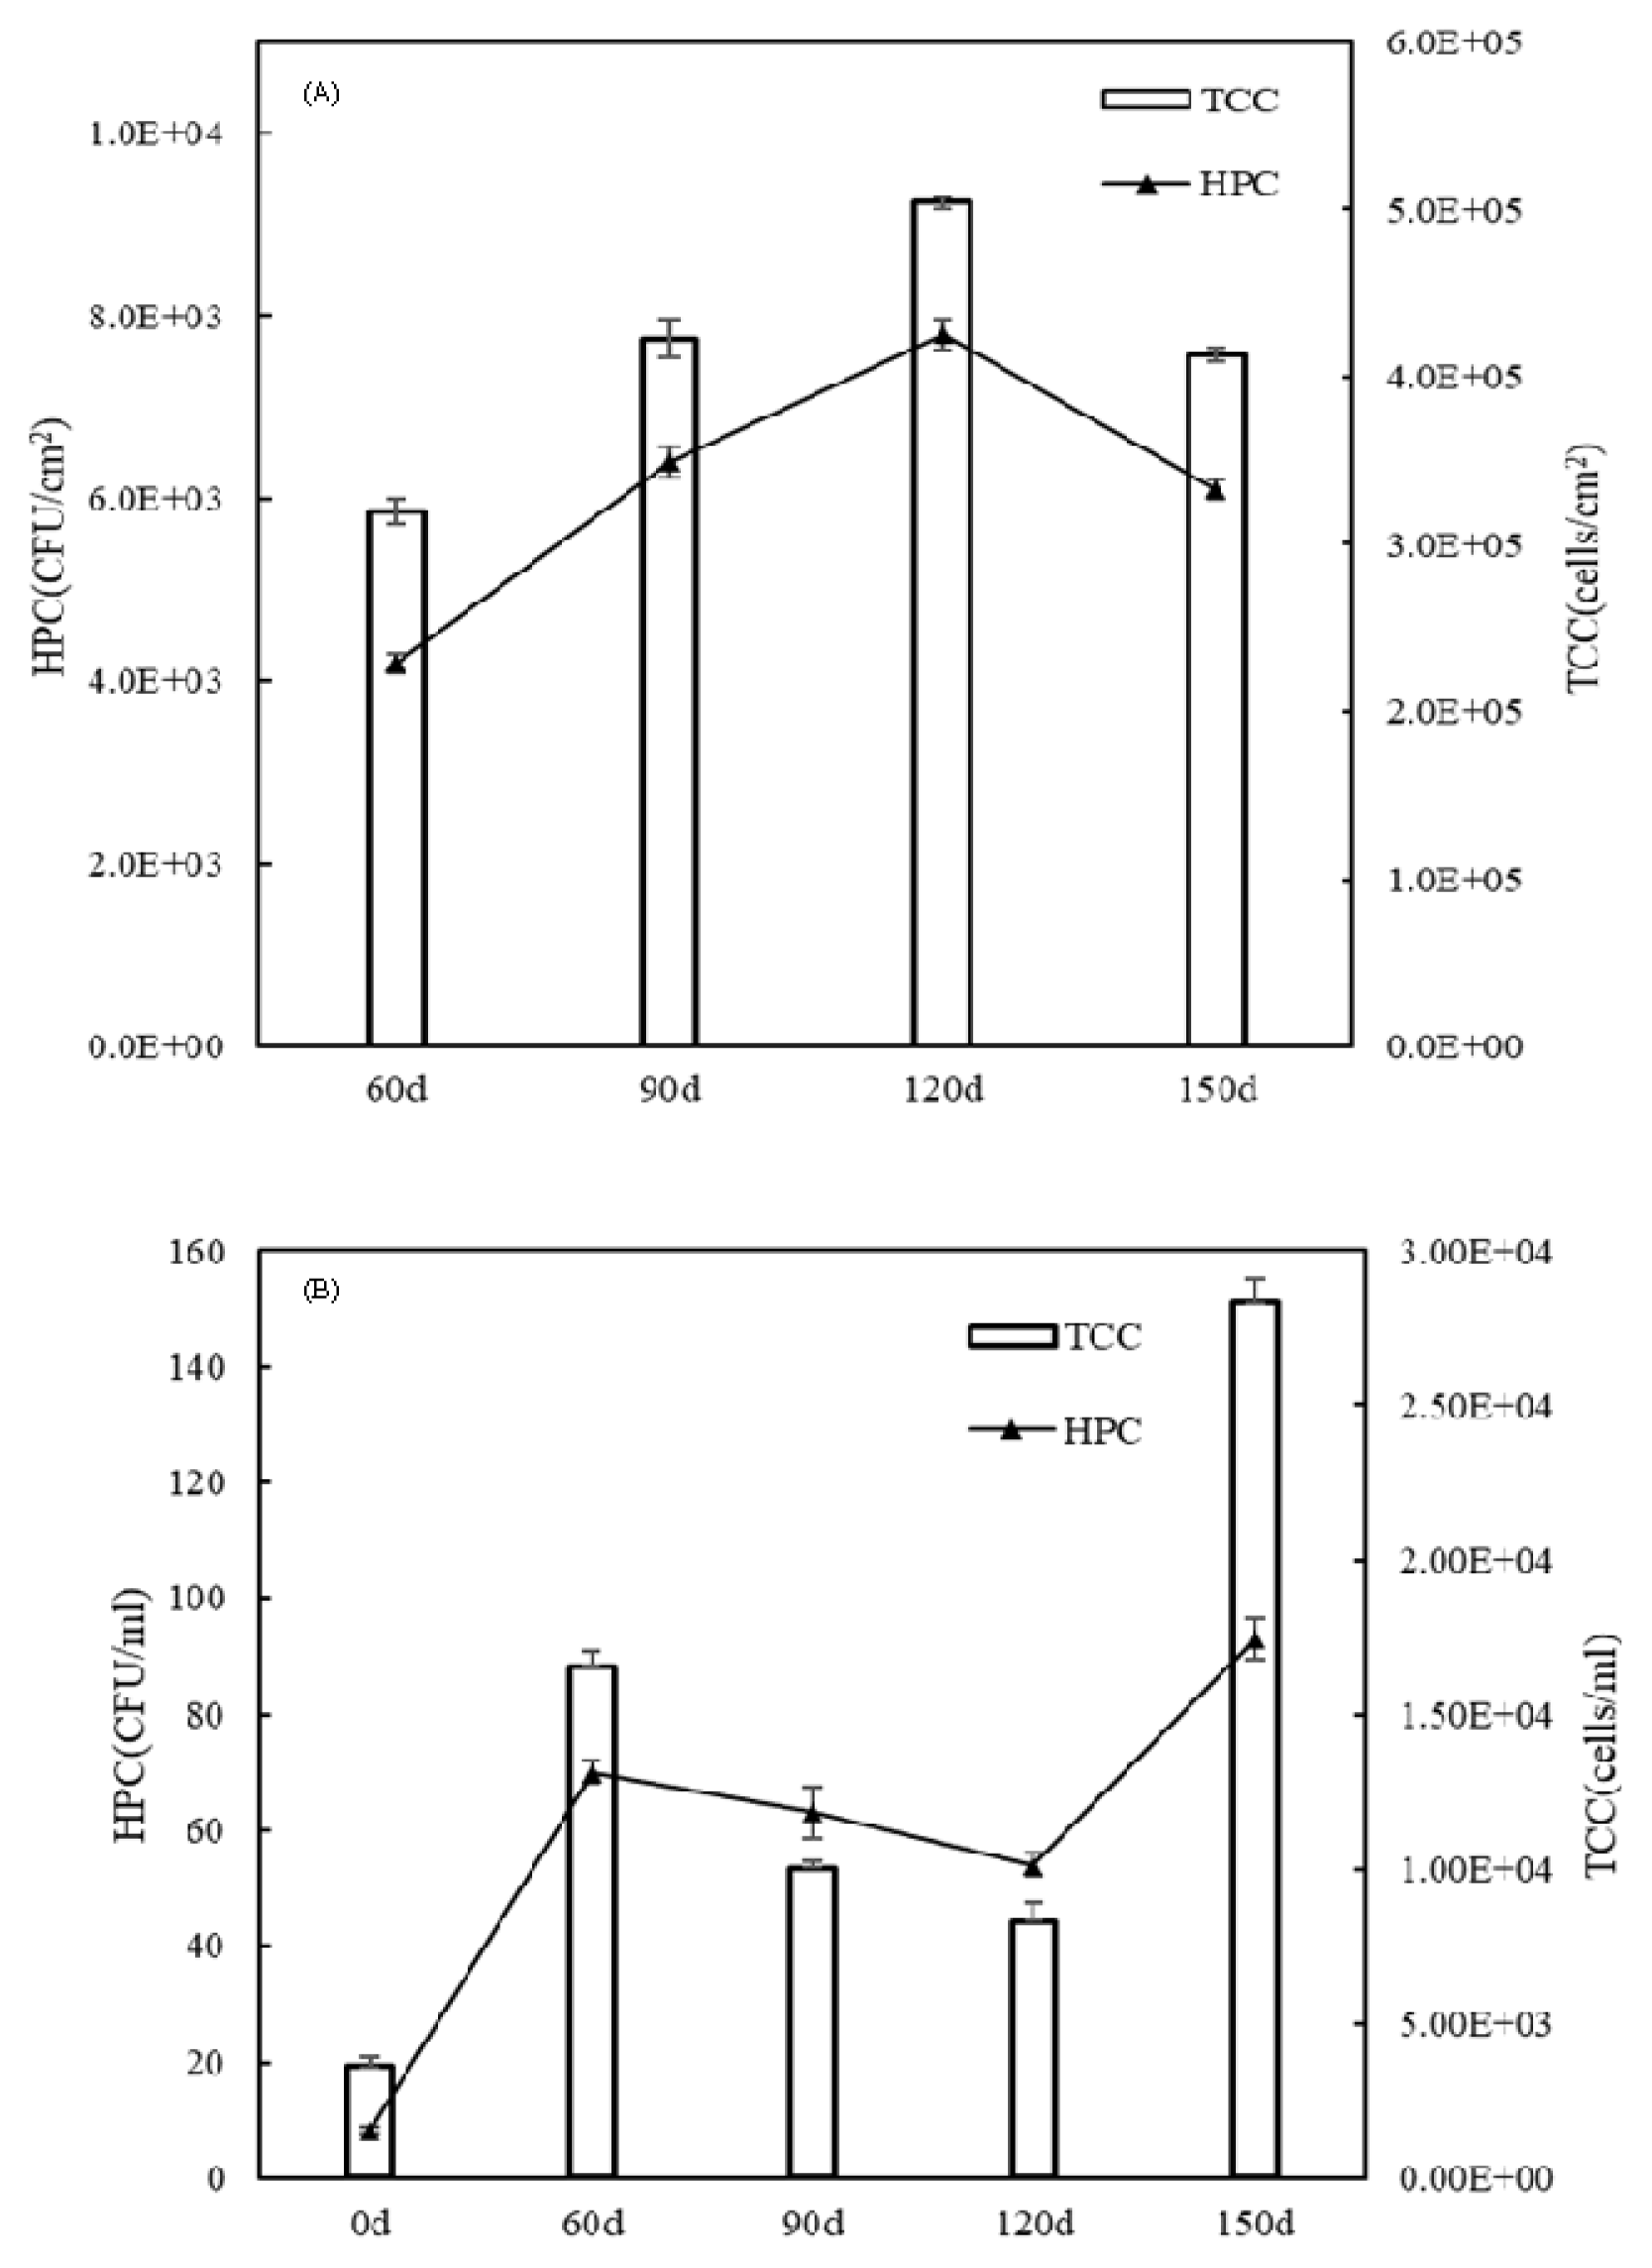
HPC represents the total number of cultivable heterotrophic bacteria, and TCC signifies the total number of bacteria that can be stained by SYBR green, which includes both dead and live cells. As shown in Fig. 1A, at 60 d, HPC and TCC in the biofilms were detected which demonstrated that the loose biofilm involved bacterial attachments, micro-colonies, and an early biofilm had begun growing on the coupons during 0–60 d of the early biofilm period. HPC and TCC in biofilms significantly increased at 90 d (P < 0.01) and 120 d (P < 0.01) compared with those at 60 d, which demonstrated that biofilms grew rapidly and became denser during 60–120 d of the mature biofilm period. The dense and mature biofilms absorb more and more nutrients from the water, which provides a safe and stable growth place for bacteria in simulated DSWSs. In particular, at 120 d, the highest HPC and TCC (7.80 × 10³ CFU/cm2 and 5.04 × 10⁵ cells/cm2, respectively) were detected in the biofilms (Fig. 1A). However, at 150 d, HPC and TCC in the biofilms decreased significantly, from 7.80 × 10³ CFU/cm2 and 5.04 × 10⁵ cells/cm2 at 120 d to 6.10 × 10³ CFU/cm2 (P < 0.01) and 4.13 × 10⁵ cells/cm2 (P < 0.01), respectively, which was due to the naked bacteria in biofilms exposed to the water after the shedding of aged biofilms.
As shown in Fig. 1B, in the effluents, HPC increased significantly from 8.25 CFU/mL at 0 d to 70 CFU/mL at 60 d (P < 0.01), and TCC increased significantly from 3.6 × 10³ cells/mL at 0 d to 1.65 × 10⁴ cells/mL (P < 0.01) at 60 d. Compared with 0 d, the increase in HPC and TCC in effluents at 60 d was caused by loose and thin biofilms on the coupons during 0–60 d of the early biofilm period. However, at 90 d, HPC and TCC in effluents gradually decreased to 63 CFU/mL and 1.00 × 10⁴ cells/mL, compared with those at 60 d (70 CFU/mL and 1.65 × 10⁴ cells/mL, respectively), and these differences were statistically significant (P < 0.05). However, at 120 d, the lowest HPC and TCC in effluents were observed (54 CFU/mL and 8.3 × 10³ cells/mL, respectively). This was shown in the above results, where the changes in HPC and TCC in the biofilms and effluents were opposite from 60–120 d during the mature biofilm period. Bacteria in the reactor influents accumulated in the dense and mature biofilms, which led to a sharp decrease in HPC and TCC in effluents at 90 d and 120 d. However, HPC and TCC in effluents at 150 d increased significantly to 93 CFU/mL (P < 0.01) and 2.83 × 10⁴ cells/mL (P < 0.01), respectively. Within 120–150 d during the aging biofilm period, the bacteria in the outer layer of the hanging aged biofilm were scattered into the water due to the sudden change in hydraulic conditions, which caused a decrease in the amount of bacteria in the biofilms (Fig. 1A), and increased the amount of bacteria in effluents at 150 d (Fig. 1B).
3.2. Concentration of DBPs in Effluents
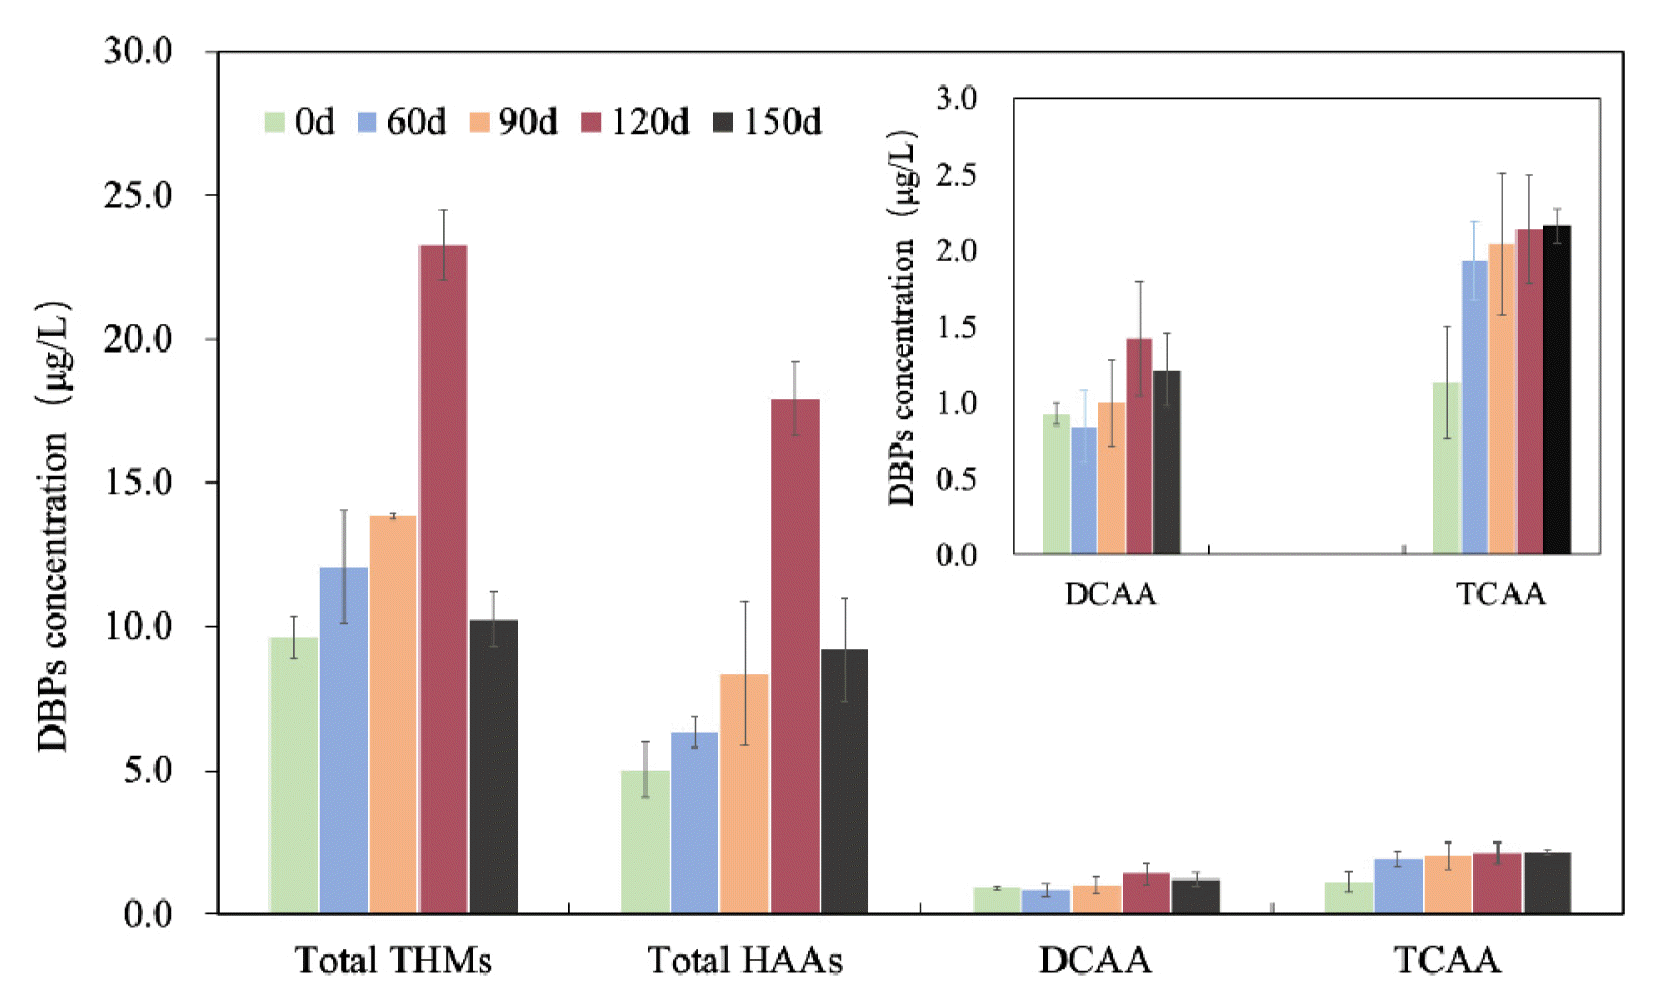
As shown in Fig. 2, the concentrations of total THM4 and total HAA9 in effluents increased from 0 d to 120 d, and decreased at 150 d. At 0 d, the concentrations of total THM4 and total HAA9 in effluents were 9.66 μg/L and 5.03 μg/L, respectively. At 120 d, the concentrations of total THM4 and total HAA9 were at their highest values (23.28 μg/L and 17.93 μg/L, respectively) during the entire operation cycle. These improvements in DBPs concentrations were caused by the early-to-mature biofilm formation during 0–120 d which released more precursors of DBPs into the water. However, at 150 d, the concentrations of total THM4 and total HAA9 in effluents reduced to 10.26 μg/L and 9.20 μg/L, respectively, which was caused by fewer precursors of DBPs released into the water from the biofilm with naked bacteria exposed to the water after the shedding of aged biofilms.
In addition, it was reported that HAAs can be biodegraded due to an increase in microorganisms in water [30]. For example, Bayless et al. used a column packed with glass beads to grow the biofilm, and found that the biofilm had a good degradation effect on six HAAs in the water [31]. Dichloroacetic acid (DCAA) is easily biodegraded. It was reported that with the increase in pipe distance and residence time, the residual chlorine in water gradually decays, its inhibitory effect on bacterial activity gradually weakens, and DCAA in the pipe is subsequently biodegraded by bacteria [30]. Furthermore, THMs and trichloroacetic acid (TCAA) in the pipe are gradually stabilized for a long period of time as they are not affected by bacterial activity in the water [32]. As shown in Fig. 2, at 150 d, a small reduction in DCAA and a little improvement in TCAA were detected; this demonstrated that little degradation of HAAs occurred during the operation cycle. Hence, the main factor in the sharp reduction in HAAs at 150 d was the fewer number of HAAs precursors in the water after the shedding of aged biofilms on the coupons, and not the biodegradation of HAAs.
3.3. Distribution of ARGs in the Biofilm Phase and Effluents
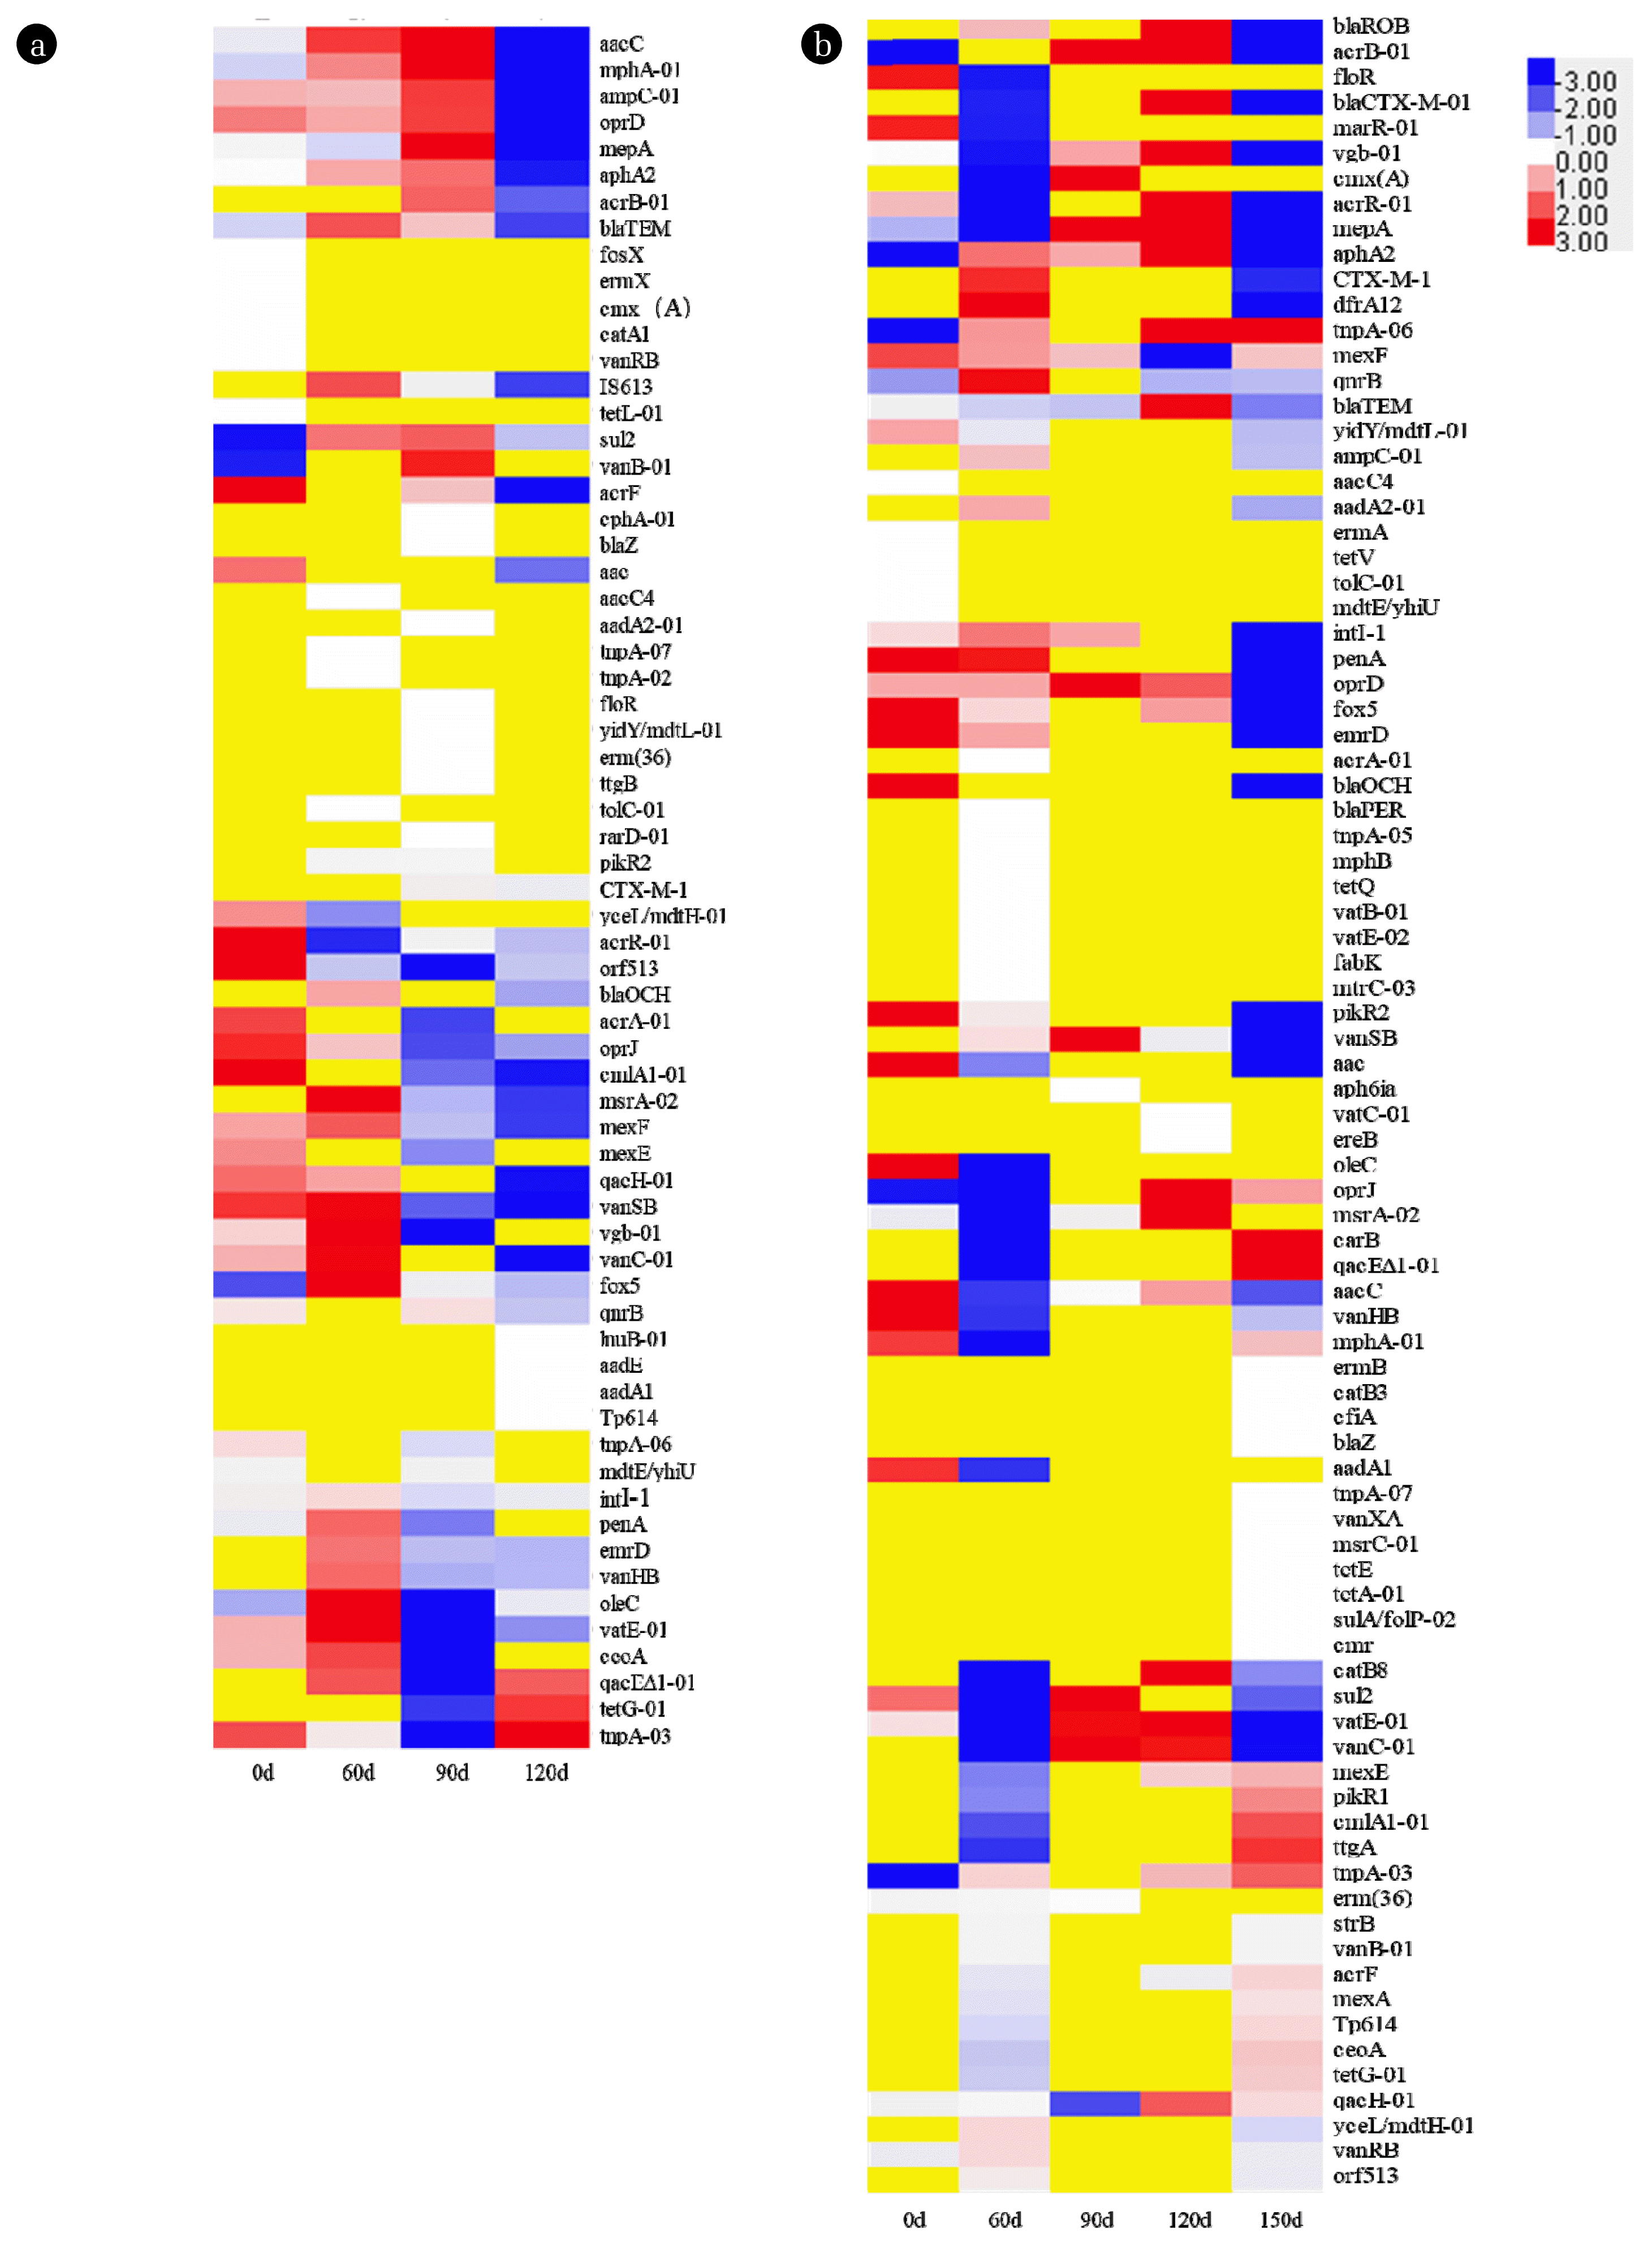
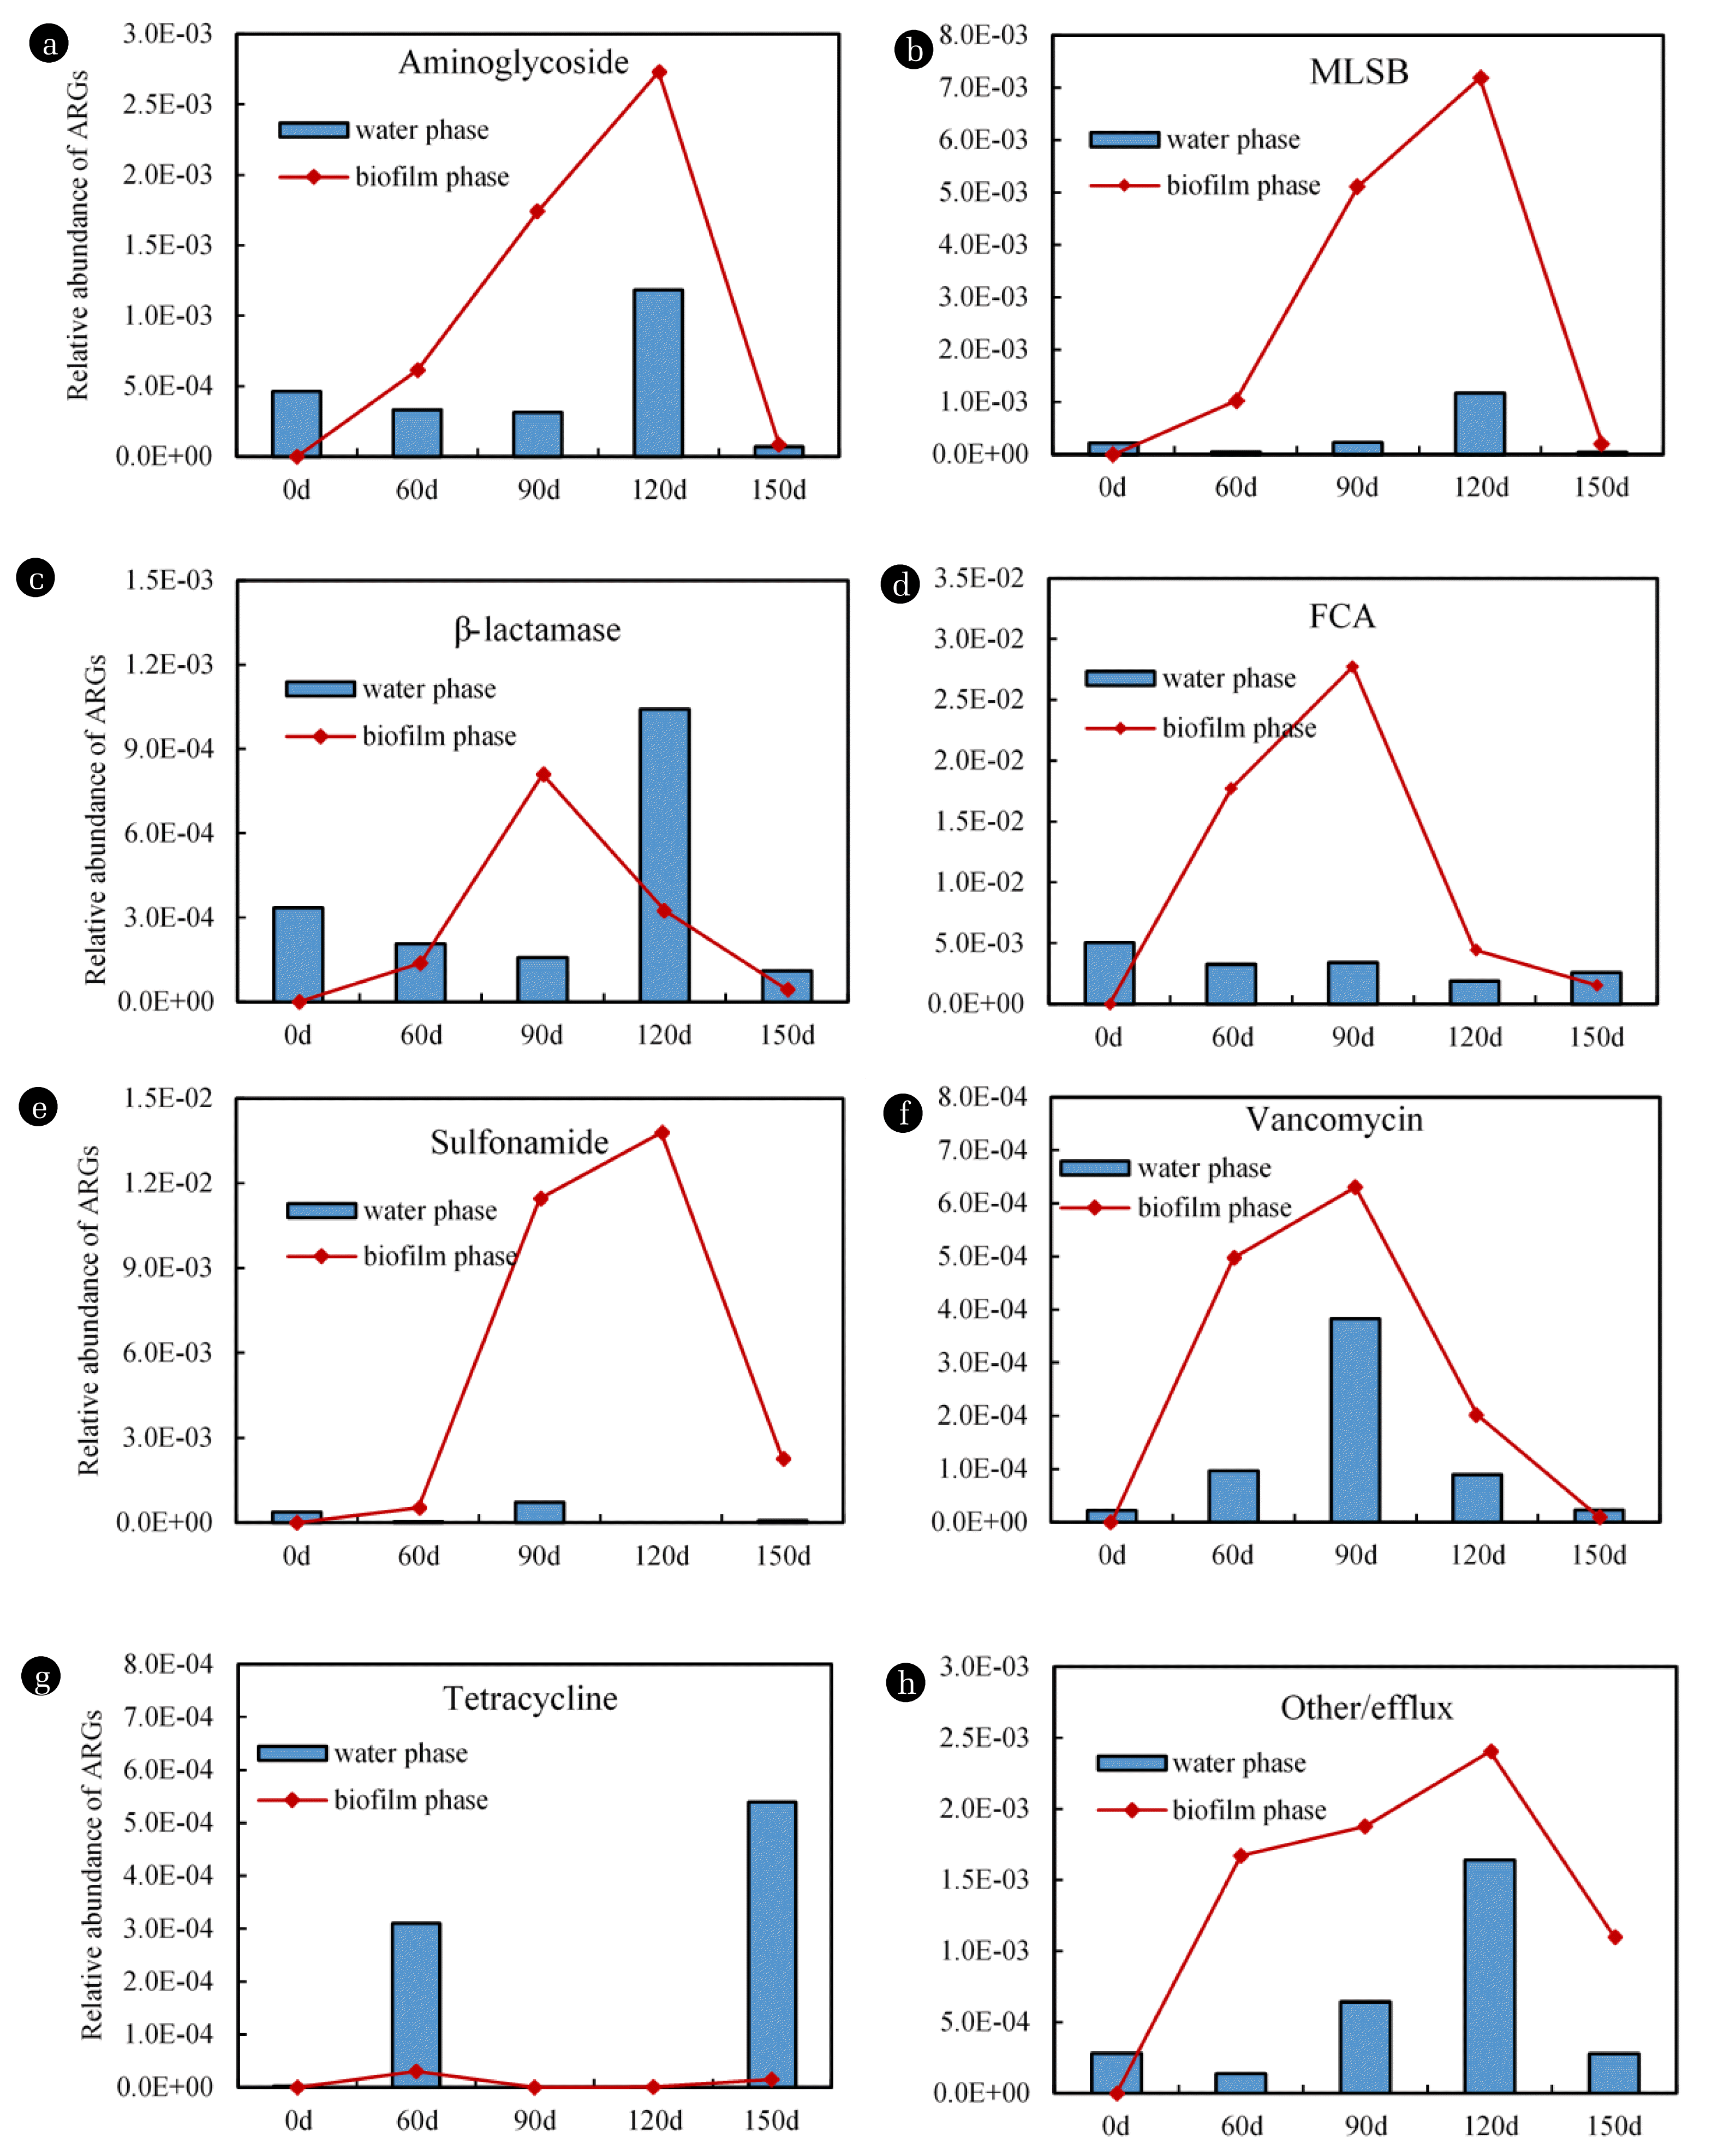
One hundred and eighty-six subtypes of selective ARGs, which involved eight categories of antibiotics (aminoglycosides, β-lactams, FCA, MLSB, sulfonamide, tetracycline, vancomycin, and other/efflux) were determined (Fig. 3), and the total relative abundance detected in the biofilm and effluents ranged from 6.20×10⁻⁷ to 2.77×10⁻² and from 2.58×10⁻⁶ to 5.03×10⁻³, respectively (Fig. 4). The ARGs numbers detected in the 186 subtypes of selective ARGs in biofilms and effluents ranged from 29 to 42, and 16 to 56, respectively (numbers not shown in Fig. 3), which demonstrated that only small portions of the 186 subtypes of selective ARGs were detected.
As shown in Fig. 4, at 0 d, all eight categories of ARGs were detected in effluents, which demonstrated that ARGs contamination originally existed in the reactor influent. With regard to the effluents, at 60 d, the relative abundances of all eight categories of ARGs were detected, which demonstrated the ARGs categories in the reactor influent triggered ARGs contamination in biofilms during the early biofilm period. With regard to the effluents, at 60 d, the relative abundances of six categories of ARGs (except for tetracycline and Vancomycin) were reduced compared with those at 0 d. During 0–60 d, with the growth of early biofilms, only few aged bacteria on the coupons were released into the effluents, which led to little improvement in ARGs relative abundance in effluents. In addition, some ARGs originally found in the influent were even attached and massed on these loose and thin biofilms.
At 90 d or 120 d, the relative abundance of seven categories of ARGs (except for tetracycline) in both the biofilms and effluents, were highest during the entire operation cycle due to dense and mature biofilms. In the biofilms, the relative abundance of ARGs of FCA, β-lactam, and vancomycin at 90 d and ARGs of aminoglycosides, MLSB, sulfonamide, and other/efflux at 120 d were highest during the entire operation cycle. In the effluents, ARGs of FCA, sulfonamide and vancomycin at 90 d and ARGs of aminoglycosides, MLSB, β-lactam and other/efflux at 120 d demonstrated the highest relative abundance during the entire operation cycle. These findings illustrated that the resistance ability of bacteria was significantly improved with the growth of dense and mature biofilms on the coupons. In particular, the relative abundance variations in the seven categories of ARGs in effluents agreed with the increasing trends of HPC and TCC in the effluents at 90 and 120 d (Fig. 1B). This also signified that the increase in microbial indices in water occurred with the growth of dense and mature biofilms on the coupons, which was related to the improvement in ARGs in the effluents. At 150 d, the relative abundances of six categories of ARGs (except for tetracycline and FCA) in biofilms and effluents decreased compared with those at 90–120 d, which may have been due to the shedding of aged biofilms from the pipeline, that began to fall off at 90–120 d, and the biofilms after falling off were run out with the effluents.
A comparison of the biofilm and effluent results showed that after 60 d of operation, the relative abundance of the six types of ARGs (except for tetracycline and β-lactam) in biofilms was almost higher than that in the contemporaneous effluents (Fig. 4). ARGs were effectively enriched in biofilms during the transportation process, which could further lead to contamination in the DWDSs. It was reported that biofilms are reservoirs of bacteria in water distribution systems, 95% of which are in the biofilms. Biofilms in DWDSs, as a special bacterial community formed by bacteria and their extracellular polymeric matrix, are important aspects of bacterial resistance in pipe water. The biochemical and metabolic activity of bacteria in biofilms declined compared with suspended bacteria [33], which led to a decrease in the sensitivity of bacteria to antibiotic stresses [34,35]. The special spatial structure of biofilms also produces a strong barrier to resist antibiotics. In addition, the biofilms have an adaptive resistance mechanism, which enhances gene regulation, including up-regulation of the quorum sensing system, efflux pump, and an increase in the mutation rate of antibiotic target genes [33,36,37]. Moreover, it was reported that densely distributed bacterial communities are more conducive to bacterial growth and HGT of ARGs [38]. These factors decrease the sensitivity of bacteria in biofilms and enhance proliferation of ARGs.
As shown in Fig. 4, the variation trends in the eight categories of ARGs at different operation times and different phases were not consistent. In particular, the ARGs of tetracycline (Fig. 4(G)), did not show the same trends as the others. Different categories of ARGs have various host bacteria, and many ARGs have a broad host population. Different categories of ARGs may have a different tendency towards specific or non-specific host bacteria during pipeline transportation, resulting in the different categories of ARGs to change inconsistently. For example, ARGs of tetracycline were detected in 19 genera including aerobic bacteria, anaerobic bacteria, gram-positive bacteria and gram-negative bacteria [39], while the erm, an ARG of MLSB, was mainly only detected in gram-positive bacteria [40]. Furthermore, the influence of chorine disinfectant on removal of some ARGs in DWDS water should be noted, as it was reported that the reduction of ARGs of sulfonamide in water was caused by chlorination [14].
3.4. Distribution of MGEs in the Biofilm Phase and Effluents
The relative abundances of 13 subtypes of MGEs in biofilms and effluents during 150 d of operation time are shown in Table 1. Of which, four subtypes of MGEs, intI-2, ISCR2, tnpA-01, and tnpA-04 were not detectable (ND) both in biofilms and effluents. In the biofilms, the following eight subtypes of MGEs were detected: intI-1, orf513, Tp614, IS613, tnpA-02, tnpA-03, tnpA-06 and tnpA-07, and their relative abundance ranged from 5.93×10⁻⁷ to 5.59×10⁻². In the effluents, the following seven subtypes of MGEs were detected: intI-1, orf513, Tp614, tnpA-03, tnpA-05, tnpA-06 and tnpA-07, with their relative abundance ranging from 8.51×10⁻⁷ to 2.82×10⁻³. The detection times of tnpA-02, tnpA-05, and tnpA-07 and their abundance were lower than the others. In the effluents, at 0 d, intI-1, tnpA-03 and tnpA-06 were detected with their abundances of 3.74×10⁻⁴, 2.64×10⁻⁴ and 8.51×10⁻⁷, respectively, which demonstrated that these three subtypes of MGEs originally existed in the reactor influent. At 60 d, a total of six subtypes of MGEs (intI-1, orf513, Tp614, tnpA-03, tnpA-05 and tnpA-06) were detected in the effluents. Furthermore, the relative abundance of intI-1, tnpA-03 and tnpA-06 in the effluents increased from 0 d to 60 d. In the biofilms, at 60 d, the following 4 subtypes of MGEs were detected: intI-1, orf513, tnpA-03 and tnpA-06 with their relative abundance ranging from 3.92×10⁻⁵ to 2.04×10⁻². At 60 d, the improvement in six subtypes of MGEs in the effluents and four subtypes of MGEs in the biofilms was caused by early biofilms on the coupons.
However, in the biofilms and effluents, the relative abundances of MGEs at 90 d or 120 d, were lowest during the entire operation cycle. In the biofilms, a total of seven MGEs, including intI-2, ISCR2, tnpA-01, tnpA-04, Tp614, tnpA-04 and tnpA-05 at 90 d and 120 d were ND. In addition, at 90 d, tnpA-06 was ND. At 120 d, tnpA-07and tnpA-02 were ND, and intI-1, orf513, and tnpA-03 demonstrated their lowest relative abundance during the entire operation cycle. In the effluents, intI-2, ISCR2, tnpA-01, orf513, IS613, Tp614, tnpA-02, tnpA-04, tnpA-05 and tnpA-07 at 90 d and 120 d were ND. At 90 d, tnpA-03 and tnpA-06 were ND. At 120 d, intI-1 in the effluents was ND. The reduction in most MGEs during 60–90 d was correlated with dense and mature biofilm formation. Compared with early biofilms, some plasmids of aged cells in mature biofilms may be lost during cellular senescence and apoptosis, which can reduce the number and relative abundances of some MGEs in biofilms [41].
Similarly, at 150 d, a total of six subtypes of MGEs (Table 1.) were detected in the effluents, and their numbers and relative abundances (except for tnpA-06) increased from 120 d to 150 d. In the biofilms, at 150 d, five subtypes of MGEs were detected, and the relative abundance of intI-1, orf513, Tp614 and tnpA-03 increased from 120 d to 150 d, and only that of IS613 at 150 d decreased compared with that at 120 d. This indicated that after the scattering of aged biofilms into water and the growth of new biofilms on the coupons, more MGEs were detected in the newly active biofilms than in the aged biofilms.
The ARGs combined with MGEs such as integrons and transposons can spread among different types of bacteria through the HGT mechanism [42], causing the spread of ARGs, and even changing the distribution characteristics and relative abundance of ARGs. MGEs can be combined with multiple resistant genes to promote the transfer and spread of ARGs within and between different bacterial species. In addition, as shown in Table 1, the variations in each subtype of MGEs at different operation times and different phases (water, biofilm) were not consistent. For example, intI-1 was considered to be an indicator of resistance transfer between cells [43], and can control the expression of exogenous genes in bacteria. intI-1 can promote the transmission and diffusion of ARGs within and between bacterial species, and accelerate the transmission of ARGs [44]. In addition, Okitsu et al. detected ermB in transposons Tn917 and Tnl545 [45], and tetracycline resistance genes such as tetQ, tetM and tetW in transposons and other mobile genetic elements. Similarly, sulII was also reported to be detected in plasmid IncN and is associated with ISCR2 [46]. It was reported that both sulII and floR are linked to ISCR2 following an investigation of Escherichia coli and Aeromonas spp. in soil and water environments [46]. Yan et al. also found a significant positive correlation between intI-1, sulI and sulII [47], which may be due to the constituent role of sul1 in the 3′-conserved segment (CS) region of classic intI-1 [48]
3.5. RDA Results of ARGs, MGEs and DBPs in the Biofilm Phase and Effluents
The RDA results (Fig. 5) show the spatial distribution characteristics based on the distributions of ARGs and MGEs under the influence of chlorination DBPs in biofilms and effluents. As shown in Fig. 5(A), in the biofilms, intI had a significant positive correlation with the ARGs of FCA, Vancomycin, Other/efflux, Tetracycline and β-lactams and that Transposes had a positive correlation with ARGs of Tetracycline in the biofilms. The influence of DBPs on ARGs in the biofilms was little compared with that of MGEs on ARGs. DBPs showed a significant positive correlation with ARGs of Aminoglycoside, Sulfonamide and MLSB in the biofilm, but a negative correlation with MGEs such as intI and Transposes, etc. (Fig. 5(A)). Due to the special structure of the biofilm, which can produce a strong barrier to resist DBPs in water, less DBPs can penetrate the inner biofilm and lead to greater influence on bacteria in inner biofilms. Biofilms in DWDSs are formed by more complex microbial communities attached to the pipe wall. It was reported that HGT was significantly more likely to occur in biofilms than in free bacteria [31], and densely distributed bacterial communities are more conducive to bacterial growth and HGT of ARGs [38]. Hence, compared with DBPs, MGEs in biofilms might be an important contributor to the enrichment and spread of ARGs in biofilms. In addition, as shown in Fig. 5(A), the 60 d and 90 d biofilm sample sites were clustered together and were different to the 120 d and 150 d biofilm sites which demonstrated the formation of mature biofilms during this period. This indicated that the ARGs level in biofilms fluctuated less during the early-to-mature period with early and young biofilm growth.
As shown in Fig. 5(B), in effluents, different types of DBPs such as THMs and HAAs had positive correlations with various ARGs. THMs had a significant positive correlation with ARGs of Aminoglycoside, β-lactams, other/ efflux and MLSB in the effluents. Similarly, HAAs had a significant positive correlation with ARGs of Other/efflux, β-lactams, Aminoglycoside and Transposes in the effluents. In addition, both THMs and HAAs showed significant negative correlations with ARGs of FCA, Sulfonamide, Tetracycline, and intI in the effluents. These results showed that the DBPs were related to the production of ARGs in water, and DBPs might be important contributors to the enrichment and spread of ARGs in water. He et al. found that exposure to low concentrations of TCM (belongs to THMs) and DCAN (belongs to Haloacetonitriles) significantly stimulated conjugative transfer of ARGs, which provided evidence for the influence of DBPs on the spread of antibiotic resistance [24]. Although DBPs in water did not cause bacterial death, they could be a factor in selective pressure on ARBs and their associated ARGs [16], which can lead to increased resistance to antibiotics. It was reported that under the stress of disinfection, some bacteria will show a higher mutation rate and HGT rate; thus, they acquire antibiotic resistance more quickly [34]. In addition, the results in Fig. 5(B) further reveal that, compared with DBPs, MGEs showed less of a relation with ARGs in effluents, e.g., intI had a significant positive correlation with ARGs of FCA, Sulfonamide and Vancomycin, and Transposes had a positive correlation with the ARGs of Tetracycline. The influence of MGEs on ARGs in effluents was no more significant than that in biofilms. As shown in Fig. 5(B), similar to the biofilms, the sites at 0 d, 60 d and 90 d were relatively close, indicating that these water samples in the early-to-mature period with early and young biofilm growth were similar to the influence on the DBPs of chlorination disinfection.
Compared to the results shown in Fig. 5(A), the influence of DBPs on ARGs in effluents was more significant than that in biofilms. In DWDSs, the suspended bacteria in effluents and attached bacteria in biofilms resulted in different microbial community compositions [7]. It was reported that ARGs in water were much more influenced by bacterial community changes than MGEs, and the combined effects in water samples [49] and the bacterial community was attributed to the various ARGs [49]. It was also reported that DBPs in water can affect ARGs by changing bacterial communities [16]. This may also be the reason for the fluctuations in ARGs detected in the water phase at different periods of biofilm growth (Fig. 4)
4. Conclusions
One hundred and eighty-six subtypes of ARGs, which involved eight categories of antibiotics (aminoglycosides, β-lactams, FCA, MLSB, sulfonamide, tetracycline, vancomycin, and other/efflux), and 13 subtypes of MGEs and DBPs were detected in the biofilms and effluents from the simulated DWDS reactor during 150 d of operation. At 90 d or 120 d, with the growth of dense and mature biofilms on coupons, the resistance ability of bacteria was significantly improved, while the level of most MGEs reduced. However, more MGEs were detected in the newly active biofilms. A deep examination of the influence of DBPs on ARGs and MGEs in DWDSs using RDA illustrated that their relationships occurred in different phases. In general, compared to biofilms, the influence of DBPs on ARGs in effluents was more significant, and DBPs might be an important factor in the enrichment and spread of ARGs in water.