Application of Biological Activated Carbon Process for Water Quality Improvement of Stagnant Stream Channels
Article information
Abstract
The water quality improvement of golf course ponds, as representative stagnant stream channels, was evaluated by applying a biological activated carbon (BAC) process composed of four consecutive activated carbon reactors. The study was performed from autumn to winter in order to evaluate the feasibility of the BAC process under low temperature conditions. In the study, water quality of pond A (target pond) and pond B (reference pond) were monitored. Pond water was pumped into the BAC process, and was then returned to the pond after treatment. The optimal conditions were determined to be 2 hr of empty bed contact time (EBCT) at a temperature above 4°C, in which improvements of chemical oxygen demand (COD), total nitrogen (TN) and total phosphorus (TP) of pond A compared to pond B were 3.62%, 3.48% and 1.81%, respectively. On the other hand, as the temperature was below 4°C, some degree of water quality improvement was achieved even when EBCT were 1 or 0.5 hr, suggesting that the BAC process can be successfully applied for the improvement of pond water quality in winter months. The values of biomass concentration and microorganism activity in each condition were highest where 2 hr of EBCT was applied at a temperature above 4°C, but values were similar throughout all treatment conditions, and thus, adsorption is considered to be the dominant factor affecting process efficiency. From the denaturing gel gradient electrophoresis (DGGE) results, no significant differences were observed among the activated carbon reactors, suggesting that the number of reactors in the system could be decreased for a more compact application of the system.
1. Introduction
The maintenance of water quality within stagnant stream channels is very important, as they can be used as sources of drinking water and agriculture water. In Korea, the water quality of stagnant stream channels is in decline in spite government efforts to reduce intensive pollutants [1]. This phenomenon is evident in many other countries; blue-green algae blooms have been observed in a number of stagnant stream channels [2], Cheng and Li [3] reported that 78% of lakes in the middle and lower reaches of the Changjiang River were mesotrophic, eutrophic, or hypertrophic, while Evans et al. [4] also reported that organic materials of lakes and rivers in UK have presented increasing trends.
Point and non-point contaminant sources, such as industrial wastes, agricultural wastewaters, runoff and atmospheric deposition, are major factors affecting the contaminant levels of stagnant stream channels. Many forms of runoff create sedimentation prob lems in receiving streams and lakes, as they generally include organic materials, nutrients and toxic materials [5]. In particular, inflows with high concentrations of nutrients cause eutrophication, which leads to serious impairment of water quality. The implications of algal blooms in freshwater systems include the death of fish-life, and reduction in overall biodiversity due to reduced levels of dissolved oxygen, reductions in the aesthetic value of ecosystems, the production of a musty odor in water systems, and nutrient enrichment of the immediate catchment [6].
Golf course ponds are representative of stagnant stream channels, and their number has increased in recent years. Fertilizers are regularly applied for the establishment and maintenance of turfgrass, and as a consequence, golf course ponds can often contain a high degree of nutrient loading. Researchers have reported that nutrient concentrations in golf course ponds were higher than those in reference ponds [7, 8].
Reductions in nutrient inputs to water bodies should be the primary focus where mitigation measures to control eutrophication in stagnant stream channels are sought. Techniques for the improvement of water quality within stagnant stream channels have included the restoration of the water body, littoral zone and surrounding land. Because of the difficulty and constraints associated with land restorations, most studies have attempted to recover the quality of the water body or littoral zone [9]. Among those studies, many researchers have focused on restoration of submersed macrophytes or the precipitation of phosphorus [10–12]. However, macrophyte growth can be inhibited by high phosphorus concentrations, blue-green algal blooms and low water transparency [11], and can also result in the further release of precipitated phosphorus. Thus, for the control and maintenance of water bodies in the long-term, methods which are specific to the water body in question should be applied.
Granular activated carbon (GAC) is used in many water treatment systems because it is effective in adsorbing a wide range of contaminants. GAC can be colonized to a high degree by bacteria to form biological activated carbon (BAC) because of carbon’s large surface area and rough surface texture [13]. Bacteria attached to activated carbon play an important role in water treatment. Pollutants from water are first adsorbed on the macropores, where it is retained long enough to be degraded by attached bacteria [14, 15].
Therefore, this research aims to improve the water quality of a golf course pond through the introduction of a BAC process outside of the golf course pond. Especially, we evaluated the effect of the BAC process on the chemical oxygen demand (COD), total nitrogen (TN) and total phosphorus (TP) improvement of golf course pond. For this experiment, pond water was treated using the BAC process and was then returned into the pond. Additionally, we performed polymerase chain reaction denaturing gel gradient electrophoresis (PCR-DGGE) and 2-(p-iodophenyl)-3-(p-nitrophenyl)-5-phenyl tetrazolium chloride (INT)-dehydrogenase activity (DHA) tests to investigate the characteristics of the microbial community and the activity of the microorganisms attached to the activated carbon.
2. Materials and Methods
2.1. Pond Descriptions
The golf course was located in the city of Yangsan, Korea, and its area was 0.7 km2. The golf course contains nine ponds, one of which (pond A) was selected to evaluate the efficiency of the BAC system for the improvement of water quality. The area of pond A is 9,200 m2, and its mean depth is around 1.0 m. In order to compare the degree of water quality improvement, we also monitored a reference pond (pond B) located close to pond A. The area of pond B is 6,200 m2 and its mean depth is also around 1.0 m. The initial characteristics of pond water quality are presented in Table 1.
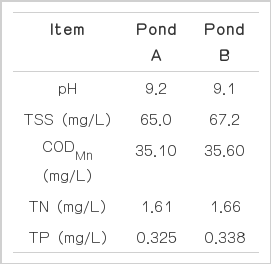
Initial Characteristics of Pond Water
2.2. Experimental Procedure
A coal based GAC (CLP; Hanil, Korea) with a particle size of < 2.12 mm was used in this experiment. Prior to experiments, the reactors were inoculated with activated sludge from a municipal wastewater treatment plant, and were then rinsed with pond water prior to the initiation of the experiment. For the improvement of water quality, the water was fed into the BAC process by pump, and was then returned to the pond after treatment.
On-site experiments using a pilot-scale BAC process were also conducted for the improvement of golf course pond water quality. Here, the pilot-scale system consisted of a clarifier and four activated carbon reactors, as shown in Fig. 1. The system was installed 70 m from the golf course pond. Each reactor contained seven activated carbon columns, as shown in the schematic representation of reactors (Fig. 1). Thus, a stable flow was secured within the waterway, and as a result, backwashing was not necessary. The volume of the clarifier which was used for the removal of grit was 0.65 m3, and that of each activated carbon reactor was 1 m3 (770 ø × 2,200 H). All of the reactors were closed, and the packing ratio of activated carbon in each reactor was 35% (v/v). In order to monitor the spatial variability of pond water quality, samples were taken from 4 locations within the pond. Table 2 shows the operating conditions of the pilot-scale experiment. The process was operated for various durations of empty bed contact time (EBCT).

Schematic diagram of the reactor setup.

Operating Conditions
2.3. INT-dehydrogenase Activity Test
The method of Koopman et al. [15] was used for the determination of microbial activity. A 0.2% (w/v) solution of INT (Sigma-Aldrich Co., USA) was prepared using deionized, filter-sterilized water. 5 mL triplicate samples were amended with 1.0 mL of INT, incubated in the dark at room temperature (20 ± 2°C) for 30 min, and then fixed with 1.0 mL of 37% formalin. Treated samples were centrifuged at 2,500 rpm for 10 min, and excess water was removed. Pallets were extracted with 5 mL 2+3 acetone/dimethyl sulfoxide for 20 min in the dark, after which the extracts were centrifuged for 10 min and the optical density of the supernatants determined at 465 nm. INT-DHA activity was calculated as equivalent oxygen (O2*) units according to the following equation:
where, DHA is INT-DHA activity (mg O2*/g VSS/day), D465 is optical density through a path length of 1.0 cm, ν is final solvent volume (mL), V is volume of INT-treated sample used in the extraction procedure (mL), C is initial biomass concentration of the sample (g VSS/L), t is incubation time (min) and F is a factor which is used to adjust for dilution caused by the addition of INT and formalin. The attached biomass (mg/L) was calculated by vortexing a sample of the media with 0.1% sodium pyrophosphate solution, thus detaching any organic material from the activated carbon, and was then divided by the effective volume of the reactor (L).
2.4. DNA Extraction and Amplification
DNA samples were extracted from activated carbon reactors. Samples were centrifuged at 10,000×g for 1 min, and the supernatant was removed and resuspended in 1 mL of distilled water. A PowerSoil™ DNA kit (Mo Bio Labs. Inc., USA) was used to extract DNA, according to the manufacturer’s instructions. DNA products were applied to electrophoresis using 1% agarose gel. The extracted DNA was amplified by PCR using an automated thermal cycler (Mastercycler gradient; Eppendorf, Germany). Table 3 summarizes the EUB primers used in this study, and PCR conditions, respectively. EUB primers are used to detect the predominant bacteria species. At first, the extracted DNA was amplified by EUB10-F/EUB1400-R, then the amplified products are secondly amplified by EUB341-F/EUB518-R. The reactions were carried out in a 25 μL volume containing 1 μL of template DNA, 0.25 μL of the forward and reverse primers (10 pmol), 2.5 μL of 10×Taq buffer, 10 μL of 10 mM dNTP, and 0.125 μL of Taq DNA polymerase (Solgent Co., Korea). PCR products were applied to electrophoresis profile using 1% agarose gel. PCR products were additionally purified using a PCR purification kit (Bioneer Co., Korea).
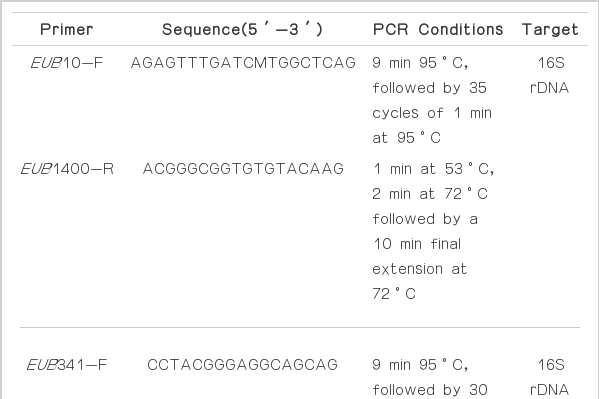
PCR Primers and Conditions Used in This Study
2.5. DGGE and Sequencing
DGGE was performed by using 16S rRNA gene fragments to characterize the microbial communities in the reactors. PCR products were separated using a DCode system (Bio-Rad, USA). Samples were loaded onto a 6% polyacrylamide gel in 0.5×TAE buffer (40 mM Tris-acetate, 1 mM EDTA, pH 8.3). A denaturant gradient ranging from 20% to 50% (100% denaturant is 7 M urea plus 40% v/v formamide) was used. Gels were run at 60°C for 8 hr at a constant 200 V, and were then stained for 30 min with ethidium bromide (Bio-Rad, USA), after which the band profile was identified using an UV transilluminator (Uvitec gel documentation system, UK). DGGE bands were excised with a sterile pipet tip, and were then transferred to 30 μL TE buffer. To resuspend the DNA, it was heated at 60°C and frozen at −20°C for 15 min, and this process was repeated in triplicate. The resuspended DNA was reamplified using the same primers. After purification, PCR products were sequenced using an ABI 3730XL capillary DNA sequencer (Applied Biosystems Co., USA) along with the ABI prism™ Bigdye™ Terminator cycle sequencing Ready reaction kit (Ver. 3.1; USA).
2.6. Analytical Methods
The samples were tested within 3 days of sampling. pH and dissolved oxygen concentration were measured using an Orion Research pH meter (Model 230A; USA) and a YSI DO meter (Model 58; USA), respectively. The chemical oxygen demand (CODMn), total nitrogen (TN), total phosphorus (TP) and suspended solids (SS) concentrations were measured using Standard Methods [16]. The stored samples were kept refrigerated at 4°C until analysis.
3. Results and Discussion
3.1. COD Improvement of Pond Water
Fig. 2(a) presents the final COD concentrations of pond A in each condition determined from the operation of the BAC process as well as those of pond B. The experiment was performed from autumn to winter, and thus the temperature was continuously decreasing during the experimental period. As shown in Fig. 2(a), the water quality of the reference pond (pond B) gradually improved over the experimental period, even though there was no treatment applied, and this is partially attributed to the non-application of fertilizer to the golf course during the experimental period, as well as the reduction of algal growth with decreasing temperature.

(a) Final chemical oxygen demand (COD) concentration ( ) and improvement (—) of pond water and (b) the variation of removal efficiencies for COD, total nitrogen (TN) and total phosphorus (TP) by the biological activated carbon (BAC) process in each condition. IC: initial concentration.
Compared to pond B, a greater improvement of COD of pond A was achieved, as 1.67%, 3.62%, 1.68% and 3.05% arising from the treatment conditions I, II, III and IV, respectively. The improvement of COD due to the BAC process could be calculated by multiplying the COD removal concentration by the BAC process and the total volume treated during each condition, resulting in 5.9, 9.2, 4.9 and 6.1 kg in each condition, respectively. Each value could then be divided by the pond volume, resulting in 0.64, 1.00, 0.53 and 0.66 mg/L reductions in COD, respectively. These results coincide with the analyzed COD improvements of 0.59, 1.18, 0.50, 0.49 mg/L in pond A, as compared to pond B. Thus, it is considered that water quality improvement of pond A is attributed to the operation of the BAC process.
In a BAC process, adsorption is one of the most important mechanisms of pollutant removal [17], and might be the prominent mechanism for the removal of organics until the empty spaces of the activated carbon are occupied. After breakthrough, the major mechanism of organics removal is biodegradation by attached microorganisms, resulting in a decrease in the removal efficiency of organics [18]. In condition III, the removal efficiency of COD by the BAC process was sharply decreased (Fig. 2(b)), which is attributed to a decrease of adsorption efficiency with increased flow rate. Chang et al. [19] also reported that higher flow rates resulted in a decreased COD removal by the biofilm system. An increased flow rate means that the organic loading rate to the BAC process is increased, indicating that pore sites of the activated carbon are occupied at a faster rate. The biodegradation of adsorbed organic compounds maintains active adsorption sites, improving the COD removal efficiency. In condition III the flow rate was increased considerably, and as a result, the bacterial population had less time to adapt to the environment [19], and thus, there was a reduced provision of new sites for adsorption, resulting in a decreased COD removal efficiency.
3.2. TN and TP Improvement of Pond Water
Fig. 3(a) shows the final TN concentration under each condition. Compared to pond B, the reduction of TN in pond A under each condition was 1.67%, 3.48%, 2.20% and 2.69%, respectively. In the BAC process, denitrification, adsorption of particulate nitrogen and assimilation of nitrogen to attached biomass could explain the removal of TN and the TN removal efficiencies of the BAC process under each condition were 24.9%, 27.2%, 18.8% and 9.8%, respectively (Fig. 2(b)). In condition III, the improvement of TN was sharply decreased compared to other conditions. It is believed that temperature significantly affects nitrification and denitrification rates [20, 21]. Andersson et al. [20] found that ammonia removal efficiencies ranged from 10% to 40% in pilot-scale BAC filters, but reached over 90% in full-scale systems between 4 and 10°C. However, at temperatures below 4°C, the ammonia removal efficiency was below 30% in the same full-scale filters. Vacková et al. [21] reported that immobilized mixed cultures successfully performed denitrification between 5 and 8°C. During conditions II and III, the temperature was maintained above 4°C, but under condition III, temperature was reduced below 4°C. Thus, nitrification and denitrification efficiencies might have been decreased, resulting in a decreased TN improvement. Under condition IV, although the temperature increased above 4°C, TN removal efficiency did not increase. Thus, the increased flow rate may have resulted in a counteracting decrease in TN removal efficiency.

Final (a) total nitrogen (TN) and (b) total phosphorus (TP) concentration () and improvement (—) of pond water in each condition. IC: initial concentration.
Fig. 3(b) presents the final TP concentration under each condition. TP improvements of pond A were 1.23%, 1.81%, 0.95% and 1.16%, respectively, in comparison of pond B. The removal efficiency of TP under condition III was also decreased significantly. TP in the experimental water is thought to mainly consist of particulate phosphorus, as little PO43− was detected (data not shown) in comparison to the background levels of TP. In addition, Morgenroth and Wilderer [22] reported that the removal of phosphorus could be limited in a biofilm system due to domination of the biofilm by heterotrophic bacteria utilizing residual organics, thus decreasing the metabolism of phosphate accumulating microorganisms. Thus, TP might be mainly removed by adsorption. Nishijima et al. [23] reported that the biodegradation rate of organic compounds in a BAC system which was pre-treated with phosphorous was five times greater than that where no phosphorus was added, indicating that the growth of bacteria is also a substantial factor affecting phosphorus removal in BAC systems. In this experiment, both TP removal efficiency of the BAC process, as well as the improvement of pond A compared to pond B were significantly decreased under condition III. As the flow rate increased, the rate of organic biodegradation was decreased, and this likely resulted in a decrease of TP removal by microorganisms. The regeneration rate of adsorption sites was likely decreased, causing a sharp decrease of phosphorus removal by adsorption. Thus, as presented in Fig. 2(b), the TP removal efficiency was determined to be significantly related to efficiency of COD removal.
In this experiment, the greatest improvement in water quality was observed under condition II, which applied 2 hr of EBCT with a packing ratio of 35% at a temperature above 4°C. However, even as the temperature decreased below 4°C due to seasonal change, the water quality was continuously improved within the target pond, even when the duration of EBCT was 1 or 0.5 hr. Thus, it is suggested that the BAC process can be successfully applied for the improvement of pond water quality in winter months.
As this study was a pilot-scale experiment, the applied BAC process was small compared to the scale of the pond, and thus, a larger scale process should be applied in order to more accurately evaluate the effect of such a system on the improvement of water quality and algal reduction. Nitrogen and phosphorus are widely known as the limiting factors of algal production, and thus, the removal of nitrogen and phosphorus directly contributes to a decrease in algae within such a system. Winter and Dillon [24] reported that the mean flux of TN and TP within golf course pond waters were 1.4 and 0.04 kg/km2/day, respectively. Thus, through the consideration of these results, a lager BAC process will be designed and applied in the later study.
3.3. Attached Biomass Concentration and INT-DHA
In a BAC process, the amount of microorganism attachment is important for the removal of contaminants. Hur et al. [25] reported that the concentration of biomass attached to a ceramic media was maintained at around 250 mg/L within a reactor which was applied to the treatment of wastewater. Microorganism activity is also a significant factor, as it directly affects the degradation of pollutants. In this experiment, flow rate is considered to be an important factor for the attachment of biomass, as it determines organic loading rate, and a greater degree of desorption should occur with a faster flow rate. Temperature is also a crucial factor for the removal of pollutants because it directly affects the metabolic activity of microorganism. As the BAC process was operated, temperature decreased gradually, and this was thought to have influenced the decrease in improvement efficiency.
To evaluate the volumetric flow rate and temperature effect on microorganism, attached biomass concentration and INT-DHA were analyzed. Fig. 4 shows the variation of both mean attached biomass and microorganism activity of four activated carbon reaction in each condition. Among those conditions, the greatest degree of attached biomass and DHA were observed for condition II, which also represented the greatest improvement of pond water quality. However, no significant differences in biomass or DHA values were observed among the four conditions. Park et al. [26] also reported that a variation in temperature from 5 to 20°C did not have a significant effect on bacterial activity. These results mean that the amount of biomass and bacterial activity were not significant factors in determining the efficiency of the BAC system. Thus, since another major mechanism is adsorption, the decrease in removal efficiency of nutrients and organic materials during conditions III and IV is affected to a greater degree by the decrease in adsorption efficiency than by the decrease in biodegradation efficiency as flow rate increases. Liang et al. [27] reported that higher flow rate leads to a low liquid-film mass transfer. Thus, low liquid-film mass transfer is also thought to have been one reason for the decrease in pollutant removal by the BAC process.

Attached biomass concentration and dehydrogenase activity (DHA) in each condition.
3.4. DGGE
Fig. 5 presents the DGGE profiles of 16S rRNA with EUB primers using the attached biomass of the activated carbon in each aerobic column tank. These samples were obtained after condition IV. E1 and E2 bands were detected in all of the aerobic columns. Band E1 was closely related to uncultured cyanobacterium, which is generally found in low temperature and alkaline environments, and is detected in carbonate accumulations within organic and inorganic environments [28]. Thus, cyanobacteria is considered to be the prominent algae in ponds having alkaline conditions with sufficient organic material and low temperature, and so, it might be attached to activated carbon as the pond water was circulated. Band E2 is associated with uncultured α-proteobacterium which is detected in autoheterotrophic biofilm using algal exudates as a carbon source [29]. The algae existing in pond water might be attached to the activated carbon, producing organic material by the hydrolysis of algae, and thus, uncultured α-proteobacterium might be mainly grown. Microorganisms related to band E3 are prominently detected in anoxic river sediment and are known to degrade precipitated organic compounds [30]. Thus, these species are also thought to have influenced the removal of organics from the interior of the biofilm. Microorganisms linked to band E4 are primarily found in ground water, and as such, they were likely present in the pond water [31]. Ban E5, which is closely associated with uncultured Rhodocyclaceae bacterium, is usually detected in anoxic conditions, and so, it might have grown in inner space of activated carbon [32]. Band E6 has a high similarity to the uncultured bacterium which is detected in the process that degrades organic material in anaerobic conditions [33], thus it is also considered to have grown in inner space of biofilm and have degraded organic compound. As a result of PCR-DGGE, there was no significant difference determined among the microorganism species of each aerobic column, indicating that the number of reactors could be decreased for a more compact application of the system.
Denaturing gel gradient electrophoresis (DGGE) profile.
4. Conclusions
Through the on-site application of the pilot-scale BAC process, an improvement of water quality of target pond was observed in comparison to the reference pond. Although the optimal condition was turned out to be 2 hr of EBCT at a temperature above 4°C, some degree of water quality improvement was achieved even when EBCT was 1 or 0.5 hr at a temperature below 4°C, suggesting that the BAC process can be successfully applied to pond for the improvement of water quality during the winter season. On the other hand, the final biomass concentration and microbial activity were similar in each reactor regardless of the condition. The DGGE results also revealed that the discrepancy in diversity of microorganisms for each reactor was not significant, indicating that the number of reactors could be decreased for a more compact application of the process.
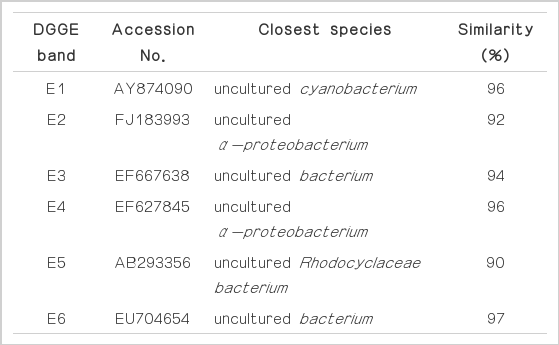
Sequences of Extracted DGGE Bands Using EUB Primer
Acknowledgement
This work was supported by a 2-year Research Grant of Pusan National University.