Study of COD Removal Efficiency from Synthetic Wastewater by Photocatalytic Process
Article information
Abstract
In this research, we compared the COD removal efficiencies of titanium dioxide (TiO2) thin films coated on the surfaces of borosilicate glass that prepared by three different numbers of coating layer; i) 3 layers ii) 4 layers and iii) 5 layers by sol-gel method. All of the prepared TiO2 thin films consisted of pure anatase crystalline structure with grain sizes in the range 20–250 nm. The calculated optical band gaps of the TiO2 thin films were 3.24. The total apparent surface area per total weight of TiO2 thin films were 4.74, 3.86 and 2.79 m2 g−1 for 3, 4 and 5 layers coating, respectively. The kinetics of the photodegradation reactions of COD under UVA light source were described by the Langmuir-Hinshelwood (L-H) kinetic model. The specific rates of the photodegradation of TiO2 thin films at 3 layers coating was 1.40×10⁻⁴ min−1 mW−1, while for the 4 layers coating and the 5 layers coating were 1.50×10⁻⁴ and 4.60×10⁻⁴ min−1 mW−1, respectively. The photocatalytic performance of COD degradation was higher with smaller grain size, higher surface area and narrow optical band gaps. Moreover, the numbers of coating layer on substrate also have great influence for kinetic of COD removal.
1. Introduction
Industrial development causes high water demand. The industrial expansion also increases impacts to the environment [1, 2]. Wastewater discharged from certain industrial activities contains large amount of organic matters, heavy metals, nutrients, chemicals and hazardous compounds [3–6]. If this wastewater were discharged into the environmental without prior treatment, it would cause water pollution problems. The water pollution could affect the ecosystems, causing impact to the overall environment [7, 8].
TiO2 is a semiconductor that has been widely used as photocatalyst mainly due to its efficient photoactivity, comparatively low toxicity, high chemical stability, self-cleaning ability, narrow band gap, and low-cost [9–13]. The benefits from using TiO2 catalyst in photocatalytic processes include contaminant degradations as well as disinfection in both aqueous and gas phases [14–16].
In this research, the TiO2 thin films were prepared by sol-gel dip-coating process that was one of the most widely used methods for coating catalyst on material surfaces. The advantages of sol-gel processs include simple and low-cost, the ability to synthesis nano-size particles, and able to coat on various materials [17–20]. In this study, the TiO2 thin films catalysts were used to degrade COD in a photoreactor. The objectives of this research were to study the efficiencies and kinetics of COD removal through photocatalytic process using the prepared TiO2 thin films and UVA as the light source.
2. Materials and Methods
The TiO2 thin films were dip-coat onto the of borosilicate glass slide (40.0×85.0×0.3 mm) and petri dish (100 mm dia.×15 mm deep) by sol-gel method using titanium tetraisopropoxide (Ti[OCH(CH3)2]4, TTIP) as a precursor according to the methods described by Rojviroon and Sirivithayapakorn [19. 21]. All of the glass slides were weighed before and after the coating of each layer. The nanostructure and optical band gap of the thin films were investigated by XRD (D8 Advance; Bruker, Karlsruhe, Germany) and UV-V is spectrometer in the wavelength range 290–800 nm (Lambda 650, Perkin-Elmer, Waltham, MA, USA), respectively. The surface morphology and grain size of the thin films was determined by AFM (Asylum Research MFP-3D-BIOTM). The apparent surface areas of the thin films were calculated by the Gwyddion software program, version 2.22 (http://gwyddion.net). The physical properties of thin films were analyzed by the techniques summarized in Table 1.
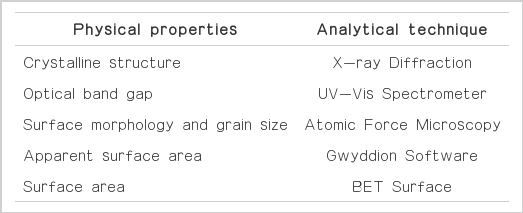
The Techniques Used for Analyses of Physical Properties of the Thin Films
The photocatalytic activities of the thin films were evaluated by the decomposition of COD. A petri dish batch test of 50 mL capacity was used as a reaction container (photoreactor). The reactor was placed in a chamber that contained a UVA light bulb (Fig. 1). The average intensity in the photoreactor was 100 mW.m−2 measured by UV-light Meter Model UV-340.
Schematic diagram of a photoreactor for degradation of COD.
Glucose was used in preparing the synthetic wastewater with the desired amount of COD in the concentration range of 160–400 mg/L and filled into the reactor. Sample was taken for measurement of the initial COD concentration right before the UVA light bulb was turned on. The concentration of COD was recorded with the reaction time throughout the photocatalytic activity test. The measured concentrations of COD from the photocatalytic activity test were corrected by the results from the control experiments carried out in the dark (with the presence of catalyst) and those carried out under the UVA light only (without the presence of catalyst) prior to the kinetics calculations.
3. Results and Discussion
Overall, the physical properties of TiO2 thin films prepared in this study were similar to the physical properties TiO2 thin films in previous study [19, 21]. For the result of the X-ray diffraction, the results showed prominent peaks at 2θ = 25.2°(Fig. 2). As expected, the strong peaks confirm that anatase crystalline structure existed in the TiO2 thin films [22]. The percentages of anatase/rutile phase were calculate from X-ray diffraction intensities using Eq. 1 according to the Spurr equation [23, 24].

The X-ray diffraction profiles of TiO2 crystalline.
Where FA is the mass fraction of anatase in the sample, IA and IR are the strongest intensities of anatase (101) reflection and rutile (110) reflection, respectively. Based on the X-ray diffraction profiles, the mass fraction results indicated that the crystalline structure TiO2 in the thin films is anatase only. The band gap, Eg, was obtained from a Tauc plot, which is a linear regression of (αhν)1/2 against hν with extrapolation to zero (Eq. 2 ) [25–27].
Where α is the absorbance, arbitrary units; hν is photon energy, eV; A is an independent parameter of the photon’s energy for the respective transitions, eV; Eg is the band gap, eV. Again, the Tauc plots of every sample showed that the band gap energy was 3.24 eV, which is indeed the optical band gap for crystalline anatase [25–27].
The grain sizes of TiO2 in the thin films were in the range of 15–100 nm. The results showed that the TiO2 particles were distributed uniformly and evenly in the thin film. Furthermore, the results showed that the surface of TiO2 thin films on glass substrates became smoother when the number of coating layers increased, i.e. the size range of TiO2 became narrower as the coating layers increase (Table 2).
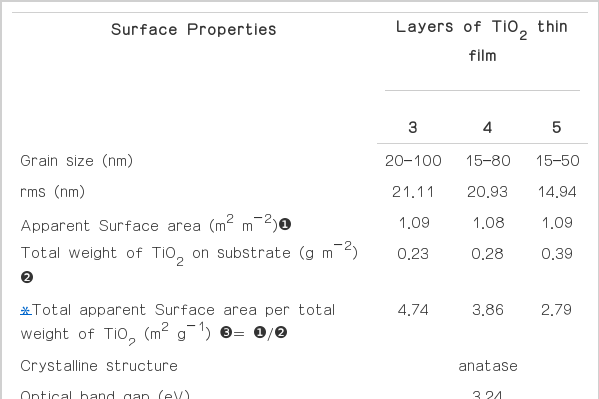
Surface Properties of TiO2 Thin Films at Different Layers of Dip-coating on Glass
As the number of coating layers increased, the apparent surface area tended to decrease. Similar findings was reported by Procházka et al. [28]. This is due to the filling up of the existing gaps on the coated surfaces, therefore the overall apparent surface area decreased as the surface became smoother. The effects can be shown clearly by the AFM images in Fig. 3. The physical properties results of the thin films prepared from previous study [19, 21] and prepared in this study showed that this technic could produce the TiO2 thin films with good properties for using as catalyst and with repeatable results.

AFM images in 2D of TiO2 thin films on glass slides.
A series of photocatalytic degradation tests at various initial concentrations of COD were used to evaluate the decomposition efficiency of COD. The Langmuir-Hinshelwood model (L–H model) was the kinetic model of the photocatalytic process that was usually used for the analyses of the initial rate of photocatalytic degradation [29]. The L–H plots of 1/r0 versus 1/C0 for COD with different number of coating layers of TiO2 thin film catalysts using a UVA light source are shown in Fig. 4. The initial photocatalytic degradation rate, r0, (mol.L/min), was observed to be a function of the initial concentrations of COD (C0). According to Eq. 3, a linear L–H plot of 1/r0 versus 1/C0 was obtained, the L–H rate constant (k), and the Langmuir adsorption constant (K) of COD in the photocatalytic degradation reaction can be calculated.
L – H plots of 1/r0 versus 1/C0 for degradation of COD with different number of coating layers of TiO2 thin film catalysts using a UVA light source.
The kinetic parameters k and K of the photocatalytic degradation reaction are summarized in Table 3.
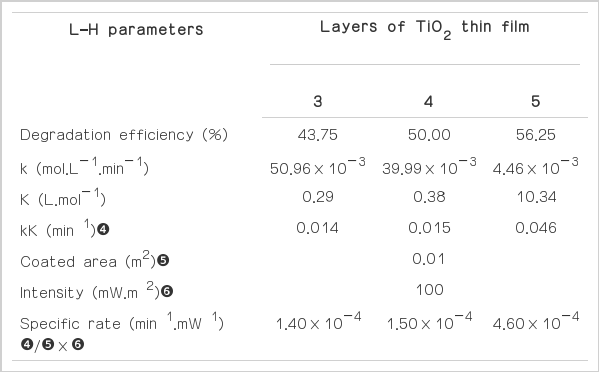
L – H Parameters Obtained in the Photocatalytic Degradation of COD
The results of the overall photocatalytic degradation efficiency were 43.75%, 50.00% and 56.25% within 1 hour for 3, 4 and 5 layers coating, respectively. For the photocatalytic degradation kinetic, the reaction rate constant (k) and the adsorption equilibrium constant (K) increased with increasing the number of coating layers of TiO2 thin film catalysts and decreasing the TiO2 particle size (Table 3). The effect of amount of TiO2 catalyst were similar to those of previous works in term of the photocatalytic activity, i.e. the photocatalytic process increased as amount of TIO2 increased [30]. The important reasons that the photocatalytic rate increased were due to the fine nanoparticle spheres having higher absorption potential than large nanoparticle spheres [31]. When comparing the kinetics results from this study to those of other studies using same pH and catalyst for COD degradation, we found that the values of the photocatalytic degradation rate constant from this study were similar those of Montazerozohori et al. [32] and Velusamy et al. [33]. The photocatalytic degradation rate constant calculated in this study were around 10−2 min−1, which is within the same order of magnitude with those reported in the other studies (Table 4).

Photocatalytic Degradation Rate Constant Comparisons with Other Studies for the Photocatalytic Degradation of COD
4. Conclusions
The prepared TiO2 thin films had desirable physical properties including anatase crystalline structure and nano-sized grains. The photocatalytic degradation efficiency of COD increased as the number of coating layer increased and reached its maximum COD degradation efficiency at 56.25% within 60 min at 5 layers of coating. The values of the reaction rate constants from this study were in the order of 10−4 (1/mW. Min)
Acknowledgement
This work was financially supported by Faculty of Engineering, Rajamangala University of Technology Thanyaburi and National Research Council of Thailand (NRCT) in 2013.