Temporal Characteristics of Volatile Organic Compounds in Newly-Constructed Residential Buildings: Concentration and Source
Article information
Abstract
The present study was designed to examine the concentrations, emission rates, and source characteristics of a variety of volatile organic compounds (VOCs) in 30 newly-constructed apartment buildings by measuring indoor and outdoor VOC concentrations over a 2-year period. For comparison, seven villa-type houses were also surveyed for indoor and outdoor VOC concentrations over a 3-month period. Indoor and outdoor air samples were collected on Tenax-TA adsorbent and analyzed using a gas chromatograph (GC)/mass spectrometer system or a GC/flame ionization detector system coupled to a thermal desorption system. The long-term change in indoor VOC concentrations depended on the type of VOCs. Generally, aromatic (except for naphthalene), aliphatic, and terpene compounds exhibited a gradual deceasing trend over the 2-year follow-up period. However, the indoor concentrations of the six halogenated VOCs did not significantly vary with time changes. Similar to these halogenated VOCs, the indoor naphthalene concentrations did not vary significantly with time changes over the 2-year period. Unlike the halogenated VOCs, the indoor naphthalene concentrations were much higher than the outdoor concentrations. The indoor concentrations of aliphatic and aromatic compounds were higher for the villa-type houses when compared to those of apartment buildings. In addition, four source groups (floor coverings and interior painting, household products, wood paneling and furniture, moth repellents) and three source groups (floor coverings and interior painting, household products, and moth repellents) were considered as potential VOC sources inside apartment buildings for the first- and second-year post-occupancy stages, respectively.
1. Introduction
Most occupants who live in newly-constructed residential buildings are confronted with individual exposures to elevated concentrations of volatile organic compounds (VOCs), primarily owing to stronger emissions from a variety of building and finishing materials, when compared to those who live in established residential buildings [1–4]. Moreover, recently-constructed residential buildings have generally less ventilation conditions than previously constructed ones, because they are more tightly sealed for energy conservation purposes [5]. This assertion indicates that VOCs emitted from building and finishing materials are more easily accumulated inside newly-constructed residential buildings, thereby elevating indoor VOC concentrations. Major construction and finishing materials associated with VOC emissions involve floor, ceiling and wall coverings, adhesive, paint, doors, and built-in furniture. Specifically, Chino et al. [6] and Nicolle et al. [7] confirmed that various VOCs could be emitted from multiple indoor sources such as polyvinyl chloride (PVC) floor covering, adhesive, wood panel and carpets, using field and laboratory emission cell and solid-phase microextraction. Shinohara et al. [8] also reported that emission rates of toluene determined from ceiling coverings and carpets (80 and 72 μg/m2/hr, respectively) were higher than the emission rates from floor coverings (9.1 μg/m2/hr).
Exposure to VOCs with elevated concentrations in newly-constructed buildings has frequently been linked to a wide range of adverse health effects. Acute exposure to VOCs can result in irritation of eyes, nose and throat, sensory effects, damage to liver, kidneys and central nervous system, asthma exacerbation, allergy and respiratory effects [9–12]. In addition, potential chronic effects include lung, blood-related (leukemia and non-Hodgkin lymphoma), and biliary tract cancers [13, 14]. It is notable that, even though residential exposure levels to VOCs for many people are below acute and chronic guidelines, a certain group of individuals can experience much higher exposures that can exceed effect-based guidelines [15, 16]. Specifically, in the National Health and Nutrition Examination Survey, 10% of male and female adults exceeded 10 4 of lifetime cancer risks from individual exposures to airborne benzene, and 16% of adults exceeded the same risk level from chloroform exposures [17]. Therefore, a control method is necessary to lessen residents’ health risks due to exposures of indoor VOCs in newly-constructed houses. Furthermore, effective VOC control means require sufficient characteristics data due to the wide range of VOCs in new residential buildings. The present study was performed to investigate the concentrations and source characteristics of a variety of VOCs in newly-constructed residential buildings.
2. Materials and Methods
2.1. Experimental Protocol
Indoor and outdoor VOC concentrations of newly-constructed apartments were monthly measured over a 2-year period. Since indoor VOC levels in newly-constructed residential buildings can decrease due to VOC emission intensities decreases of building and finishing materials along with time [18–20], this study was repeated every month over a period of 2 years after moving in to examine a long-term VOC decay pattern. Source characteristics were determined qualitatively and quantitatively by applying measured indoor VOC concentrations to multivariable statistical models. Target VOCs were selected on the basis of their adverse health effects and prevalence in residential indoor environments [11, 21, 22].
For this study, 30 apartments of high-story buildings (defined as 15 or more stories), in which residents allowed air sampling, were investigated. A total of 30 indoor and outdoor air samples were collected every month. For comparison, seven villa-type houses were also surveyed for indoor and outdoor VOC concentrations over a 3-month period. The criteria for the selection of residential buildings were as follows: the apartment or villa-type buildings were located at least 100 m away from a major roadway in order to minimize the impact of motor vehicle emissions; the floor levels surveyed were between 5th and 15th for apartment buildings, but they were between 2nd and 5th for villa-type buildings; and the apartments had similar sizes (two or three bedrooms, one living room, and two bathrooms). In addition, the building constructions were completed within 2 5 months before starting the air sampling. For both apartment and villa-type buildings, the construction periods were determined on the basis of their construction documents. These documents also informed that the buildings were basically built with concrete and iron frames. Floor covering of these buildings involved mixed parquet, PVC and/or marble, interior wall coverings consisted of PVC and/or marble, and ceiling coverings included only PVC. In most houses, two fans have been installed in the bathroom and the kitchen, which were not operated during air sampling time. These houses had built-in wardrobes and kitchen cabinets, with similar types and dimensions. Indoor air sampling was carried out by following a pre-designed sampling protocol, which was established on the basis of the state of art principle. At the beginning of sampling procedures, all the windows and doors were left open for 1 hr for the equilibration of the indoor concentrations to the ambient concentrations. Subsequently, all the windows and doors were closed for 1 hr, but the doors between the rooms in the apartments or villa-type houses were opened to obtain homogeneous air mixing conditions within the internal space of apartments.
Indoor air samples were collected at the middle of the living room at a height of about 1.5 m from the floor level for 2 hr during the morning (06:00–12:00) or afternoon (14:00–20:00) period. Simultaneously, outdoor sampling was performed at the outdoor balcony of apartments or villa-type houses by placing the sampling traps outward the balcony and closing the window. Sampling persons were asked not to smoke during sampling to prevent interferences from tobacco smoke. In addition, residents were asked not to cook during sampling to prevent other interferences from cooking processes.
Indoor and outdoor air samples were collected on Tenax-TA adsorbent, which was contained in a 1/4 inch stainless steel tube, by drawing air a constant-flow sampling pump (Aircheck Sampler model 224-PCXR8; SKC Inc., Eighty Four, PA, USA). This sampling pump was calibrated by a mass flow meter right before and after the collection of each sample. The samples were excluded from analytical concentration data, when they departed by more than 10% from the initial flow rate. The average of these two flow rates was then utilized as the sample flow rate for air volume calculations. Air volumes of 1.1 1.5 and 1.7 2.1 L were collected for indoor and outdoor air samples, respectively, based on the optimal detection range of analytical instruments.
Selected VOC compounds were analyzed using a gas chromatograph/mass spectrometer (GC/MS) system (HP 5890-II and HP MSD5973; Hewlett-Packard, Palo Alto, CA, USA) or a GC/flame ionization detector (FID) system (HP 7890; Hewlett-Packard) coupled to a thermal desorption system (ATD 400; PerkinElmer, Waltham, MA, USA). The target VOCs consisted of ten aromatic, ten aliphatic and seven chlorinated hydrocarbons, and three terpene compounds, which were listed in Table 1. The GC/FID system was the primary analytical instrument, while the GC/MS was employed for the confirmation of GC/FID results. Qualitative analysis of each compound was conducted using its retention time and/or mass spectra (Wiley 275 software library). For the quality control procedure of VOC measurements, laboratory and field blank adsorbent traps, along with spiked samples, were analyzed. External VOC standards were analyzed daily to check the quantitative response of GC/FID and/or GC/MS. Laboratory and field blank adsorbent traps obtained from each analytical batch were analyzed to check for any trapped contamination. No trapped contamination was observed. Seven adsorbent traps spiked with known amounts of the target VOCs were analyzed to determine the method detection limits (MDLs) of the analytical system, which were ranged 0.2 1.3 μg/m3.

Summary of indoor volatile organic compound (VOC) concentrations (μg/m3) determined in newly-constructed apartments according to post-occupancy months
2.2. Statistical Methods
The measured VOC concentrations were statistically analyzed by utilizing the Statistical Analysis System (SAS) ver. 9.1 (SAS Institute Inc., Cary, NC, USA). On the basis of log-transformed data, the paired sample means of indoor and/or outdoor air concentrations were analyzed by using a paired t-test. The concentration differences between log-normally distributed data were analyzed using a nonparametric test (Wilcoxon rank-sum test). The criterion for statistical significance of the comparisons was p < 0.05. A varimax-rotated principal component analysis (PCA) technique was applied to determine potential sources of the target VOCs measured inside apartments, but not villa-type houses due to limited number of samples. The PCA variables were perceived as the major common causes of the interrelation and changes in the apartment VOC concentrations. For the target compounds that were measured below the MDL, one half of the value of the MDLs were assigned to their VOC concentration. Factor loadings with absolute values ≥0.5 were reported as influential factors and factors with eigenvalues ≥1 were interpreted as of statistical significance. In addition, absolute principal component analysis (APCA) was performed to estimate the weight of the potential sources determined by the PCA technique. The source weights were the absolute contributions of the sources to the collected VOCs. For this APCA process, the absolute factor score (AFS) was the concentration time trend of the potential source apart from a multiplicative coefficient [23]. The absolute weight of each source for each sample was determined by a multiple linear regression process, with AFSs and VOC mass concentrations as independent variables and dependent variables, respectively.
3. Results and Discussion
Indoor and outdoor concentrations of selected VOCs were determined in newly-constructed apartments over a 2-year period after moving in for the investigation of a long-term change in VOC concentrations. A normality test indicated that the measured VOC data were log-normally distributed, with mean values higher than median values. Therefore, median values were considered as representative VOC concentrations. The statistics of indoor VOC concentrations, which were classified by six months over the 2-year period, are shown in Table 1. The long-term change in indoor VOC concentrations depended on the type of VOCs. Generally, aromatic (except for naphthalene), aliphatic, and terpene compounds exhibited a gradual deceasing trend over the 2-year follow-up period. Specifically, the median toluene concentration, which revealed the highest indoor concentration among the target VOCs, decreased from 87 μg/m3 for the first six months to 30 μg/m3 for the last six months. Similarly, previous studies [1–3] reported that many VOC concentrations measured in newly-constructed residential buildings decreased as time passed over specified periods. Moreover, the indoor VOC concentrations determined in the present study decreased sharply within the first year and then smoothly during the next year. These descending trends were primarily ascribed to gradual decreases in VOC emission strengths of important indoor sources such as building finishing materials and furniture over time [18–20]. This assertion is supported by the ratios of indoor to outdoor VOC concentrations shown in Table 2. The ratios of median indoor to outdoor concentrations of the three VOC groups (aliphatic, aromatic, and terpene compounds) were much higher than 1 over the entire follow-up periods, indicating that the indoor concentrations were higher than outdoor concentrations. In particular, the median indoor concentration of aromatic compounds was 5 times higher than the median outdoor concentration. These findings confirmed that the elevated indoor VOC concentrations were primarily due to emissions from indoor sources including building materials and/or furniture for those VOCs, rather than penetration of outdoor VOCs into the interiors of apartments. In consistent with the indoor concentration trend, the ratios of indoor to outdoor concentrations exhibited a descending trend with the change of time. These results suggested that, relative to the indoor concentrations, the outdoor VOC concentrations did not substantially vary with time changes.

Ratios of median (geometric standard deviation) indoor-to-outdoor concentrations of four volatile organic compound (VOC) groups determined in newly-constructed apartments according to post-occupancy months
Table 1 also shows that, in contrast to the three VOC groups (aliphatic, aromatic, and terpene compounds), the indoor concentrations of the six halogenated VOCs (carbon tetrachloride, chloroform, 1,2-dichloroethane, 1,2-dichloropropane, perchloroethylene, and 1,1,1-trichloroethane) did not significantly vary with time changes. These findings suggested that no notable sources for the halogenated VOCs would be present in the apartments, and that there would be common sources for the indoor and outdoor concentrations of these compounds. This assertion is supported by the finding that the indoor concentrations of those halogenated VOCs were similar to the outdoor concentrations, suggesting that the indoor concentrations resulted from penetration of outdoor compounds. Outdoor halogenated VOCs primarily result from industrial processes such as petroleum refinery, storage and transportation, water and waste water treatment plants, municipal solid waste storage, and commercial which are used as solvents and degreasing agents [24–29]. In particular, chloroform is generated during the water-disinfection processes and emitted to the ambient air from drinking- or waste-water treatment plants [25]. As such, the indoor concentrations of the six halogenated VOCs were ascribed to the penetration of outdoor compounds into the interiors of apartments.
Similar to six halogenated VOCs mentioned above, the indoor naphthalene concentrations did not vary significantly with time changes over the 2-year period (Table 1). However, the indoor naphthalene concentrations were much higher than the outdoor concentrations (Table 2), which was not consistent with that of indoor halogenated VOCs. These results indicated that there would be indoor naphthalene sources, but not building finishing materials or furniture inside apartments, for which emission strengths could have decreased with time changes. According to other researchers [30, 31], indoor naphthalene emissions could be assigned to a range of indoor activities, such as the use of mothballs as a moth repellent and smoking. For the current study, apartment inhabitants did not smoke in their apartments during indoor air sampling. Meanwhile, the use of mothballs was observed in several apartments, indicating that the use of mothballs could have elevated indoor naphthalene levels inside the surveyed apartments. Nevertheless, the continuous use of mothballs did not result in any significant long-term variations in indoor naphthalene concentrations.
Table 3 compares the median indoor concentrations of four VOC groups (aliphatic, aromatic and chlorinated VOCs, and terpenes) standardized by the number of chemical species in each VOC group between newly-constructed apartments and villa-type houses. The differences in the median indoor concentrations between the two types of houses depended on the target compounds. In particular, the standardized median concentrations of aliphatic and aromatic compounds were higher for the villa-type houses when compared to those of apartments. These results were ascribed to higher emission strengths of those compounds in the villa-type houses. This explanation is supported by the finding that the median indoor-to-outdoor concentration ratios of aliphatic and aromatic compounds for the villa-type houses were higher than those of apartments. Thus, emission strengths of those compounds would be more closely associated with inhabitants’ life style rather than building finishing materials In addition, these results were likely to be ascribed to higher emission strengths of the compounds in the villa-type houses. This explanation is supported by the finding that the median indoor-to-outdoor concentration ratios of aliphatic and aromatic compounds for the villa-type houses were higher than those of apartments. Meanwhile, the standardized median concentrations of chlorinated and terpene compounds were similar for the villa-type houses and apartments. The similarities for chlorinated compounds are due to similar indoor-to-outdoor concentration ratios of such compounds. In addition, the similarity for terpene compounds were attributed to the emissions from household products, which are major indoor sources for these compounds [32–35].

Comparison of median indoor concentrations (μg/m3) standardized by the number of chemical species in each volatile organic compound (VOC) group and median indoor-to-outdoor concentration ratios of four VOC groups between newly-constructed apartments and villa-type houses
The characteristics of indoor VOC sources were determined by linking indoor VOC concentrations measured in the selected apartments to PCA and APCA methods. Any outliers with extremely high or low concentrations were not included in the statistical data in order to establish a stable PCA/APCA result. The target compounds with lower detection frequencies (<60%) were also not included to the statistical data set. Table 4 represents the results for multivariable analysis and potential sources of selected compounds determined inside apartments over the first-year post-occupancy stage. The target compounds with high loadings for each factor were considered as representative species of each potential indoor source, which were linked to possible VOC source profiles. For the first-year post-occupancy stage, four factors that revealed 77% of the total variance were extracted. Three target compounds (benzene, n-tetradecane, and n-pentadecane) exhibited high loading values on more than one factor, suggesting the presence of more than one source for those species. Regarding the first factor (Factor1) that accounted for 47% of the total variance, high loadings were appeared for 20 of 30 VOCs. According to Wilke et al. [36], 12 compounds (benzene, styrene, toluene, 1,2,4-trimethylbenzene, 1,3,5-trimethylbenzene, 1,2,3,5-tetramethylbenzene, m-xylene, o-xylene, n-dodecane, n-tridecane, n-tetradecane, n-hexadecane) were emitted from vinyl and linoleum floorings. In addition, other studies [34, 37] reported that three aliphatic compounds (n-heptane, n-octane, and n-nonane) were the most abundant chemicals emitted from oil paints. Accordingly, Factor1 was ascribed to the combined sources of floor coverings and apartment interior painting. The second factor (Factor2) accounted for 17% of the total variance and revealed high correlations for three compounds (benzene, n-nonane, and n-tetradecane), which were attributed to emissions from household products such as all-purpose cleaners, glass and surface cleaners, and/or lemon fresh and antibacterial sprays [33, 34]. The third factor (Factor3) explained 8% of the total variance with a high factor loading for three compounds (n-nonane, limonene and α-pinene), which were associated with emissions from wood paneling and furniture [1, 7, 32]. The last factor (Fac-tor4) accounted for 5% of the total variance and was dominated by three VOCs (naphthalene and p-dichlorobenzene). The major residential indoor naphthalene sources include mothball usages and tobacco smoking, where the naphthalene was a major constituent of mothballs [30]. Since smoking was not observed during the sampling periods, the elevated indoor naphthalene concentrations were ascribed to mothball uses. In addition, p-dichlorobenzene has been used as a moth repellent in several countries for decades and the use of moth repellents was a major cause of high indoor air concentrations in residential buildings [3, 8]. Accordingly, Factor4 was assigned to moth repellent usages in the apartments.
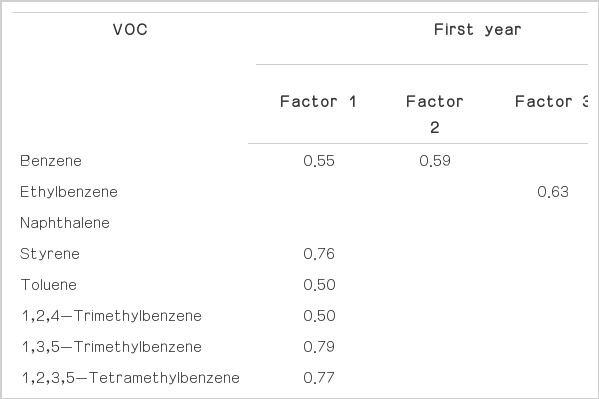
Results for multivariable analysis of indoor volatile organic compounds (VOCs) in apartments for the first-and second-year post-occupancy stages
For the second-year post-occupancy stage, three factors that revealed 78% of the total variance were extracted (Table 4). Similar to the first-year post-occupancy stage, in the first factor (Factor1) that accounted for 48% of the total variances, high loadings appeared for 21 out of 30 VOCs. Therefore, the Factor1 was ascribed to combined sources of floor coverings and apartment interior painting. The Factor2 accounted for 26% of the total variance and revealed high correlations for two compounds (n-nonane and n-tetradecane), which were attributed to emissions from household products. The Factor3 accounted for 4% of the total variance and was dominated by two VOCs (naphthalene and p-dichlorobenzene), which were attributed to emissions from moth repellents. Unlike the first-year post-occupancy stage, the wood paneling and furniture were not major indoor VOC sources for the second-year post-occupancy stage. These results were likely to be from diminishments in the emission strength of building finishing materials as time passes [19, 20].
Relative contributions of potential indoor VOC sources determined by the PCA analysis were calculated using the APCA process. Fig. 1 shows the relative proportion of each source to the overall VOCs inside the apartments. The source weights were represented as the concentrations and the relative source contributions. The floor covering and interior painting contributed more than 5 and 14 times to indoor VOC concentrations than the lowest emission sources (moth repellents) for the first- and second-year post-occupancy stages, respectively. The indoor VOC contributions of the second highest source (household products) occupied 26% and 27% for the first- and second-year post-occupancy stages, respectively. Guo [38] have reported that estimated contribution of building finishing materials in Hong Kong homes was approximately 76% of indoor VOCs, whereas that of household products comprised of 24%. In addition, Zuraimi et al. [32] and Park and Ikeda [3] have also found that building materials and household products was a major source of indoor VOCs in residential buildings. These reports indicated that source contributions for indoor VOC concentration levels would differ according to countries.

Relative contributions of potential sources of indoor volatile organic compounds in apartments for the (a) first- and (b) second-year post-occupancy stages.
4. Conclusions
In the present study, a long-term investigation was conducted for indoor VOC concentrations after moving into newly-constructed apartments and indoor source characteristics. The indoor concentrations of VOCs that were closely associated with emissions from building finishing materials and furniture revealed a decreasing tendency over the 2-year follow-up period, whereas those of other VOCs that were closely associated with emissions from household product did not exhibit any temporal dependency. Specifically, the indoor concentrations of toluene, which was considered to be emitted from a variety of building materials, decreased gradually with time, whereas the indoor concentrations of naphthalene, which was considered to be mainly emitted from mothballs, did not. The decreasing trend for indoor concentrations of several VOCs was ascribed to the decrease in the emission strength of building materials. It was also suggested that no notable sources for several halogenated VOCs would be present in the apartments, and that there would be common sources for the indoor and outdoor concentrations of these compounds. In addition, the four source groups (floor coverings and interior painting, household products, wood paneling and furniture, and moth repellents) and three source groups (floor coverings and interior painting, household products, and moth repellents) were considered as potential VOC sources inside apartment buildings for the first- and second-year post-occupancy stages, respectively.
Acknowledgments
This work was supported by the National Research Foundation of Korea grant funded by the Korean government (No. 2010-0002506 and No. 2011-0027916).