Facile, green approach for aqueous methylene blue dye adsorption: Coconut vinegar treated Trema orientalis wood biochar
Article information

Abstract
Biochar is widely utilized in low-cost water treatment. However, chemicals used in most of the recorded activation techniques are corrosive, may cause secondary pollution, and not accessible by rural communities, reducing their value of being cost-effective. In this study, Trema orientalis wood biochar (WB) was successfully activated with natural coconut vinegar employing a facile technique to produce a green adsorbent for efficient aqueous methylene blue (MB) removal. Batch studies showed a three-fold higher MB adsorption capacity of coconut vinegar treated wood biochar (CVWB) compared to WB. Percentage removal ranged between 98-79% at lower dye concentrations (50–100 mg/L) and 79-48% at higher dye concentrations (100–300 mg/L). Isotherm data best fitted to the Freundlich model. Kinetic data fitted to both pseudo second order and intraparticle diffusion models, suggesting that the adsorption was governed by a pore filling mechanism with predominant electrostatic attractions, and the reaction rate was diffusion controlled. FTIR, XPS, and water contact angle measurements confirmed increased surface oxygenated groups of CVWB. XPS showed a three-fold increase in O/C atomic ratio. BET and AFM studies gave evidence to the increased porosity. Therefore, the enhanced MB adsorption capacity of CVWB was attributed to both the increased surface oxygenated functional groups and porosity.
Abstract
Graphical Abstract
1. Introduction
Surface water remains the only source of drinking water for many communities around the world. Many industrial and agricultural wastes are directly discharged into surface water bodies, ultimately causing severe health hazards to consumers. Sophisticated technologies such as photochemical oxidation, membrane filtration, ion exchange, reverse osmosis, electrochemical treatment, ozonation, etc., have been utilized for water purification with varying degrees of success [1,2]. However, these techniques’ high start-up and operational costs have become barriers for rural communities to access purified water.
Biochar is a porous carbonaceous material mainly derived from the thermal decomposition of lignocellulosic biomass under an oxygen-deprived environment known as pyrolysis. It is one of the most popular options for low-cost water remediation owing to its excellent adsorption capacity, availability, and relatively facile operation. Many studies have focused on introducing different types of biochar to remove various potential toxic elements in water bodies [3,4]. The properties of biochar vary significantly with feedstock type, pyrolysis conditions, and any activation performed [5]. Feedstock should be inexpensive or abundantly available, while the produced adsorbent should have the optimum porosity and surface functionality to adsorb the targeted pollutant [6]. Activation refers to enhancing the adsorption capacity of the adsorbate for a selected adsorbent through either physical or chemical methods. The activation introduces new surface functional groups or alters the existing ones, may remove trapped impurities during the pyrolysis, and enhance porosity, leading to a larger surface area. However, physical activation employs energy-consuming conditions such as high pressure and temperature. Hence, chemical activation has become the most widespread technique [7]. Chemical activation usually involves strong acids and bases, which sometimes eventually decreases the yield by adversely affecting the digestion of the carbonaceous feedstock [8]. Salts and organic acids were also widely used elsewhere [9, 10]. Nevertheless, these chemicals used in biochar activation are not accessible to rural communities, are unfavoured due to their corrosiveness, need skilled personnel to handle the procedures, and may even cause secondary pollution. Thus, the importance of finding natural activating agents for biochar, which are safe to handle and attainable for rural communities, was identified [11,12].
Natural coconut vinegar is mainly utilized as a food additive. It is obtained by the fermentation of the sap of coconut blossoms, where ethanol undergoes oxidation to form acetic acid without any preservatives or chemicals. Natural coconut vinegar is ~4% acetic acid in water with an approximate pH of 2.5 [11,12]. Trema orientalis is a tropical tree with light wood, soft foliage, and a rapid growth rate which is amply available in Africa and Asia. This shade tree is also known as the “charcoal tree,” as villagers have extensively used it for ages as a source of charcoal for firewood, fireworks, and gunpowder [13].
MB is one of the most typical dyes used in textile and paper printing industries which is present in waste discharged into water streams. However, for this study MB was used as an indicator to identify possible mechanisms of vinegar-treated biochar to remove potentially toxic compounds in water. MB is composed of an aromatic core and polar/ionic groups with similar structural properties to a wide range of toxic organic compounds in water bodies such as dyes, pesticides, pharmaceuticals, and harmful poly aromatic hydrocarbons [14]. Biochar derived from pyrolysis at low temperatures has numerous oxygenated surface functionalities, while biochar derived from pyrolysis at elevated temperatures consists of more ordered, highly porous, and graphitized aromatic structures [15]. However, treatments employing high temperatures are not easily accessible in the household environment. In addition, the low yield and high energy consumption during the process subdue the advantage of the cost-effectiveness of biochar. Considering the merits and demerits mentioned above, the pyrolysis of Trema orientalis wood was performed at 300°C in this study [12].
The aim of this study was to produce a green adsorbent for efficient removal of potential toxic compounds in an aqueous medium, employing a facile technique, which can be even prepared at a domestic environment. Hence, this study was designed to examine the ability of natural coconut vinegar, a common mild acid, in activating pyrolyzed (low temperature, 300°C) Trema orientalis wood biochar to be used in aqueous methylene blue (MB) removal.
2. Materials and Methods
2.1. Materials
Natural coconut vinegar was manufactured by C. D. De Fonseka and Sons (Pvt) Ltd., Sri Lanka. Methylene blue powder was purchased from Shanghai Titan Technology Co., Ltd., China. HCl and NaOH were purchased from Sisco Research Laboratories (Pvt) Ltd., India. Matured Trema orientalis wood was collected from two different sites at Dodangoda (6.5522880, 80.0611704) and Horana (6.7173100, 80.0715334), situated in the Western province, Sri Lanka.
2.2. Preparation of Biochar
Matured Trema orientalis wood was cut into small pieces and sun-dried. Dried wood pieces were slow pyrolyzed (300°C, 2 h) under limited oxygen conditions in a household kiln. Pyrolyzed product was washed with deionized water, dried in an oven (80°C, 12 h), and ground to powder (< 0.5 mm) [12]. It was tagged as WB. For the activation, WB was soaked in natural coconut vinegar overnight (biochar/vinegar, 1:2 V/V). Next, the soaked WB and vinegar mixture (5 g) was heated on a hot plate (200ºC, 3 h) in a covered crucible, allowed to boil, and kept until completely dried with occasional stirrings. The dried product was allowed to cool to room temperature, washed with deionized water, and dried in an oven (80°C, 12 h). The product was tagged as CVWB and stored in sealed containers until use.
2.3. Biochar Characterization
Attenuated total reflectance Fourier-transform infrared spectroscopy (FTIR-ATR; PerkinElmer Spectrum Two L160000A, USA) analysis was conducted to identify surface functional groups of biochar in the scanning range of 700–4000 cm−1. X-ray photoelectron spectroscopy (XPS; Thermo Scientific ESCALAB Xi+, USA) was utilized to examine the surface composition of biochar. Samples were pasted and compressed onto the sample stub using carbon tapes prior to the analysis. XPS data were deconvoluted using “Casa XPS” software. Surface area and pore size distribution were analyzed using N2 adsorption/desorption isotherms with an automated gas sorption analyzer (Quantachrome autosorb iq analyser with ASIQwin software, USA). Samples were degassed (110 ºC, 4 h) before the analysis. Multi-point BET analysis was used to calculate the surface area of the samples on the basis of monolayer coverage. BJH method was used to determine pore size distributions. Atomic force microscopy (AFM; Park Systems XE 100 Atomic Force Microscope, Korea) was used to study the surface topology. Sample suspension made in ethanol was sonicated (15 min.) and drop cast on a mica sheet to get a thin film of the sample. It was analyzed using tapping mode with a fixed scanning rate of 1 Hz. 3D images of the surface topology were created using “Gwyddion” software. The wettability of biochar was assessed by the sessile drop method [16]. To determine the contact angle, a double-sided adhesive tape was pasted on a glass slide and covered with a thick layer of biochar (<0.5 mm). It was pressed with another glass slide. Deionized water droplets (30 μL) were delivered from a micropipette which was held above and very close to the slide. Images of the water droplets were captured with a digital microscope fixed in front of the slide to view the contact angles of the droplets using “HiView” software. Change of contact angles with time was recorded. This was repeated with five droplets for both WB and CVWB.
2.4. Adsorption Equilibrium Tests
MB concentration in solutions was determined by measuring the absorbance at 663 nm wavelength using a UV visible spectrophotometer (UV/VIS; PerkinElmer Lambda 365, USA). A stock solution of MB (1000 mg/L) was used to prepare 20, 50, 100, 150, 200, 300 and 350 mg/L solutions. NaOH and HCl solutions (0.1 M) were used to adjust the pH of the solutions. Adsorption capacity and removal percentage were calculated using Eq. (1) and Eq. (2), where Co is the initial MB concentration, Ce is MB concentration at the equilibrium, m is the mass of the adsorbent, V is the volume of the MB solution.
To determine the effect of adsorbate dose towards the adsorption, a series of MB solutions (100 mg/L, 10 pH, 25ºC) were prepared by adding different amounts of biochar (2.5, 5.0, 10.0 g/L) and kept in an orbital shaker (80 rpm, 12 h). The effect of pH on the adsorption was examined using the selected biochar dose (2.5 g/L) and MB solutions (100 mg/L, 25ºC) prepared at different pH values (pH 2, 4, 6, 8, 10). Suspensions were kept in an orbital shaker (80 rpm, 12 h). Batch studies for isotherm and kinetic modeling were carried out at selected conditions (2.5 mg/L, pH 10, 25ºC). For kinetic studies, prepared solutions (100 mg/L) were kept in the orbital shaker for different time periods (80 rpm; 1, 3, 5, 12 h). For the isotherm studies, solutions with varying concentrations of MB (20, 50, 100, 150, 200, 300, 350 mg/L) were kept in the orbital shaker (80 rpm, 12 h). After incubation, solutions were filtered through nylon syringe filters (0.45 μm), and absorbance (663 nm) was measured by the UV visible spectrophotometer. MB adsorption capacity and the removal percentage of each sample were calculated.
To determine the reusability of CVWB, adsorption of MB was repeated for three cycles after washing the adsorbent with 95% ethanol followed by washing with deionized water. CVWB was allowed to equilibrate (10.0 g/L) in an orbital shaker (80 rpm, 12 h) with MB (100 mg/L). After incubation, adsorbent was separated via centrifugation and the supernatant was replaced by 95% ethanol. The mixture was kept in an orbital shaker (200 rpm, 2 h). Adsorbent was again separated via centrifugation and washed with deionized water. It was dried (80 ºC, 12 h) and the adsorption was repeated for three cycles under the same conditions.
2.5. Column Study
CVWB (<0.5 mm, 1.0 g) was packed into a laboratory-scale filter unit (diameter 2 cm). Initially a 10.00 mL portion of MB solution (10 mg/L, 10 pH) was added to wet the column. Then, 5.00 mL portions of MB solution (10 mg/L, 10 pH) was added and allowed to pass through the column with a flow rate of 1 mL/min and the effluent (5.00 mL) was collected. This was continued until 75 mL (5.00 mL x 15 portions) of effluent was collected. Then, the concentration of influent MB solution was increased to 25 mg/L and the same process was continued to collect another 75 mL of effluent. The same process continued with a 100 mg/L MB solution. Absorbance of each collected portion of effluent (5.00 mL) was measured at 663 nm using UV visible spectrophotometry. Results were used to calculate the MB adsorption capacity of the column.
3. Results and Discussion
3.1. Characterization of the Adsorbent
3.1.1. FTIR analysis
Surface functional groups play a significant role in enhancing the adsorption efficiency of the biochar by electrostatic attractions, ion exchange reactions, π–π interactions, and by surface precipitations [4]. Further, oxygenated functional groups increase the surface hydrophilicity of biochar, enhancing its affinity to water and facilitating aqueous contaminants sorption [17]. WB and CVWB were examined by the FTIR-ATR technique (Fig. 1) to identify their surface functional groups.
FTIR-ATR analysis of WB and CVWB
In general, both spectrums showed the presence of similar functional groups. However, a slightly enhanced peak at 1695 cm−1 pertaining to C=O stretching vibrations of carbonyl/carboxylic/ester/lactone groups in CVWB spectrum was significant. Further, the spectra evident the presence of O-H bending (700–900 cm−1), aromatic C–O stretching (1020 cm−1), phenolic O-H bending (1370 cm−1), and aliphatic C-H deformations (1440 cm−1). The peak at 1200 cm−1 was identified as phenolic/carboxylic C-O stretch and O-H deformations. The peak at 1590 cm−1 was identified as aromatic C=C ring stretching vibrations. The broad peak at 3300 cm−1 represents the stretching vibrations of the O-H groups of water/carboxylic acids/phenols/alcohols. The small and sharp peak at 2350 cm−1 points to CO2 stretching caused by molecules adsorbed to the surface [18–20]. This analysis shows the retaining of oxygenated functional groups on the biochar surface after the activation process. The spectra measured with multiple-reflection FTIR-ATR show only noise in the 1900–2700 cm−1 region due to the high absorbance of diamond lattice in that region [21]. Similar bands in this region were observed in the reported work by Sajjadi et al. [22]. As the FTIR spectroscopy allows only qualitative detection of functional groups, further examination was performed with XPS for quantitative estimation of the surface functionality of both WB and CVWB.
3.1.2. XPS analysis
According to the XPS analysis, the surface elemental composition of C 1s and O 1s of WB were 90.35, 9.65% and the same of CVWB were 74.89, 25.11% respectively (Fig. 4(c)). O/C atomic ratio showed a three-fold increase from 0.11 to 0.34 after the vinegar treatment indicating a significant increase in the oxygenated surface functional groups on CVWB. The distribution of these functional groups on the biochar surface was further estimated with a curve fitting method (Fig. 2) and listed in Table 1. Deconvoluted C 1s spectra indicated the binding energies of four different carbon types at 284.8, 285.8, 286.9, and 288.7 eV, which can be assigned to C-C/C-H, C-O, C=O, and COO functionalities respectively. After the activation, the relative content of C-C/C-H decreased, and that of C-O/O-H and C=O were significantly increased. The peak at 293.5 eV was related to π–π interactions [23]. Consistent with the above results, the deconvoluted O 1s spectrum of CVWB also exhibited two peaks at 531.5 and 532.8 eV, the binding energies corresponding to C=O and C-O/O-H respectively [24], with a relatively higher content of C-O/O-H. The results suggest possible acid-catalyzed hydration of the C-O-C bridges of cellulose and hemicellulose of the biochar, introducing new hydroxyl and carbonyl/lactone/ester/carboxylic groups upon vinegar activation.

(a) N2 adsorption data (b) Pore size distribution with magnified inset (c) Atomic percentages of C1s and O1s b XPS. SEM images of (d) WB at magnification 1000x (e) WB at magnification 800x (f) CVWB at magnification 1000x (g) CVWB at magnification 800x. De-ionized water droplets on (h) WB after 1 min. (i) WB after 20 min. (j) CVWB after 1 min. (k) CVWB after 5 min.
XPS spectra of (a) C1s WB (b) C1s CVWB (c) O1s WB (d) O1s CVWB

XPS analysis of WB and CVWB
3.1.3. AFM
The surface area of the adsorbent is another primary factor considered in this study. The AFM topography images of WB and CVWB showed in Fig. 3 also exhibit an increase in surface area after the vinegar activation. In contrast to WB, the surface of CVWB was highly porous. According to the topology analysis parameters summarized in table 2, the CVWB showed a larger mean roughness value (Ra) of 3.511 nm, while that of WB is 1.079 nm. Further, the roughness parameters of skewness (Rsk) and kurtosis (Rku) coefficients of WB and CVWB calculated were 10.54, 142.6, and 2.92, 19.75, respectively. Kurtosis exhibits whether the data are heavy-tailed or light-tailed with compared to a normal distribution. A data set with high kurtosis tends to have heavy tails or outliers [25]. The WB shows higher values for both skewness and kurtosis, suggesting the presence of a few isolated spikes and pits on the surface. In comparison, lower values of the CVWB suggest a more uniform distribution of spikes and pits on the surface.

AFM topography images (a) WB (b) CVWB (c) 3D image of WB (d) 3D image of CVWB
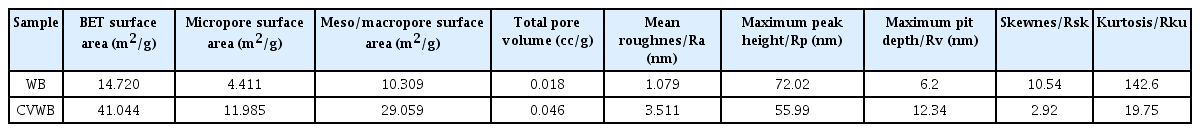
Surface area and roughness parameters of WB and CVWB
3.1.4. BET analysis
Being consistent with the AFM results BET analysis also shows the increased porosity of WB upon activation. N2 adsorption/desorption of WB and CVWB are shown in Fig. 4(a). Both the WB and CVWB confirmed the type II isotherm behavior defined by the International Union of Pure and Applied Chemistry (IUPAC). The shape of the graph has resulted from unrestricted monolayer/multilayer adsorption. Pore volumes of WB and CVWB including BET surface area, micropore surface area, and mesopore/macropore surface area, were calculated using BET and BJH isotherm models (Fig. 4(b)) and the values are shown in Table 2. The BJH method is based on the Kelvin model of pore filling and hence applies only to the mesopores (1–25 nm pore radius) and small macropores (up to 150 nm pore radius). The surface area of micropores was obtained by subtracting BJH surface area from BET surface area [26]. CVWB showed a 2.8-fold increase in BET surface area, a 2.7-fold increase in the micropore surface area, and 2.8-fold increase in the mesopore/macropore surface area compared to WB, increasing available space for MB sorption.
3.1.5. SEM
The SEM images (Fig. 4) do not show significant changes in the macroporous surface of the biochar after the activation. This could be due to the mild activation conditions utilized with a mild acid at low temperatures. Some of the activation conditions reported elsewhere, including strong acids/bases and higher temperatures, caused partial destruction of the porous structure of the biochar surface, reducing its reactive surface area when conditions are not optimized [15, 8].
3.1.6. Wettability properties analysis
Images of deionized water droplets on WB and CVWB are shown in Fig. 4. After 1 min from the application of the droplets, the contact angles shown by WB and CVWB were in the range of 102–113º and 30–62º, respectively. Although all the droplets on the CVWB tended to disappear in 5 minutes, the droplets on WB remained still even after 20 min and showed a slight reduction in their contact angles (100–109º). These results indicate the surface of CVWB is hydrophilic while that of WB is hydrophobic. When a material surface is hydrophobic, its dispersion in aqueous solutions is limited, and it tends to be coated by an air jacket preventing the adsorption of molecules on its surface. Potential reasons for the high hydrophobicity of WB could be the condensation of tars of aliphatic and aromatic volatiles on the biochar surface and clogging of the pores during the low-temperature pyrolysis process. These volatiles could be removed during the activation process making the adsorbent surface significantly hydrophilic [27]. Other important reasons behind the hydrophilic nature of CVWB were, improved surface oxygenated functional groups and surface porosity. Oxygenated functional groups directly enhance the interactions with water via electrostatic bonds [28].
3.2. Effect of Adsorption Conditions on the Adsorption Capacity
In batch studies, CVWB showed a significant three-fold higher MB adsorption capacity compared to WB at 100 mg/L initial MB concentration, 10 pH, 2.5 g/L adsorbent dose, and at 12 h contact time. MB adsorption capacities of both WB and CVWB with respect to various adsorbent doses (100 mg/L MB concentration, 10 pH, 12 h) were shown in Fig. 5. According to the results, MB removal percentage of WB and CVWB increased from 25 to 41% and 79 to 99%, respectively, with the increasing adsorbent dose from 2.5 g/L to 10 g/L. However, the MB adsorption capacity (Qe) decreased in turn from 10.05 to 4.14 mg/g and 31.81 to 9.87 mg/g, respectively, with increasing adsorbent dose, implying that the saturation of the adsorbent was limited at higher adsorbent doses. This means, the number of MB molecules present were insufficient for complete coverage of the adsorbent surface and possible aggregation of particles causing increased diffusional path lengths. Adsorption data of WB are associated with higher error values with compared to CVWB. This could be attributed to the high hydrophobicity of WB particles causing occurrence of uneven aggregates and floating.

(a)(b) Effect of pH on MB adsorption (dose 2.5 g/L, MB 100 mg/L, 25°C) (c)(d) Effect of adsorbent dose on MB adsorption (MB 100 mg/L, pH 10, 25°C) (e) Column test data of CVWB (f) Image of the effluents collected from CVWB column
The pH is another critical parameter in adsorption processes as it directly affects the state of an adsorbent’s surface charges, influencing the adsorbent’s affinity towards the adsorbate. The effect of pH on MB adsorption at different pH values of 2, 4, 6, 8, and 10 (100 mg/L MB concentration, 2.5 g/L, 12 h) was shown in Fig. 5. Results showed that in WB, adsorption of MB significantly increased with the pH up to 6 and thereafter slightly increased to 10; in CVWB, adsorption rapidly increased up to 8 and thereafter slightly increased to 10. For both WB and CVWB, maximum removal was obtained at the pH of 10. This gives evidence that the MB adsorption mechanism is driven by electrostatic attractions. At low pH conditions, a lower MB adsorption was recorded, as the protonation of negatively charged surface functional groups and the competition of H+ with MB molecules for the negative active sites. Thus MB, the cationic dye, will get electrostatically repulsed, lowering the adsorption of MB. At higher pH conditions, a significant enhancement of the adsorption was observed by the increase of electrostatic attraction between the deprotonated, negatively charged surface functionality of the adsorbent and MB. Considering above results, further adsorption experiments were conducted using a 2.5 g/L adsorbent dose at pH 10 and allowing 12 h of reaction time.
The effect of initial MB concentration on adsorption onto CVWB was examined using a series of MB solutions with initial concentrations ranging from 20–350 mg/L (Fig. 6(b)). After incubation with biochar, MB was not detected in the 20 mg/L solution (LOD= 1 mg/L) suggesting complete removal of MB. Further, after 300 mg/L, adsorbed MB amount seems to remain constant due to the surface saturation of the adsorbent. The Qe increased from 19.64 to 58.28 mg/g and removal efficiency decreased from 98 to 48 % for the MB solutions of 50–300 mg/L with increasing initial concentration. MB removal of CVWB ranged between 98-79% at lower dye concentrations (50–100 mg/L) and 79-48% at higher dye concentrations (100–300 mg/L). Higher adsorbent concentrations favor the interactions between the adsorbent and the adsorbate while overcoming the mass transfer resistance between the aqueous and the solid phase, and results in high adsorption capacities. However, the percentage removal of MB was reduced at higher MB concentrations as the number of molecules per unit volume of the adsorbent increased. The upturn in adsorption efficiency was gentle during 60–180 min of contact time and further increased with longer exposure, up to 720 min (Fig. 6(a)), allowing adsorbate molecules to reach deeper pores through pore diffusion. Similar variations were observed in MB adsorption of several modified biochar types by Liu et al. [29] and Zhu et al. [30].
Effect of (a) time and (b) initial MB concentration on MB adsorption. Adsorption isotherm and kinetics models (c) Langmuir (d) Freundlich (e) Pseudo-first order (f) Pseudo-second order (g) Intraparticle diffusion. (h) Chemical structure of MB molecule
Column study of CVWB showed a MB adsorption capacity of 7.53 mg/g with a flow rate of 1 mL/min. Regeneration studies showed that, MB removal percentage of CVWB was reduced from 98 % (initial) to 95% at the second cycle and remained at 94% at the third cycle. The slight reduction of the removal percentage could be due to the filled active sites which were not restored in the regeneration process. However, even after three cycles, the CVWB exhibited a good adsorption performance, indicating its ability to reuse as a cost-effective adsorbent.
3.2.1. Adsorption isotherms and kinetics
Adsorption equilibrium data were fitted into Langmuir (Fig. 6(c)) and Freundlich (Fig. 6(d)) isotherm models. The Langmuir isotherm model assumes that the adsorbent surface is homogenous with respect to the active sites where every molecule adsorbs onto the adsorbent surface with the same energy, and thus, the adsorption terminates after forming a monolayer. For this study, the linear derivative of the Langmuir model shown in Eq. (3) was used, where Qe is the adsorbed amount at equilibrium, Qm (mg/g) is the maximum adsorption capacity of the adsorbent, b is the Langmuir constant, and Ce (mg/L) is the concentration of the adsorbate in the solution at equilibrium.
The Freundlich isotherm model assumes the presence of heterogeneous active sites and multilayer adsorption. The linear derivative of the Freundlich model shown in Eq. (4) was used in this study, where Kf is the Freundlich equilibrium constant, and n is a factor indicating the heterogeneity and the intensity of the adsorption.
The best correlation coefficient (R2) of 0.9258 was aroused by the Freundlich model, indicating that the adsorption data follows the Freundlich model over the Langmuir model. Further, it was notable that the data were consistent with the Langmuir model at low concentrations (50–100 mg/L), showing the scattered distribution of the adsorbents at the initial stage, forming a monolayer via chemisorption. The Freundlich constants Kf and n were calculated as 19.23 mg/g and 5.34 L/mg, respectively. When n = 1, it indicates linear adsorption due to identical adsorption energies for all the active sites, while n <1 signifies the adsorption through chemisorption and n >1 signifies the adsorption through physisorption [31, 32]. Also, n is considered to be a value between 1 and 10, where higher values of it implies stronger interactions among the adsorbent and the adsorbate. Thus, the MB adsorption to CVWB can be identified as a stable multilayer adsorption.
Kinetics of the adsorption was examined using pseudo first order (Fig. 6(e)), pseudo second order (Fig. 6(f), and intra particle diffusion (Fig. 6(g)) kinetic models. For the pseudo first order model, Eq. (5) was used where qt and qe (mg/g) are the amounts of MB adsorbed at time t and equilibrium, and k1 (min−1) is the pseudo first order rate constant. This model assumes that the adsorption rate is directly proportional to the difference between the amount adsorbed at time t and the total adsorption capacity at equilibrium.
For pseudo second order, Eq. (6) was used where k2 (min−1) is the pseudo second order rate constant. This model assumes that the rate-limiting step is the chemisorption process of the adsorbate to the adsorbent.
The pseudo first and the pseudo second order models do not provide information about the contribution of the efficiency of adsorbate diffusion towards the rate of the adsorption. Therefore, the intraparticle diffusion kinetic model, Eq. (7) was used, where Kid (mg g−1 min−1/2) is the intraparticle diffusion rate constant, and C is corresponding to the thickness of the boundary layer where it is considered that larger the value of C, the greater the boundary layer effect.
The kinetic parameters of the above models calculated are shown in table S1. When considering the R2 values, both the pseudo-second order model (R2= 0.989) and the intraparticle diffusion model (R2= 0.9946) were identified as the best models to describe the adsorption process of MB. Pseudo-second order model implies that the rate of the adsorption depends on the availability of the active sites on the adsorbent and hence the occurrence of chemisorption. The intraparticle diffusion model data exhibit a multi-linear plot with two steps. The first sharper portion depicts macropore and large mesopore diffusion. This is the direct utilization of the readily available adsorbing sites on the surface [33]. The second linear portion is the gradual adsorption stage with the prominent intra-particle diffusion, representing micropore and small mesopore diffusion. It will continue to saturation. However, the intercept did not cross the origin in any of the steps suggesting that intraparticle diffusion was not the only rate-limiting step [34].
The chemical structure of a MB molecule is shown in Fig. 6(h). The length of a MB molecule is 1.382 nm or 1.447 nm, and the width is approximately 0.95 nm. The length depends on the positioning of the chloride ion. It may be connected to the sulfur atom in the center of the molecule or one of the two nitrogen atoms at the ends [35]. Considering the dimensions of the molecule and the pore sizes of the biochar, the MB molecules can enter into both the micropores and mesopores of the biochar. However, even the largest micropores can acquire one layer of MB molecules. The magnified inset of Fig. 4(b) shows that the vinegar treatment has significantly enhanced the number of small mesopores in the range of 1–6 nm pore radius, which are essential in the multilayer adsorption of MB. Considering all the factors, the adsorption mechanism can be attributed to initial chemisorption via electrostatic attractions, including hydrogen bonding with the oxygenated surface groups of biochar and the positively charged MB followed by pore filling via multilayer adsorption. π-π stacking interactions between both the MB and aromatic rings of biochar and MB-MB molecules could have been a possible contributor to this stable multilayer formation [36].
In this study maximum Langmuir adsorption capacity (Qm) was recorded as 41.49 mg/g, and experimentally, it was 58.28 mg/g at 300 mg/L of initial dye concentration with 12 h incubation time. The experimental adsorption capacity could be greater due to the multilayer physical adsorption. Authors of this study have previously reported the effective use of vinegar-activated biochar in reducing water hardness [11,12]. To our knowledge, no previous studies have reported the adsorption of MB onto Trema orientalis wood biochar or any other form of vinegar-activated biochar. However, Sun et al. [9] have reported the aqueous MB removal efficiency of Eucalyptus sawdust biochar activated using acetic acid with a Qm of 29.94 mg/g utilizing a different activation method.
Further, the Qm of CVWB measured (41.49 mg/g) was significantly high compared to the recorded MB adsorption capacities elsewhere of various other chemically modified biochar: Qm = 4.58 mg/g of sawdust modified with 1% perchloric acid [37] and Qm = 18.18 mg/g of kenaf fiber modified with 3 M hydrochloric acid [38]. It was comparable to the banana pseudostem biochar modified with phosphomolybdic acid with Qm = 49.88 mg/g [39], bagasse modified with tartaric acid with Qm = 69.93 mg/g [40], and magnetite-loaded multi-walled carbon nanotubes with Qm = 48.06 mg/g [41]. There are other effective adsorbents recorded such as hazelnut husks modified with phosphoric acid with Qm = 204 mg/g [42] and ZnS: Cu nanoparticles loaded activated carbon with Qm = 106.9 mg/g [43]. However, these adsorbents are prepared using expensive chemicals such as perchloric acid, hydrochloric acid, phosphomolybdic acid, tartaric acid, phosphoric acid, or tedious processes such as carbon nano tubes synthesis which cannot be practically used by unskilled personnel for biochar activation. The significance of the present study is the use of a green activating agent, the natural coconut vinegar, a mild acid that is safe to handle and available in almost every household. Further research will also be beneficial in identifying the adsorption capacities of various other toxic compounds to coconut vinegar-modified biochar. This will allow rural communities to get the most out of homemade activated biochar as a low-cost adsorbent.
4. Conclusion
This study revealed that low-temperature pyrolyzed (300°C) Trema orientalis wood biochar, modified using natural coconut vinegar, is a potential green adsorbent for aqueous MB removal. Vinegar treatment has effectively increased the surface area and the number of oxygenated functional groups on the surface. CVWB showed a three-fold higher MB adsorption capacity compared to WB, and the percentage removal of MB ranged between 98-79% at lower dye concentrations (50–100 mg/L) and 79-48% at higher dye concentrations (100–300 mg/L). FTIR and XPS data suggested acid-catalyzed hydration of the C-O-C bridges of the biochar upon vinegar activation introducing new hydroxyl and carbonyl/lactone/ester/carboxylic groups to the biochar surface. Water contact angle measurements also showed the increased hydrophilicity of CVWB compared to WB. According to N2 adsorption/desorption isotherms, a 2.7-fold increase of the micropore surface area and 2.8-fold increase of the mesopore/macropore surface area was observed for CVWB compared to WB. Also, CVWB showed a larger Ra of 3.511 nm compared to that of WB 1.079 nm. Isotherm data were best fitted to the Freundlich model. Kinetic model parameters showed that the adsorption mechanism was well correlated with the pseudo second order model and intraparticle diffusion model, implying that the adsorption occurs via initial chemisorption and gradual pore filling process with micropore and small mesopore diffusion. As coconut vinegar is abundantly available for almost all households and safe to handle, the method discussed here can be adapted by rural communities to purify the water they consume.
Supplementary Information
Acknowledgments
This work was supported by the University of Kelaniya, Sri Lanka, under the research grant RP/03/02/06/01/2020.
Notes
Conflict-of-interest statement
The authors have no conflicts of interest to declare that are relevant to the content of this article.
Data Availability Statement
Some or all data, models, or code that support the findings of this study are available from the corresponding author upon reasonable request.
Author contributions
M.M.U. (Postgraduate student) conducted all the experiments and prepared the original draft. R.C.L.D.S. (Senior Lecturer) supervision, funding acquisition, writing-review and editing. D.S.M.D.S. (Professor) supervision, writing-review and editing.