Novel nanocomposite thin films for efficient degradation of Rhodamine B and Rhodamine 6G under visible light irradiation: Reaction Mechanism and Pathway studies
Article information

Abstract
The present investigation aims to synthesize the novel nanocomposite thin film and utilize the material to remove emerging dyes efficiently (i.e., Rhodamine B (R-B) and Rhodamine 6G (R-6G)), in an aqueous solution using LED visible light and UV-A light. A facile synthetic route was adopted to obtain the TiO2-supported bentonite and in situ decorated with Au nanoparticles (NPs) thin film. The advanced analytical techniques characterizes the materials. The laboratory scale reactor was utilized for efficient degradation of R-B and R-6G using thin film catalysts. The percentage removal of R-B was 54.13% (visible light) and 76.26% (UV-A light) and the R-6G, was removed 60.37% (visible light) and 84.68% (UV-A light) at the initial pollutant concentration of 0.5 mg/L and at pH 6.0 using the thin film photocatalyst. The parametric studies demonstrated the insights of degradation mechanisms in photocatalytic operations. A significant mineralization of these dyes is achieved, and the repeated use in reactor operations indicated the catalysts’ stability. After six repeated cycles of photocatalytic reaction, the efficacy of catalyst was decreased by 1.02% only (for R-G) and 0.93% only (for R-6G). A plausible reaction pathway was proposed, and the real implications showed higher selectivity of the catalyst.
Abstract
Graphical Abstract
1. Introduction
Synthetic dyes are primarily employed in several modern industries, viz., hair colorants, medicines, cosmetics, paper, food, leather, and textiles [1]. Industrial effluents are, therefore, excessively contaminated with various dyes and severely impact the aquatic ecology [2]. Dyes are potentially stable; hence, they are only partly biodegraded and found to be reasonably stable in the presence of numerous oxidizing agents [3]. Hence, are often escaped from the wastewater treatment plants (WWTPs) and enter the aquatic environment with a greater impact on the aquatic habitat. The transmission of solar light is reduced in dye-contaminated water, and as a result, photosynthesis is diminished or sometimes completely inhibited [4]. Some dyes are potentially toxic, bioaccumulative, and induce skin illnesses. Some azo dyes are mutagenic/carcinogenic and teratogenic [5].
Rhodamine B (R-B) is a red dye that is highly soluble in water and belongs to the xanthene class of dyes, which is highly corrosive [6]. They are standard water tracer fluorescent and are commonly used as a colorant in fabrics and foods [7]. It causes skin and eye irritation and respiratory tract disorder when consumed by humans and animals [8]. R-B is carcinogenic and neurotoxic in the reproduction and development of animals and humans [9–11].
On the other hand, Rhodamine 6G (R-6G) is a fluorophore and is reported to be toxic and mutagenic to cells, organs and organisms [12]. It is a dark reddish-purple colour with non-volatile xanthene derivatives, extremely water-soluble. R-6G is frequently used as a laser gain medium, tracer dyes, and colouring agent in printing [13]. It is also employed as a diagnostic device to find antigens in a liquid trial in the laboratory. It is highly corrosive to metals [14] and irritates the respiratory system, skin, and eyes of human beings if exposed [15].
For removing dyes from water bodies, numerous conventional methods are demonstrated, including electrochemical treatment [16], chemical precipitation [17], coagulation [18], membrane filtration [19] and adsorption [20]. The conventional water treatment methods are not acceptable since it is not efficient enough to eliminate the dye compounds from water bodies at recommended levels. Thus, an advanced process is necessitated for effectively and efficiently eliminating these dyes from the water bodies. Photocatalytic oxidation involving metal oxide semiconductors effectively degrades of both potentially evolving and stable organic compounds [21–23]. Titanium dioxide (TiO2) is a widely utilized semiconductor showed applications in diverse areas. Primarily due to its cost-effectiveness, nontoxicity, ease of manufacture, biocompatibility, chemical stability, and photoactivity [24]. The use of TiO2 in photo-induced processes showed several limitations, such as low quantum efficiency, photo-induced electron-hole pairs having short diffusion length, exciton by harmful UV light, and cumbersome phase separation [25,26].
Doping with noble metal nanoparticles has shown improved photocatalytic efficiency and extends its applications toward the visible light region [27]. Noble metal-doped TiO2 nanocomposites have numerous applications in various chemical processes, including the degradation of hazardous organic chemicals, hydrodesulfurization, energy harvesting, and carbon monoxide oxidation [28–30]. Due to the ease of preparation, tunable electrochemical and photochemical properties, and synergistic activity, Au-TiO2 nanocomposites were progressively studied. Au/TiO2 powder was obtained using the photoreduction/ sol-gel process. The material possessed an enhanced specific surface compared to the bare TiO2 and was found efficient in the photocatalytic breaking down of methylene blue using visible light [31]. Au/TiO2 photocatalyst efficiently mineralizes methylene blue in an aqueous medium under the photocatalytic processes. The bimetallic Au/Ag doped TiO2 nanorods were synthesized by the sol-immobilization method and embedded in a membrane made up of cellulose acetate by using the phase-inversion method. The material showed high hydrophilicity and porosity, enhancing tetracycline's photocatalytic degradation. Moreover, the bactericidal efficiency of the material was obtained under visible light irradiation [32]. The Au/TiO2 plasmonic fibre was used to degrade methylene blue, carbofuran, and metronidazole under visible light [33]. The material was fabricated using a photo deposition method and soaked in chitosan fibre to obtain the photoactive plasmonic fibre with a large specific surface area. The synthetic template route fabricated Heterogenous Au/TiO2 nanocomposite thin film. The thin film is efficient in degrading the Alizarin yellow under UV-A light irradiation and provides a high percentage of mineralization [34]. Photocatalytic falling film reactor with TiO2 photocatalyst coated on the Pilkington Activ™ glass (PAG) is efficient in degrading the pharmaceuticals, viz., diclofenac (DCF) and ibuprofen (IBP) in an aqueous medium. The photocatalytic degradation enabled a partial percentage of TOC removal, i.e., 16.0% and 15.3%, respectively, for the DCF and IBP [35]. The efficiency of various advanced oxidation processes (AOPs), viz., UVA/TiO2/H2O2, photocatalytic oxidation, photo-Fenton, Fenton, photocatalytic ozonation, and non-thermal plasma generated using dielectric barrier discharge (DBD) were compared in the decolorization of methylene blue (MB) in terms of the energy yield (G5O) and total organic carbon (TOC) removal utilizing a planar falling film reactor. Ozonation and Fenton oxidation were to be efficient in the decolorization of MB. However, MB's percentage mineralization partially used these AOPs [36].
Clays have high porosity and large surface area; hence, they are excellent support materials for synthesizing nanomaterials, including titanium dioxide [37]. Moreover, the clay particles are active in suppressing the charge recombination in TiO2 due to the presence of interlayer cations in clay, which tends to attract the electrons while leaving holes available for oxidation [38]. The sol-gel process synthesizes the nanocomposite, i.e., TiO2 pillared with montmorillonite. The material was then used to degrade phenol under a photocatalytic reactor [39]. Similarly, the TiO2 was pillared with the montmorillonite using the hydrothermal process. The anatase phase of TiO2 crystals in the nanocomposite (TiO2/Mt) showed high efficiency in degrading trichloroethylene in an aqueous solution [40]. The TiO2/bentonite nanocomposite is employed in the photocatalytic degradation of cationic red GTL dye. The removal efficiency of TiO2/bentonite nanocomposite was 2.57 times higher than the bare TiO2 [41]. Therefore, the specific objective of this investigation is to synthesize a novel nanocomposite solid TiO2/bentonite decorated in situ with Au(NP). Further, the thin film of nanocomposite solid was fabricated in a facile method, which was then employed to eliminate R-B and R-6G efficiently in the aqueous medium. Moreover, the insights of catalytic reactions and reaction pathways are extensively studied. The work’s real implications for the process and stability of thin-film catalysts are the studies implied for greater implacability of the catalyst and process.
2. Experimental Details
2.1. Materials
Rhodamine B (50%), Rhodamine 6G (99%), NaBH4, polyethylene glycol (PEG), gold chloride (99.9%), CH3COOH, and titanium isopropoxide (97.0%) are of Sigma Aldrich. Co., USA products. EDTA (98.0%) is of Loba Chemicals, India product. NaCl (99.0%), NaN3 (99.0%), CuSO4 (99.0%), NaNO3, glycine (99.0%), oxalic acid dihydrate (99.0%), NiCl2 (95.0%) are of Merck India Ltd., India products. Sartorius water Purification System (Sterile Plus, Sartopore 2150, UV Lab. Arium Mini Plus, Germany; model: 0.45 + 0.2 mm Pore size) is used for obtaining the purified water. The real water samples were taken from Serlui B river (Near Serlui B hydel Project), Kolasib District, Mizoram (India). Utilising the Multiphotometer (Model: HI98194, USA; Hanna Instruments), samples of real water were examined for several water parameters. Analysis for the elements were carried out with an Atomic Absorption Spectrometer (Model: AA-7000; Shimadzu, Japan;). The percentage mineralization of the treated pollutants i.e., R-B and R-6G were found by obtaining the NPOC (Non-Purgeable Organic Carbon) values using TOC (Total Organic Carbon) (Model: TOC-VCPH/CPN; Shimadzu, Japan) analyzer. Liquid chromatography-mass spectrometry (LC-MS) (LCMS-8040, Shimadzu) provides the molecular mass data of the treated pollutant sample (2 hrs treatment) along with the blank pollutant solution, which provides the degradation by-products. UV-Visible Spectrophotometer (Shimadzu, Japan; UV-1800) was utilised to obtain the absorbance of dye solutions viz., R-B and R-6G.
The stock solution of R-B and R-6G (50.0 mg/L) were made using distilled water. Different concentrations (20.0, 15.0, 10.0, 5.0, 1.0 and 0.5 mg/L) of the pollutants were obtained by dilution from the stock solutions and employed for the photocatalytic degradation study. The time-dependent data eliminating these two dyes were utilized for the kinetic studies. The R-G and R-6G concentrations were monitored using the spectrophotometer (R-B: λmax = 553 nm and R-6G: λmax = 52 nm). The complex structures of R-B and R-6G are revealed in Fig. S1.
2.2. Synthesis of Au Nanoparticles
The gold nanoparticle was obtained using the AuCl3 precursor in the chemical reduction process as defined elsewhere [45]. In summary: 0.5 mmol/L AuCl3 solution in an aqueous medium was prepared. 50 mL AuCl3 solutions taken in a conical flask were placed on the stirring hot plate and kept the solution at ~80°C. Then 2 mL of 1% trisodium citrate solution was swiftly introduced to the AuCl3 solution under stirred conditions. The hot plate was removed from the solution. The gold(III) is rapidly reduced to Au0 colloidal suspension. The colloidal solution turns to deep red colour and is stable at least for 24 hrs.
2.3. Preparation of Clay Supported Au/titania Nanocomposite
A facile template-based sol-gel method was utilized to synthesize the TiO2-nanocomposite. The template polyethylene glycol (PEG) created a dense titania network. The precise procedure followed: titanium isopropoxide was mixed with 2.0 g PEG in acetyl-acetone. Immediately, 10.0 mL of previously prepared Au nanoparticle solution was added gradually. Furthermore, a solution containing distilled water (2.25 mL), acetic acid (0.55), and ethanol (23.3 mL) were gently added to the titanium solution, allowing the condensation and hydrolysis reactions to initiate. After 2 hrs of stirring, 10 g of bentonite clay was introduced to 10 mL of the titania solution. The mixture was vigorously stirred for 2 hrs before being sonicated in a sonication bath for 30 mins. A sol solution was formed, which was further aged for 24 hrs before being used to fabricate the thin films. Likewise, a non-template Au/TiO2 gel was prepared without using the PEG. The template and non-template bentonite clay supported Au(NP)/titania sols were given the names TF(1) and TF(2), respectively. The sols were utilized for the thin film preparation by the facile dip-coating method.
Further, the sols were heated at 500°C to gain the TF(1) and TF(2) solids. Each sample's powder was obtained by crushing the solid using a mortar. The sealed polyethylene bottles were used to store these powders or thin-film disks.
2.4. Clay Supported Au/TiO2 Thin Film Fabrication
A borosilicate circular glass disk (0.5 mm thickness and a diameter of 2.3 cm) was cleaned with HNO3 (0.1 mol/L) and rinsed with purified water. Disks were heated at 100°C in a drying oven and cooled at room temperature. The disks were slowly introduced inside the titania sols (TF(1) and TF(2)) and held vertically for 1 hour. The disks were then taken out from the sol solution. It was dried in air for 12 hrs before being heated at 100°C for 1 hrs. This forms an extremely fine TF(1) and TF(2) thin film on the borosilicate glass substrate. They repeated the procedure three times to obtain smooth film onto the glass substrate. Finally, annealing of the thin films was conducted using a furnace (ID No. LT/15/12/P330, Nabertherm; Germany) at 500°C for 3 hrs. This resulted in a smooth and fine thin layer deposition on the surface of the substrate. TF(1) and TF(2) thin films were stored in a sealed, dry box in a dark environment for further experimentation as the photocatalysts.
2.5. Study of Morphology
The SEM (Scanning Electron Microscope) (FESEM: JEOL JSM 7100F; Oxford Xmax) machine was utilized to examine the surface structure or morphology of TF(1) and TF(2) thin films. TEM (Transmission Electron Microscopy) (HRTEM: JEOL, JEM 2100; Oxford Xtreme) analyses were carried out using the powder samples of TF(1) and TF(2). The elements Ti, O, and Au were also obtained using the TEM-EDX elemental mapping. AFM (Atomic Force Microscopy) machine (USA; Bruker, Multi Mode 8) produced 3D topographical pictures of both thin films.
2.6. Characterization
X-ray diffraction (XRD) analysis of TF(1) and TF(2) powder samples were conducted using an XRD machine (i.e., X'Pert PRO MPD; PANalytical, Netherland). For the liquid N2 desorption and adsorption isotherms, BET-Surface Area Analyser was used to get the BET specific surface area (Micromeritics, ASAP 2010). UV-visible diffuse reflectance spectra (DRS) of the materials were obtained using Evolution 220; Thermo Scientific spectrometer. The DRS spectra were used to calculate the band gap energy of TF(1) and TF(2) by converting the reflectance data into the Kubelka-Munk function.
2.7. Photocatalytic Process
The photocatalytic experiments using the fabricated thin-film catalysts TF(1) or TF(2) were performed by investigating the decomposition rate of R-B and R-6G under visible light and UV-A light sources. A stock solution of R-B and R-6G (50.0 mg/L) was prepared. Both the solutions were kept in a sonicator for 30 minutes to enhance the solubility of these dyes. In addition, the requisite experimental concentration of R-B and R-6G were obtained by diluting the stock solutions successively (0.5 to 20.0 mg/L). Drop-wise additions of 0.1 mol/L HCl/NaOH solutions adjusted the pH of R-B and R-6G practical solutions. The photocatalytic degradation was performed in a self-assembled photo reactor. The photo reactor is housed in a black box (45 × 45 x 60 cm) assembled using cardboard sheets. Inside the black box, pollutant solution (50.0 mL) was taken in a reactor having a capacity of 100 mL. The TF(1) and TF(2) thin-film was carefully put inside the beaker containing the dye solution and arranged horizontally at the centre and bottom of the reactor. LED (Light-emitting diode) Visible light (20 W, 50 Hz, Havells-Adore LED; India) or UV-A lamp with λmax of 360 nm (Philips, 9W, Model: PLS9W BLB/2P 1CT, Hansung UV Pvt. Ltd., Korea) (Intensity: 0.85 mW/cm2) was placed Ca 10 cm above to the reactor. The light was illuminated through the dye solution and penetrated the TF(1) and TF(2) thin film catalysts, allowing photocatalytic reactions in the reactor. The reactor’s temperature inside the black box was maintained at 25±1°C by utilizing a self-assembling water bath. The change in pollutant concentrations at regular intervals was analyzed with the UV-Vis spectrophotometer. For this purpose, the samples were taken and subjected to the UV-Vis spectrophotometer. The degradation reactions were carried out for 2 hrs. The schematic of the photo reactor is illustrated in Fig. S2. A blank experiment was performed in parallel utilizing LED (Visible light) or UV-A irradiation in the absence of a thin film catalyst to compare the efficiency of photocatalytic removal of dyes in the photolytic reaction. The degradation efficiency was obtained using the following expression [Eq. (1)]:
where Co and C respectively are the pollutant initial and final concentrations.
3. Results and Discussion
3.1. Characterization of Photocatalysts
Fig. 1(a) and (b) display the scanning electron microscopic (SEM) pictures of TF(1) and TF(2) nano-composite thin films. In both samples, the particles of Au/TiO2 particles were equally dispersed on the substrate surface, as shown in Fig. 1(a) and (b). It is also worth observing that Au/TiO2 forms a heterogeneous structure on the thin-film surface. The surface of the TF(1) thin film exhibited a very dense surface structure with minor cracks, and the titania is lumped at the surface and forms a very disordered surface.

SEM images of (a) TF(1); and (b) TF(2); TEM images of (c) TF(1); and (d) TF(2)
In contrast, the TF(2) thin film exhibited uniform surface coverage with no cracks. Moreover, the grains are dispersed very evenly on the substrate surface. The sol-gel method obtained similar findings in Au-doped TiO2 mesoporous thin films [42]. Furthermore, Au/TiO2 nanohybrids synthesized by the sol-gel process showed spherical-shaped nanoparticles with a grain size of around 40 nm [43]. Further, the SEM-EDX spectra are obtained and shown in Fig. S3 for the samples TF(1) and TF(2). Fig. S3 clearly showed the EDX peak of Au in both the samples, which confirmed that Au(NP) is successfully decorated within the titania network.
Fig. 1(c) and 1(d) depict the transmission electron microscopic (TEM) pictures of nanocomposite TF(1) and TF(2) materials. The TEM images clearly showed that cubical-shaped Au(NP) are uniformly dispersed within the titania network, and the average particle size is 10 to 20 nm. It is also observed that fine disordered and heterogeneous surface structures are obtained for both samples. It was reported previously that Au/TiO2/Au nanocomposite has a middle layer of TiO2 nanosheets having a thickness of about 5 nm. It was successfully employed as a plasmonic coupling photocatalyst [44]. Furthermore, the heterogeneous nanocomposite Au0(NPs)/TiO2 with a particle size ranging from 20–25 nm was obtained using the sol-gel method [45].
Furthermore, the elemental mapping (TEM) of TF(1) and TF(2) were obtained and displayed in Fig. S4. It is noted that the clay is distributed uniformly as Si and Al are uniformly distributed. Hence, the clay provides a good support medium for titania. Further, the titania network is grown on the support materials, and the O atom is bonded with the Ti, forming the Ti-O bond in both these materials and creating TiO2. Further, the Au(NPs) are decorated within the titania network and uniformly dispersed. Moreover, the spatial and orderly distribution of Au(NPs) indicated that the Au(NPs) are not aggregated on the surface.
The atomic force microscopic (AFM) 3D pictures of nanocomposites TF(1) and TF(2) thin films are depicted in Fig. 2. Both samples showed heterogeneous and disordered structures on their surface. Moreover, the TF(2) nanocomposite thin film showed a more dense surface structure. The template synthesis enabled the formation of a dense titania network on the substrate surface. The TiO2 is pillared on the substrate surface, having pillar heights of 8 and 4 nm for the TF(1) and TF(2), respectively. The mean roughness (Ra) and the root mean square roughness (Rq) of TF(1) were obtained to be 1.165 nm and 1.454 nm, respectively, and 0.386 nm and 0.572 nm, respectively, for TF(2). This inferred that the template synthetic process allowed for greater heterogeneity. The non-templated TiO2 nanocomposite, on the other hand, had a relatively smoother surface than the templated TiO2.
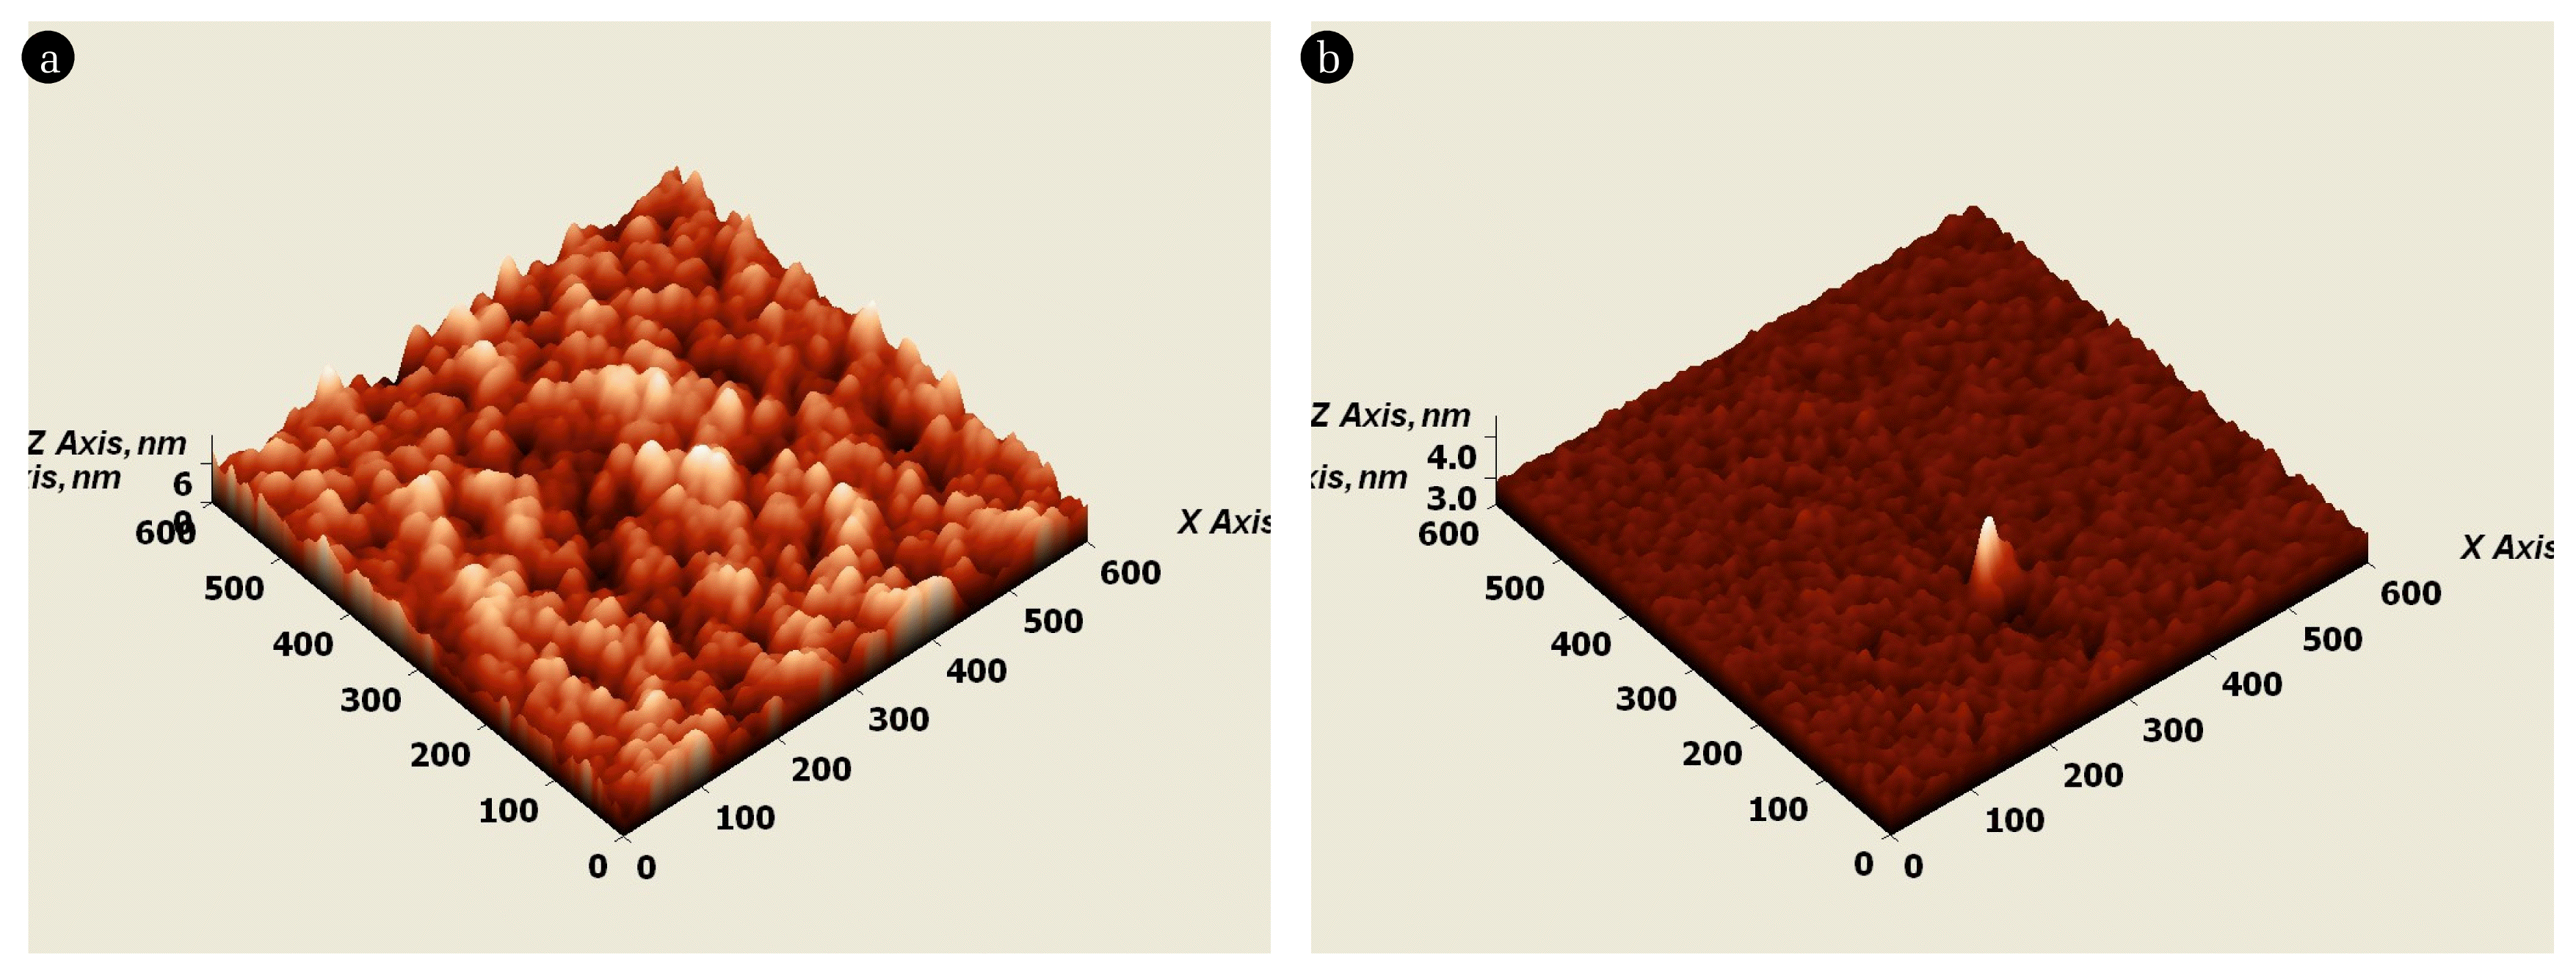
AFM images of (a) TF(1); and (b) TF(2).
Fig. 3(a) shows the Brunauer-Emmett-Teller (BET) results for TF(1) and TF(2) powders. The pore sizes, specific surface area, and pore volume of the nanocomposite thin films were determined using N2 adsorption/desorption data, and the findings are given in Table S1. The adsorption/desorption isotherm curves for TF(1) followed hysteresis loops of the H1 type, which revealed that the material is highly porous and consists of an orderly distribution of even spheres. Alternatively, the TF(2) exhibited a hysteresis loop of H2 type, which revealed that the materials’ pores are associated with slender mouths with an even channel-like network [46]. The H2-type loop indicated that the particles were non-uniform shaped and sized [47]. Moreover, TF(1) 's BET surface area is almost double that of TF(2). The template synthesis enabled the enhancement of the surface area of the solid.

(a) Nitrogen desorption-adsorption isotherms for TF(1) and TF(2) solids; (b) XRD data for TF(1) and TF(2) [Inset: the expanded XRD pattern of TF(1) solid]; (c) Tauc plot for TiO2, TF(1) and TF(2)
X-ray diffraction (XRD) patterns of these two nanocomposite solids, TF(1) and TF(2) are given in Fig. 3(b). TiO2 is predominantly present in the anatase mineral phase in both materials. The distinct peaks at the 2θ values of 25.08, 37.61, 47.86, 53.73, 55.19, and 62.52 are characterized by the anatase phase of TiO2 (JCPDS Card No. 21-1272). On the other hand, the Au(NPs) peaks are not quite visible in the spectra. Hence, the diffraction intensity was enhanced, as shown in Fig. 5(b) (Inset). It is apparent from the XRD pattern that the distinct diffraction pattern of Au(NPs) is obtained at the 2θ values of 38.34, 44.25, 64.34, and 77.32 (JCPDS Card No. 04-0784). This again confirmed the presence of Au0(NP) in the solid samples.

Concentration dependent photocatalytic and photolytic degradation of (a) R-B (pH 6.0); and (b) R-6G (pH 6.0).
Diffuse reflectance spectra (DRS) of the TF(1) and TF(2) powders are obtained using the UV-Visible spectrophotometer. The F(R) values, obtained using Kubelka-Munk theory from diffuse reflectance values, are directly proportional to the absorbance. The band gap energy of these materials was obtained using the Tauc plot, i.e., by extrapolating the linear portion of the graph of (F(R)xhν)1/2 vs. photon energy light (Fig. 3(c)). The energy of the band gap of bare TiO2, TF(1), and TF(2) solids were found to be 3.24, 2.89, and 2.98 eV, respectively. This indicated that the decoration of Au nanoparticles significantly lowered the band gap energy of these materials. Ben Saber et al. reported that Au@TiO2/reduced graphene oxide (rGO) obtained by the solvothermal process possessed the band gap energy of 3.43 eV [48]. Similarly, Au/TiO2 (NPs) were obtained using a hydrothermal process. The materials have band gap energy within 3.1 – 3.15 eV as varied with the weight percentage of Au and Ti. The materials were efficient in the photocatalytic degradation of resorcinol under UV-A irradiation [49].
3.2. Degradation of R-B and R-6G
3.2.1. Effect of pH
The pH-dependent photocatalytic removal result is a crucial physico-chemical parameter explicitly determining the mechanism of the catalytic reaction at the catalyst surface. The pH-dependent removal of R-B and R-6G was investigated by increasing the pH of the dye solutions from pH 4.0 to 10.0 at a constant dye concentration of 5.0 mg/L. Fig. 4 shows the percentage breakdown of R-B and R-6G as a function of pH. In the case of R-B, increasing the pH from pH 4.0 to 6.0 caused an increase in percentage degradation from 34.38 to 35.62% under visible light irradiation and from 55.35 to 56.74% under the UV-A light using the TF(1) thin-film catalyst. However, further increase in pH from 6.0 to 10.0, the rate of percentage degradation declined from 35.62 to 21.84% under visible light irradiation and from 56.74 to 38.33% under the UV-A light using the TF(1) catalyst. In case R-6G, increasing solution pH from 4 to 8 resulted in an increase in degradation percentage from 25.38 to 36.03% under visible light and from 46.35 to 60.46% under UV-A light. However, a further increase in pH from 8.0 to 10.0, resulting a slight decrease in percentage degradation of R-6G from 36.03 to 18.84% under visible light and from 60.46 to 36.33% under UV-A light using the TF(1) catalyst. The pH dependence degradation of these pollutants under the photocatalytic processes is explained based on the interaction of pollutant molecules at the catalyst surface.

Effect of pH in the removal of (a) R-B; and (b) R-6G [Initial concentration of R-B /or R-6G: 5.0 mg/L].
The pHPZC of both thin films was 6.5. This suggests that the catalyst’s surface possesses a net zero charge at pH 6.5. However, at pH>6.5, the surface carries a net negative charge, whereas at pH<6.5, it carries a net positive charge by protonating the active surface groups. On the other hand, the pollutant molecule, R-B, has a pka value of 4.2 [50]. This suggests that R-B undergoes acidic dissociation at pH>4.2; hence, the negatively charged species of R-B predominantly exist in these pH regions. However, at pH<4.2, the R-G predominantly exists in its neutral species. Therefore, between pH 4.2 – 6.5, electrostatic attraction exists between the positively charged thin film surfaces and negatively charged R-B. A relatively larger number of R-B molecules are aggregated on the catalyst surface, which increases the percentage removal of R-B. However, a further increase in pH>6.5 due to electrostatic repulsion between the dye molecules and catalyst surface resulted in a net decrease in percentage removal of R-G (Fig. 4(a)).
Similarly, the R-6G has an acid dissociation constant (pka) value of 6.13 [15]. This indicated that due to the acid dissociation of R-6G at pH>6.13, the R-6G molecules predominantly possess the negatively charged species at pH>6.13. Similarly, a neutral species of R-6G predominantly exists at pH<6.13. However, a very high percentage removal of R-6G is observed within the pH region 6.0–8.0, indicating the strong affinity of the R-6G toward the catalyst surface (Fig. 4(b)). However, at an extremely high pH value (pH 10.0), a sharp decline in the percentage removal of R-6G is because of the strong repulsive forces between the pollutant molecules and the solid surface. Moreover, in a highly alkaline solution, the hydroxyl radical formation rate is decreased significantly due to the formation of hydroxyl ions, which hinders the degradation of pollutant molecules [51].
Furthermore, the efficiency of the template synthesized thin film (TF(1)) was significantly high compared to the non-template synthesized thin-film catalyst (TF(2)). The template synthesized materials possessed a high specific surface area and enhanced heterogeneity, favoring pollutant molecules' removal. Similarly, dye molecule photolytic degradation is significantly less than photocatalytic degradation. This inferred the potential of photocatalyst thin-film in the degradation of pollutants in the aqueous medium.
3.2.2 Effect of concentration
The effect of initial pollutant concentrations in the degradation of R-B and R-6G was studied by changing the pollutant concentrations from 0.5 to 20.0 mg/L at constant pH (pH 6.0). The dye solutions were treated under visible and UV-A light for 2 hrs. Fig. 5 depicts the degradation results of R-B and R-6G as a function of initial dye concentrations. In brief, the percentage photocatalytic elimination of R-B and R-6G was higher at lower initial dye concentrations. More specifically, when the concentration of the R-B dye was increased from 0.5 mg/L to 20.0 mg/L, the percentage degradation was decreased from 54.13% to 6.07% under visible light and from 76.26% to 17.64% under UV-A light irradiation using the photocatalyst TF(1).
Similarly, in the case of R-6G, increasing the initial concentration of dye from 0.5 mg/L to 20.0 mg/L, the percentage removal of R-6G was decreased from 60.37% to 8.42% under visible light and from 84.68% to 19.66% under the UV-A light irradiation using photocatalyst TF(1). The increase in degradation efficiency of both R-B and R-6G with dilution was mainly because the contact possibilities of dye molecules are higher towards the thin film surface at lower pollutant concentrations, which significantly favored the percentage elimination of dyes at lower concentrations [52]. Further, the efficiency of the TF(1) photocatalyst is relatively higher than that of TF(2). This is because of the template synthesis of TF(1), which creates a denser and heterogeneous surface structure, favoring the catalyst performance in the reactor operations. Jain et al. 2007 reported that photocatalytic degradation of R-B using TiO2 in electron acceptor H2O2 also showed a decline in the percentage degradation with the increase in the dye concentration [53]. Similar findings were obtained in the photocatalytic removal of R-6G using ZnO-Ag nanoparticles prepared by pulsed laser ablation in liquid (PLAL) [54]. The photocatalytic degradation of Rhodamine B was studied using thin film Fe2O3/TiO2 under 10 W of 365 nm LED black light blue (BLB) irradiation at room temperature. After 5 hrs irradiation, the degradation percentage of TiO2 film was approximately 30%, whereas that of the 0.50 Fe2O3/TiO2, 0.25 Fe2O3/TiO2, 0.10 Fe2O3/TiO2 and 0.05 Fe2O3/TiO2 samples were 50, 55, 63 and 60%, respectively [55].
3.2.3. Kinetic studies
In the photocatalytic elimination of R-B and R-6G, kinetic studies were carried out to determine the reaction rate constant values. The studies were conducted utilizing TF(1) thin film photocatalysts under visible light at pH 6.0. The time dependence data is used to demonstrate the kinetic studies. The pseudo-first-order rate equation was used to illustrate the degradation kinetics [45]. Table S2 shows the pseudo-first-order rate constant and R2 values at varied pollutant concentrations. It is evident from the results that the degradation of pollutants followed pseudo-first-order rate kinetics, and an increase in pollutant concentrations caused for decrease in the rate constant values. The photocatalytic removal of triclosan in an aqueous solution followed the pseudo-first-order rate kinetics using thin-film Ag(NPs)/TiO2 under UV-A light [56].
3.2.4. Co-existing ions
The experiments were carried out in various co-existing ions, including the radical scavengers in removing R-B and R-6G using TF(1) catalyst under the photocatalytic reactor operations. Various co-existing ions are studied, viz., glycine, ZnCl2, oxalic acid, NaCl, NaNO2, EDTA, CuSO4, and NaNO3. The initial concentrations of R-B and R-6G were taken at 10.0 mg/L at pH 6.0. Moreover, the co-existing ions were fixed at 100.0 mg/L. Fig. 6 demonstrates the removal of R-B and R-6G in the presence of these co-ions under visible light. The occurrence of various ions had variable effects on the removal of R-B and R-6G, as shown in Fig. 6. The presence of glycine, NiCl2, ethylenediamine tetra-acetic acid (EDTA), and NaCl significantly suppressed the removal efficiency of R-B. However, the presence of other ions showed an insignificant effect on the removal efficiency.
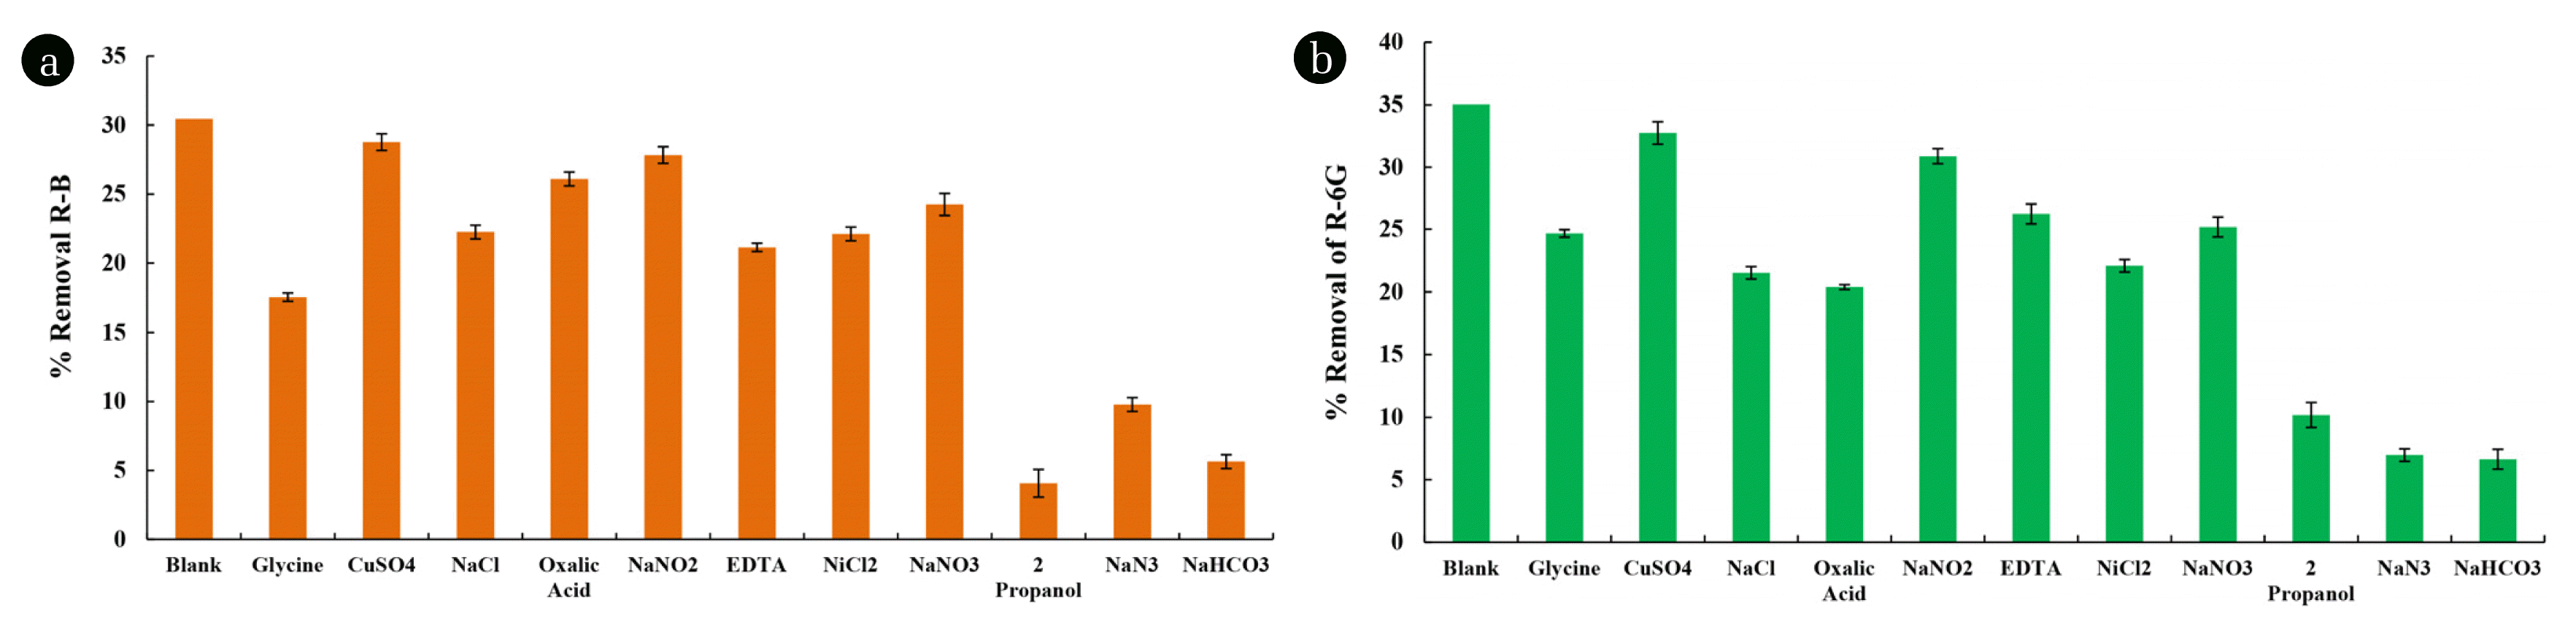
Effect of Coexisting Ions (100.0 mg/L) and Scavengers (1000.0 mg/L) in the photocatalytic degradation of (a) R-B [5.0 mg/L; pH:6.0]; and (b) R-6G [5.0 mg/L; pH:6.0] using TF(1) thin film under visible light irradiation.
Similarly, the elimination of R-6G was significantly suppressed in the presence of NaCl, NiCl2, EDTA, oxalic acid, and glycine. This decrease in percentage removal of R-6G is because of the competitive sorption of these ions towards the catalyst surface and suppressing the photocatalytic performance of the catalyst. Moreover, the presence of EDTA, oxalic acid, and glycine is preferentially degraded in photocatalytic degradation [57,58].
Different ions and molecules are the potentials to trap the radical species, hence, inhibiting the breakdown process. In TiO2 photocatalysts, EDTA inhibits the generation of •OH by lowering the hole formation (h+) [59]. The DFT molecular dynamics studies demonstrated that the surface of TiO2 can readily adsorb the glycine molecules in its anionic or zwitterion state [60]. The most stable binding mode for glycine molecules on the TiO2 surface is that of the anionic amino acid moiety, which interacts with titanium atoms through the carboxylic oxygen atoms by deprotonating the carboxyl group [61]. Similarly, NaCl is preferentially attracted to the surface of TiO2 [57,58]. Direct oxidation/reduction of oxalic acid occurs at the TiO2 surface by forming hole-electron pairs under light irradiation, inhibiting the target pollutant’s elimination [62].
3.2.5. Degradation mechanism
In order to propose a probable mechanism along with the reaction pathway involved in the photocatalytic degradation of R-B and R-6G, further investigation was conducted. The hydroxyl radical is significantly scavenged by the HCO3− and 2-propanol [63]. EDTA suppresses the generation of h+ during the reaction [59]. Similarly, NaN3 traps the singlet oxygen created by the reaction of the O2• − radical with h+. Singlet oxygen is a highly reactive radical in an aqueous medium, capable of quickly removing organic molecules [64]. Therefore, photocatalytic degradation of R-B and R-6G (10.0 mg/L) was performed using TF(1) thin-film photocatalyst in the presence of NaHCO3, NaN3, and 2-propanol (1000.0 mg/L each) using visible light irradiation. Fig. 6(b) shows the percentage elimination of R-B and R-6G in the presence of radical scavengers. With the addition of 2-propanol and NaHCO3, the percentage removal of R-B and R-6G was considerably inhibited. This showed that •OH radicals are predominantly involved in the photocatalytic breakdown of both dyes [65]. In addition, EDTA also suppressed the removal efficiency of both dyes (included in Coexisting ions studies). Hence, the holes (h+) produce the •OH radicals, which are taking part in removing R-B and R-6G.
Furthermore, the addition of NaN3 significantly inhibited the degradation of both the dyes; it concluded that singlet oxygen was produced during the oxidation process [66]. These results indicated that the photocatalytic degradation of R-B and R-6G proceeded via two distinct pathways. Electrons' excitation occurs from the valence band (VB) to the conduction band (CB) when the light illuminates the semiconductor. The electrons excited at the CB are promptly taken by the Au(NPs), preventing the recombination of the e−/h+ pair. The trapped electrons at the Au0(NPs) react again with H2O and O2, yielding the O2• − radical.
Consequently, •OH radical is generated [67]. Simultaneously, h+ created in the VB interacts with O2 molecules to produce an O2• − radical. As a result, the •OH radical is formed [68]. Another possibility of the degradation mechanism is that Au0(NP) absorbs incoming light radiation in the visible region (toward the IR region) and generates the LSPR (localized surface Plasmon resonance) effect, which is a collective oscillation of free conduction electron of Au(NPs) [69]. These oscillating electrons, also called hot electrons, can jump to the conduction band of the TiO2. These electrons then interact with oxygen molecules in the presence of water molecules, leading to the formation of •OH radicals.
Further, the •OH radicals then interact with the dye molecules, resulting in the photocatalytic breakdown of R-B and R-6G. The LSPR effect also leads to the generation of intense electric fields near Au(NPs) surface. This permits plasmonic Au(NPs) to behave as nanoantenna, concentrating and amplifying light in the vicinity of the TiO2 surface. This increases the light absorption in a nearby semiconductor (TiO2) [70].
In order to study the possible reaction pathways in the degradation of R-B and R-6G, a liquid chromatograph-mass spectrometric (LC-MS) analysis was performed. Both the dyes [5.0 mg/L; pH:6.0] were treated for 1 hrs under photocatalytic treatment with TF(1) thin-film using visible light irradiation. The R-B and R-6G solutions, along with treated samples, were analyzed by the LC-MS. The by-products formed are assessed with the mass spectra, and the positive ion mode mass spectra were used to identify the available compounds. The by-product’s m/z value obtained after the treatment was used to propose a plausible degradation mechanism for R-B and R-6G (Cf Fig. 7(a) and 7(b)). It was observed that the degradation reaction of R-B and R-6G was induced by the hydroxyl radical (•OH). The mass peak at m/z 443 (Base peak) was detected for the initial solution of both R-B and R-6G and is attributed to its chloride ion's R-B and R-6G molecules.
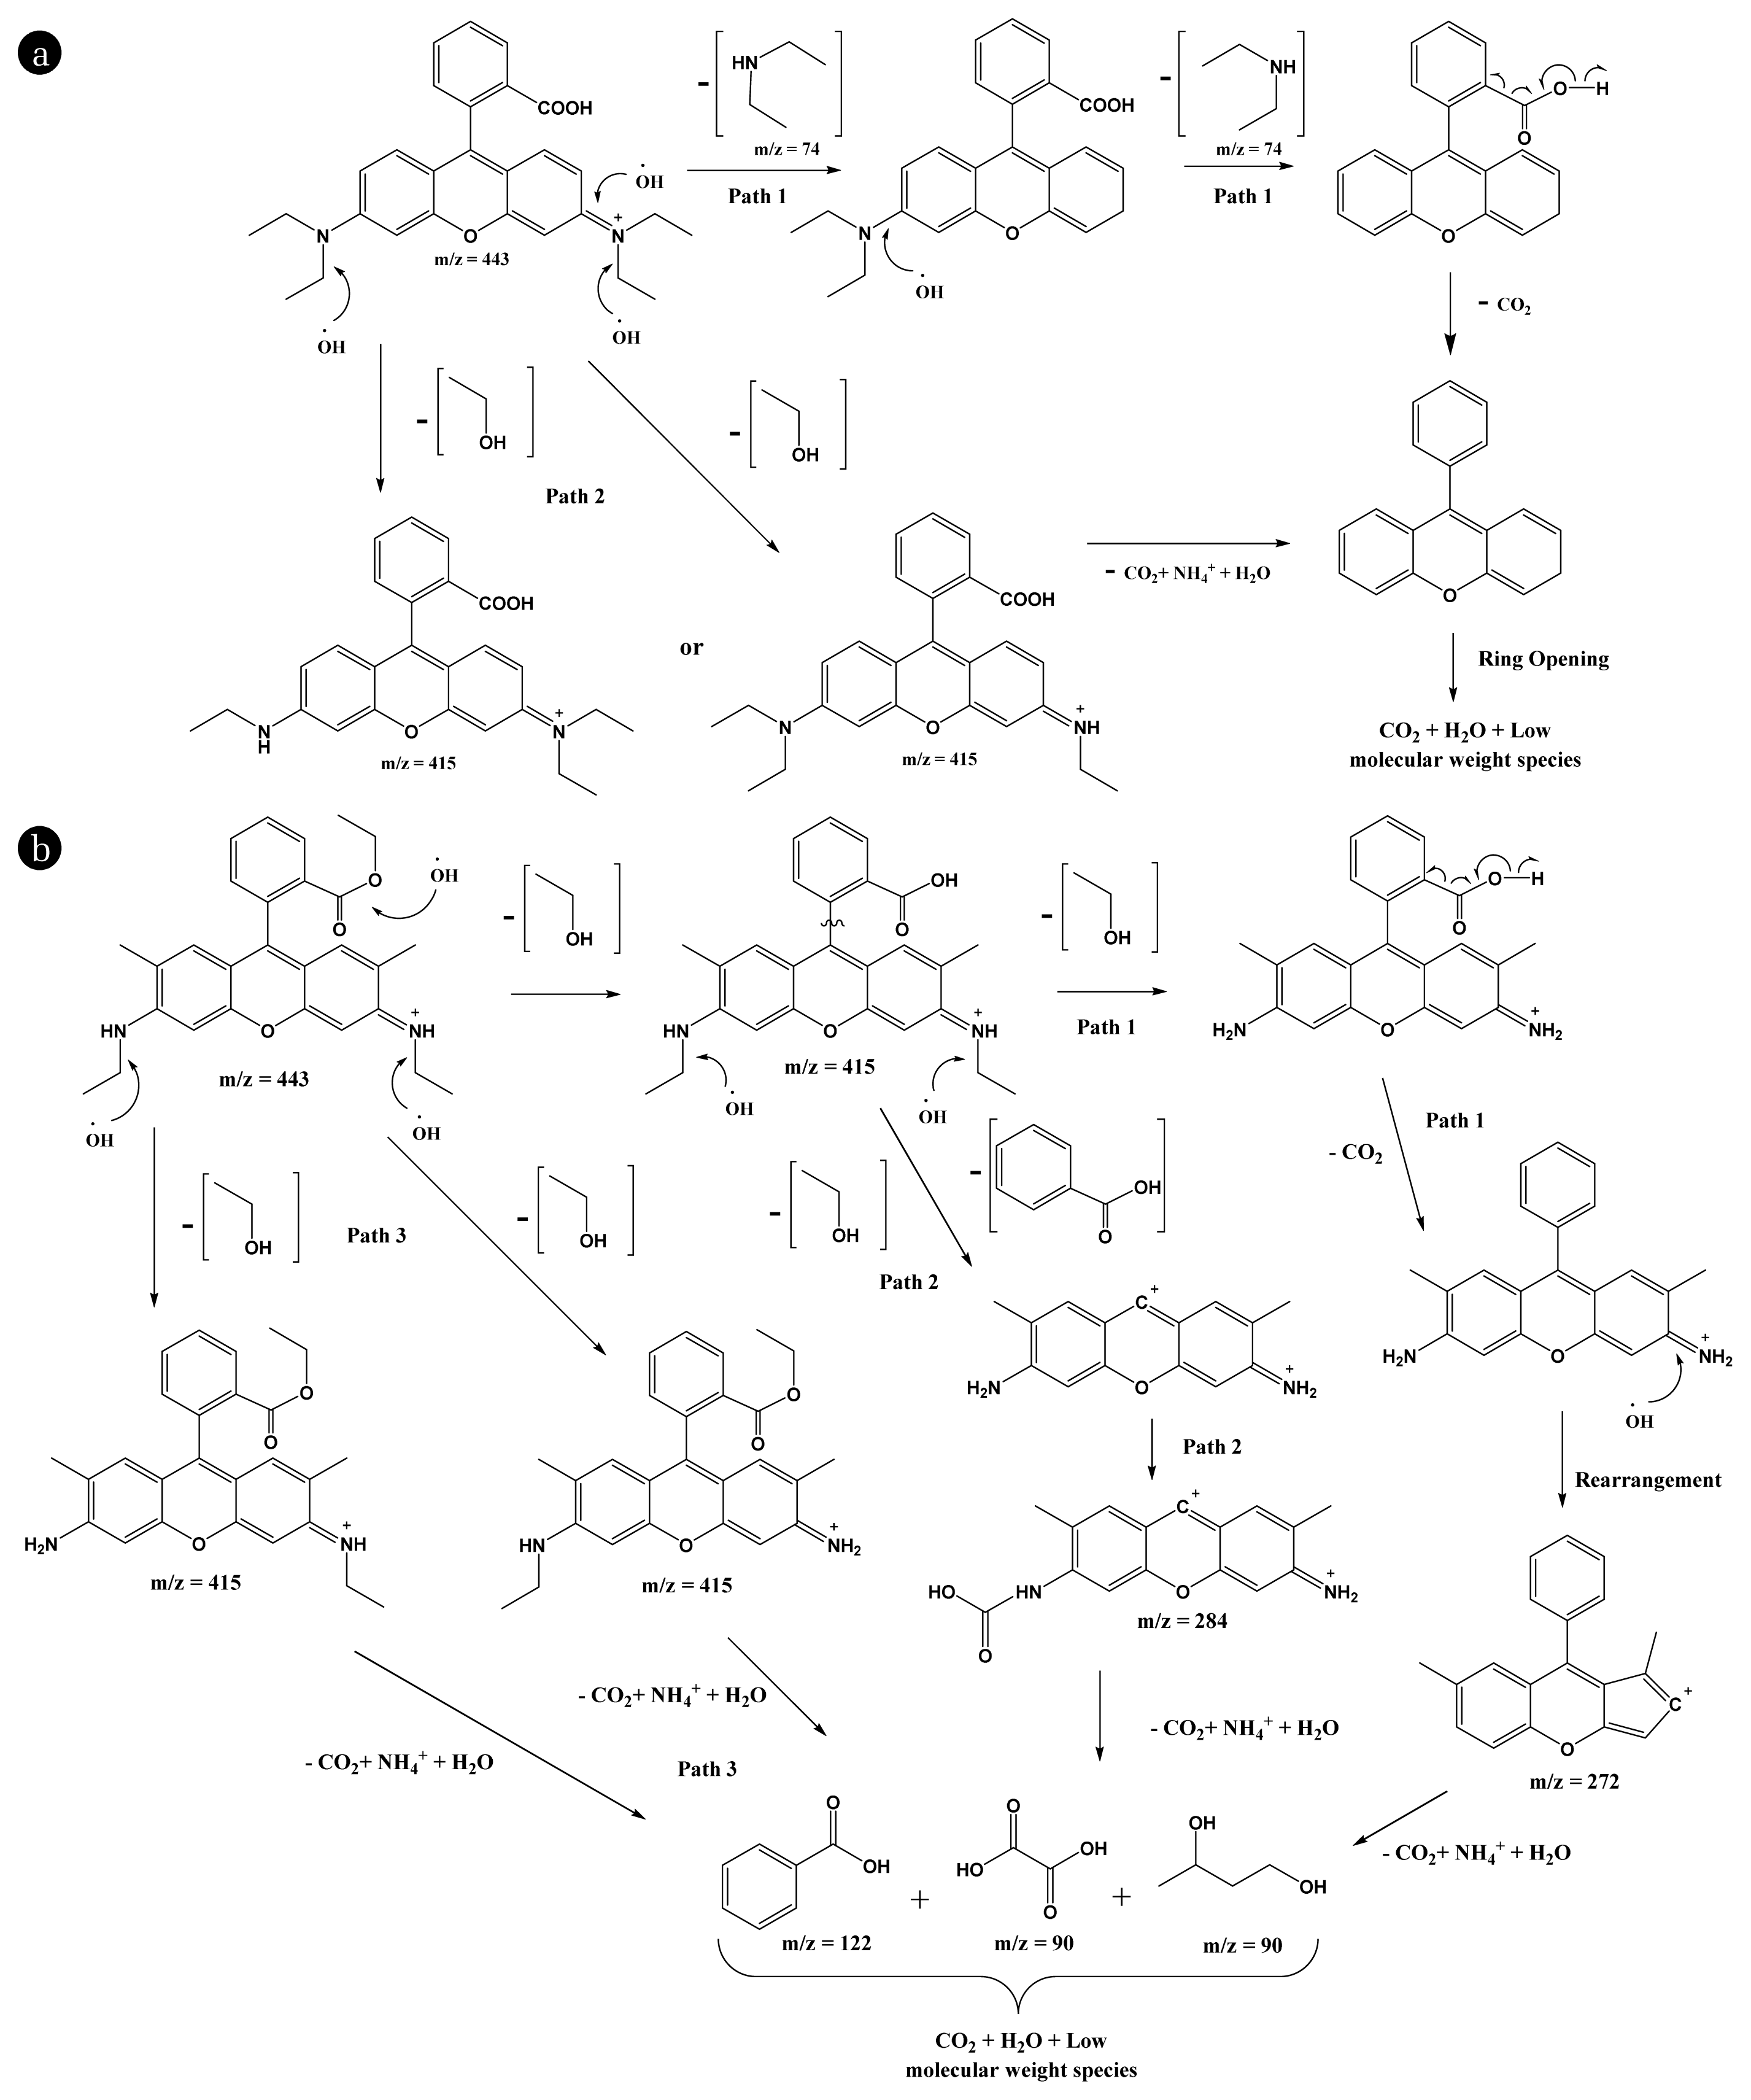
Reaction pathway of the photocatalytic degradation of (a) R-B; and (b) R-6G [Pollutant concentration: 5.0 mg/L; pH:6.0 and using TF(1) thin film catalyst under visible light irradiation].
In the case of R-B, the peak at m/z 415 is designated as the de-ethylated intermediate of R-B (Path 2). After eliminating a fragment of 74 mass units {(C2H5)2NH}, it undergoes a decarboxylation reaction (Path 1). The hydroxyl radical (•OH) reacts with the double bond of the aromatic ring and causes the molecule to undergo ring-opening; hence, it is eventually decomposed to CO2, NH4+, and H2O. Further, the signal at m/z 74 is relatively strong. This peak suggests that the (C2H5)2NH fragment is not broken down into small molecules while the parent compound is successfully decomposed into CO2, NH4+, and H2O.
On the other hand, in the case of R-6G, the peak at m/z 415 is designated as the de-esterification (or hydrolysis) by-product of R-6G (Path 1 & 2) and the de-ethylated intermediates of R-6G (Path 3). The de-esterification by-product of R-6G then undergoes a decarboxylation reaction followed by a rearrangement reaction, which gives the reaction intermediate with m/z 272. This undergoes ring-opening with the formation of CO2, NH4+, and H2O (Path 1). The de-esterification by-product of R-6G also undergoes a fragmentation reaction in which benzoic acid is released. The parent aromatic ring undergoes ring-opening with the formation of CO2, NH4+, and H2O (Path 2). Further, the de-ethylated intermediate of R-6G undergoes ring-opening and the formation of CO2, NH4+, and H2O (Path 3).
The ring-opening of the intermediate from Paths 1, 2, and 3 leads to the generation of benzoic acid (m/z 122), oxalic acid (m/z 90), and other small molecules. These molecules are further oxidized by hydroxyl radical (•OH) and decomposed into CO2 and H2O. Similar by-products are also reported for R-B and R-6G, including gradual de-ethylating and breaking the benzene ring's double bonds [71,15].
3.2.6. Recyclability test
The efficiency of photocatalysts in extended photocatalytic operation is crucial to the real-world applicability of photocatalysts. This would bring the extent of stability of the nanocomposite material. Therefore, the photocatalytic degradation of R-B and R-6G in an aqueous medium was repeated six times using a thin film TF(1) catalyst under visible light. The results are shown in Fig. 8 (a) and (b). After every cycle, the material was quickly cleaned with 0.01 M HCl solution, rinsed with distilled water and dried in the oven for 1 hour at 90°C. The dried thin film was then utilized for the next cycle of operation. The pH and initial concentration of the dye solutions (R-B and R-6G) were taken at 6.0 and 10.0 mg/L, respectively. The percentage efficiency of the photocatalyst remained consistent even after 6 cycles, resulting in practically constant efficiency in the photocatalytic elimination of R-B and R-6G (Cf Fig. 8(a) and (b)). After six repeated cycles of photocatalytic degradation reaction, the efficiency of R-B removal was decreased from 30.45 % to 29.43 % (a drop of 1.02%) (Fig. 8(a)), and that of the R-6G removal was decreased from 35.05 % to 34.12 % (a drop of 0.93%) (Fig. 8(b)). These results revealed that the thin film photocatalyst is fairly stable during prolonged and repeated photocatalytic reactions. Thus, the nanocomposite of this film is fairly stable for extended applications to various wastewater treatment methods and provides a greener alternative for removing these potentially hazardous chemical compounds. Similar stability was obtained by employing the photocatalyst Ag/TiO2 thin-film in the degradation of triclosan, at least for 6 cycles of operation [56].

Six Repeated cycle of catalyst operations in the degradation of (a) R-B (5.0 mg/L; pH 6.0); and (b) R-6G (5.0 mg/L; pH 6.0) using TF(1) thin film under visible light irradiation. Percentage mineralization of (c) R-B; and (d) R-6G as a function of variation in initial concentrations under photocatalytic and photolytic process using TF(1) thin film at pH 6.0.
3.2.7. Mineralization
Mineralization of pollutant molecules is one of the important aspects of the study since the operations need the mineralization of pollutant molecules in the treatment process. As a result, NPOC (Non-Purgeable Organic Carbon) data were obtained for various concentrations of treated R-B and R-6G samples. Both the dye concentrations varied from 0.5 to 20.0 mg/L at pH 6.0. The treated dye solutions were analyzed after being treated for 2 hrs under visible light and UV-A light using TF(1) and TF(2) thin film catalysts. Fig. 8(c) and (d) showed the percentage elimination of NPOC as a function of R-B and R-6G concentrations. It was revealed that the decrease in pollutant concentration favored the percentage mineralization of pollutants. In the case of R-B, when the concentration was increased from 0.5 to 20.0 mg/L, the percentage of NPOC removal was decreased from 29.37 % to 3.32 % (using TF(1) thin film) under visible light and from 41.12 % to 9.64 % (using TF(1) thin film) under UV-A light. Similarly, in the case of R-6G, when the dye concentration was increased from 0.5 to 20.0 mg/L, the percentage of NPOC removal was lowered from 33.25 % to 5.16 % (using TF(1) thin-film) under visible light and from 43.16 % to 10.74 % (using TF(1) thin-film) under UV-A light. Thus, mineralization was achieved significantly, especially towards lower dye concentrations. Further, the templated TF(1) thin film showed better elimination efficiency of mineralization for both the dyes viz., R-B and R-6G than the TF(2) thin film. Further, significant mineralization of pollutants has shown greater applicability of catalysts in reactor operations.
3.3. Real Water Treatment
The use of thin-film nanocomposite in real implications determines its effectiveness in real-world treatments. The real water sample was spiked with various R-B and R-6G concentrations and utilized for the photocatalytic degradation of these pollutants utilizing the nanocomposite thin films. Table S3 shows the physical and chemical parameters of real water samples collected from Serlui B river (Near Serlui B hydel Project), Kolasib District, Mizoram, India. The water contained relatively high quantities of Zn, Ca, and Fe. The inorganic carbon concentration was also high, whereas the NPOC content was seemingly low. The real water was spiked with R-B and R-6G (0.5 to 20.0 mg/L) at pH 6.0 and was treated under visible light irradiation and utilizing the TF(1) catalyst for 2 hrs. The results obtained with the real water were compared with those attained with distilled water (Fig. S5). Interestingly, the percentage degradation of R-B and R-6G was not significantly affected in the real water samples. This shows that the nanocomposite catalyst possessed greater applicability in reactor operations for efficient treatment of water contaminated with various dye compounds.
4. Conclusion
A novel facile template synthetic route enabled obtaining the bentonite supported-TiO2 and decorated in situ with the cubical-shaped Au(NP). Further, the nanocomposite thin films catalyst was fabricated in the photocatalytic reactor operations. The TiO2 in the nanocomposite exists predominantly with its anatase mineral phase, and the presence of Au(NP) shows characteristic diffraction peaks in the XRD analyses. The template synthesis enabled a denser surface structure, and the cubical-shaped Au(NPs) were evenly distributed within the titania network. Moreover, the specific surface area of TF(1) (template material) was almost double compared of TF(2) (non-template material). The template synthesis enabled the enhancement of the surface area of the solid. The mean roughness (Ra) and the root mean square roughness (Rq) were 1.165 nm and 1.454 nm, respectively. The presence of Au(NPs) with TiO2 significantly decreases in band gap energy; hence, the catalysts were found efficient in visible light operations. The fabricated thin films exhibited a maximum degradation efficiency at pH 6.0 and 8.0, respectively, for the R-B and R-6G. The dilution of pollutant concentrations favored the degradation efficiency of catalyst for these two dyes, and the degradation process followed pseudo-first-order rate kinetics. Both pollutants are mineralized significantly in a single photocatalytic treatment. Moreover, the catalyst was stable for at least six repeated operations. The insights mechanism inferred that the degradation process predominantly proceeded through the hydroxyl radicals; accordingly, the plausible reaction pathway was demonstrated. The presence of glycine, NiCl2, EDTA, and NaCl affected the removal of these two dyes in the photocatalytic treatment. Further, photocatalytic degradation efficiency of the two pollutants spiked with the spring water sample is not reduced, inferring the greater applicability of the process in real implications. This implies that the proposed method has the potential for possible large-scale implications.
Supplementary Information
Notes
CONFLICT-OF-INTEREST STATEMENT
The authors declare that they have no conflict of interest.
AUTHORS CONTRIBUTIONS
C.V. (PhD student) performed the experiments and drafted the manuscript. D.T. (Professor) conceptualized the problem and critically evaluated the manuscript. The review and editing are completed. S.S. (Associate Professor) helped in the revision of the paper and provided critical suggestions. S.M.L. (Professor) analyzed the data and provided critical comments.