Application of Linear Programming for cassava starch production optimization in Vietnam within a Circular Economy framework toward Zero emission
Article information

Abstract
Cassava starch production is a key industrial production of Tay Ninh province, Vietnam. However, this production chain has also caused many negative impacts on the environment. This study applied the principles of circular economy to analyze the waste streams via linear programming method for cassava starch circular production chain towards zero waste emission. The results show that the cassava starch indutry can achieve the goals of zero electricity, zero waste, and zero fossil energy by re-planning the production chain. The chain’s output products are 517.5 tons of bio-oil/year, 206.7 thousand tons of biochar/year, 190.0 thousand tons of dry pulp/year, 10 million m3/year of liquid fertilizer. In order to increase further the value of the chain in the circular economy, future research needs to study the feasibility of a solution to reuse wastewater to produce microalgae, as well as evaluate the effectiveness of these methods. The optimization method applied in this study can also be extended to similar agricultural chains properties such as rice processing, sugar cane, etc.
Abstract
Graphical Abstract
1. Introduction
Circular economy is used recently to solve various production issues and environmental problems to optimize the process [1–2]. It is an approach that promotes the use of resources in a cycle of matter, recovering and regenerating materials at the end of each round of extraction, production, distribution, and consumption [3–5]. Circular economy has the potential lead to sustainable development while separating economic growth from the devastating consequences of resource depletion and environmental degradation [6–8]. The most widely accepted concept of the circular economy was introduced by the Ellen MacArthur Foundation at the 2012 Global Economic Conference, then Kirchherr et al. [9] analysed 114 CE definitions as an economic systems that replace the end-of-life’concept with reducing, alternatively reusing, recycling and recovering materials in production/distribution and consumption processes. Suárez-Eiroa et al. [10] proposed six principles for achieving circular economy: (1) Adjusting inputs to the systalk to regeneration rates; (2) Adjusting outputs from the systalk to absorption rates; (3) Closing the systalk; (4) Maintaining resource value within the systalk; (5) Reducing the systalk's size; (6) Designing for circular economy and (7) Educating for circular economy. A number of studies have applied circular economy to several typical industries such as steel [11], food [12], packaging [13], dairy [14], integrated agriculture [15], minning [16], automobiles [17] etc.
The integrated agro-based industrial zero emission syems (AIZES) suggests waste treatment and resources circulation under the circular economy concept. These integrated models/systems have been applied in the varied sectors from agriculture, craft production and industry including the cassava production in the developing countries [18]. In the agro-based small/medium-scale industrial systems, the fish ponds play a role for receiving and storage of treated wastewater, and reused for gardens watering and/or other cultivation purposes [19–21]. The conversion of solid waste into high quality bioproducts in the integrated cassava wastes biorefinery could enhance the economic efficiency as well as reducing the environmental burden [22]. The sollutions for closing the loop materials – water – wates – energy – foods in the cassava production sector have proven high efficiency when comparing with the traditional production methods with reducing 90% of global warming [23, 24]. Moreover, the recycling of cassava production wastes into qualified products in packaging production under circular economy is also an effective and promising strategy for climate change mitigation [25]. In addition, the nutrients sources (such as N and P) are recovered and reused for the cassava cultivation which reducing the chemical fertilizers and cultivation water [26]. The integrated system combining livestock and cultivation has a role in waste recycling and converting the wastes into valuable products such as energy for cooking, organic fertilizer for cultivation, and foods for cattle [27]. During cultivation cassava, 4390 tons of cassava requires 193 hectares of land, 11 tons of N fertilizer, 3 tons of P fertilizer, and 10 tons of K fertilizer were produced [28]. Therefore, the cultivation process will impact on the environment due to the using of pesticides and fertilizers [29]. The main types of impacts are greenhouse gas emissions, eutrophication, toxins for humans and ecology (plant protection products, trace elements), etc. The cyanide content in cassava tubers was 240–340 mgHCN equivalent/kg dried cassava [30]. During the processing of cassava, nearly 92% of HCN goes into wastewater, 5.2% goes into solid waste (cassava pulp), 1.5% evaporates from drying process, and about 0.41% in dry cassava starch products [31]. Accumulation of cyanide compounds in the environment around cassava starch production plants with concentration of HCN in groundwater was 1.2–1.6 mg/L [32]. Calculations from the material balances of a previous research work [33] show that solid waste accounts for 10–15% of fresh cassava. Inwhich peels are about 0.38 tons/ton of product, pulp with moisture content of 35–40% are about 1.4 tons/ton of product [34], or peels account for about 0.06–0 .13 tons/ton of product, pulp is about 0.56–0.81 tons/ton of product [35]. Cassava starch production plants consume large amounts of energy through electric motor systalks and drying systalks. Electricity consumption is 0.32–0.929MJ/kg of product, heat from 1.141 to 2.749MJ/kg of product [36]. The amount of wastewater generated from the production of cassava starch has been reviewed by many authors: 22 m3/ton of product [37]; 19.1 m3/ton product [34], 13.1 m3/ton product [30]. In general, water consumption in cassava starch production ranges from 6–10 m3/ton of raw material [33] or 10–30 m3/ton of product [35].
The above data shows that cassava starch production has a great impact on the environment through the consumption of raw materials, emissions, solid waste, and wastewater. The treatment methods for cassava waste from farming are burning to recover energy, pyrolysis to recover biodiesel [37]. Solutions for pulp include production of forage pellets [38], ethanol production [39], putting into anaerobic systalk to recover energy [40]. Common solutions for peels are pyrolysis [41], anaerobic composting [42] and aerobic composting for the production of fertilizer without adding pulp in the production process [28].
Research on applying goal planning is very diverse and present in many fields, but there are very few studies on the cassava industry proposed a set of environmental indicators used in cleaner production assessment and applied a mathematical planning model for pollution reduction for the manufacturing plant [43, 44]. The study conducted by [45] provides a model to optimize transporting costs of cassava to processing facilities. In addition, the transport issue is also integrated in the studies of Takeshima and Winter-Nelson [44]; [43] calculated the transportation costs in the total purchasing cost for optimization. The work conducted by Chen Lin [46] proposes a linear programming model based on wastewater treatment input-output model for identifying the lowest emission choice among the wastewater treatment sollusions.
There is currently no research that proposes an overall production model/system for the cassava industry chain in an optimal way from farming to processing to minimize waste and impacts of the whole chain. Besides the positive impacts, the cassava starch industry also has various negative impacts on the environment. In order to increase the value chain of cassava production, this study applied a target planning techniques and circular economy approach to propose an optimal production model of the chain with purposes to prevent, reduce, reuse and recycle wastes in a zero-waste/emission direction for the cassava starch production chain. The study was carried out in Tay Ninh province (100 km apart from Ho Chi Minh City) which is the most concentrated area for cassava cultivation in Vietnam.
2. Materials and Methods
2.1 Research Sequences
The research methodology includes the following steps:
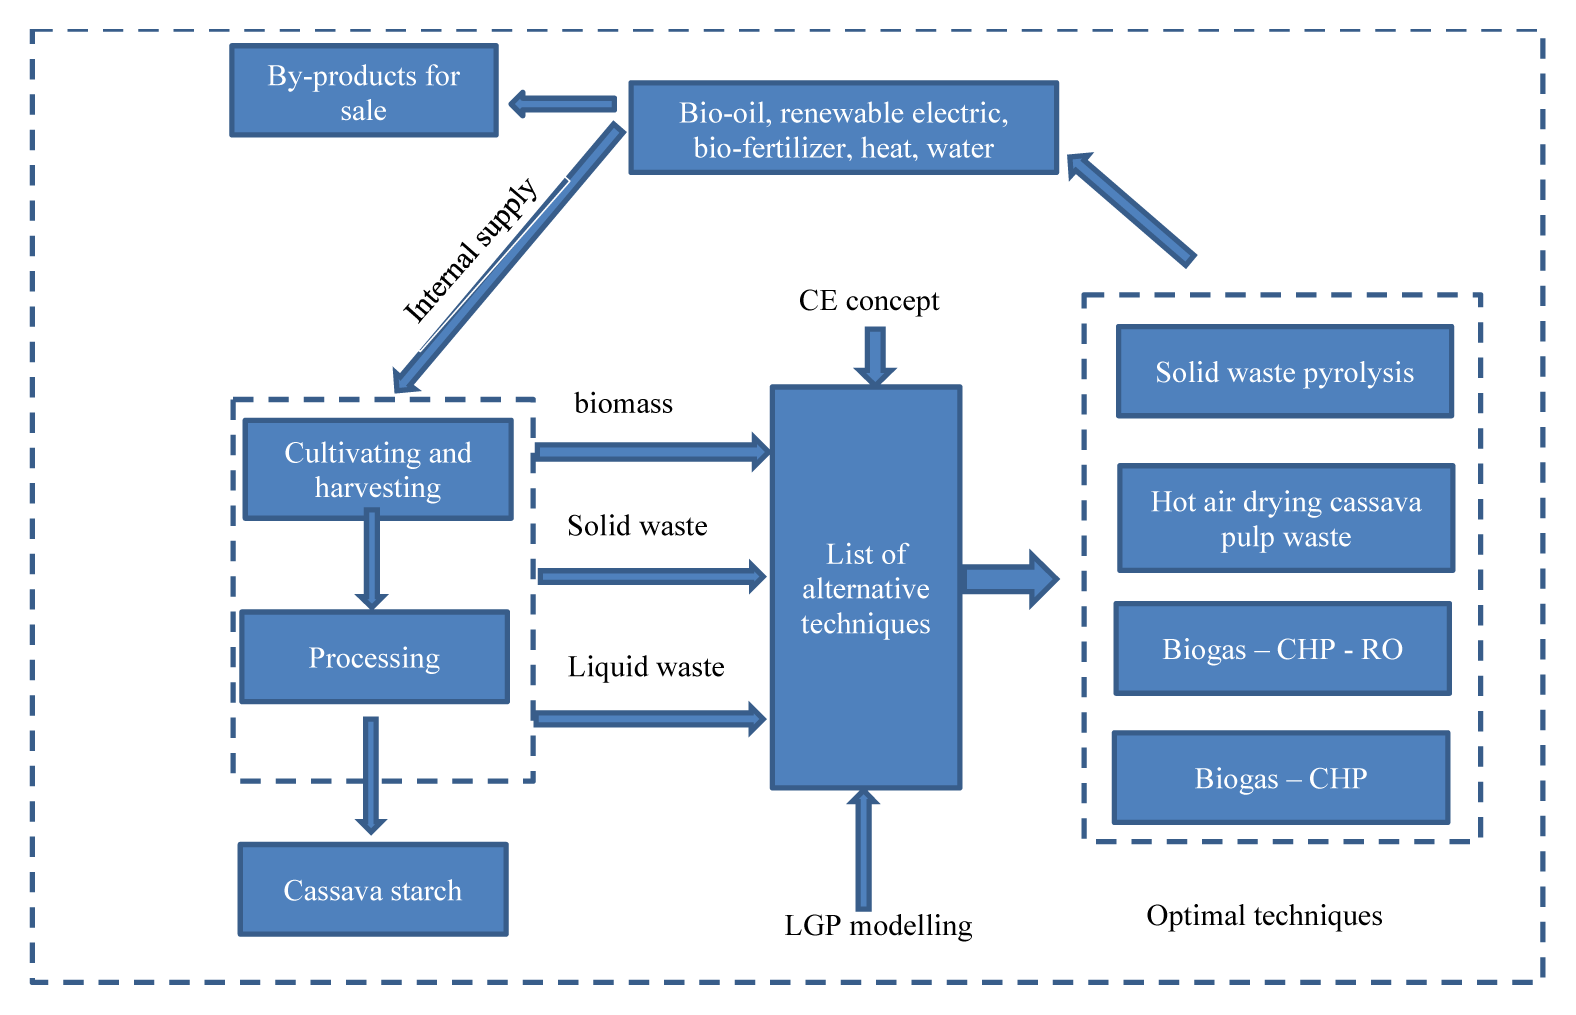
Step 1: Assessment on the current production and waste status, as well as the carbon balance of the industry chain (baseline status) which is shown Fig. 1.

The proposed study configuration of the circular economic model for a cassava starch production chain.
As shown in Fig. 1, in order to determine the carbon imbalance of the chain, a survey was conducted on the cultivation of 30 typical households which have different demands for energy, fuels, yield, plant varieties, and distances from the material supply location to the farming areas. At the same time, in order to determine the current fuel consumption in transportation, data of 30 means of transport together with their loads, numbers of kilometers traveled and amounts of fuel consumed were collected. Regarding the current production situation, data of cassava starch factories in the province were collected to determine the raw material purchasing areas, and data on the consumption norms of raw materials and fuel as well as the options for waste treatment were also captured. Based on the data on the C component of cassava tubers and by-products from cultivation, the total carbon absorbed from the growing process was calculated. The total CO2 equivalent emissions of the chain (CO2eq) was calculated on the basis of the data of raw materials, fuel consumption, and carbon emission sources of the chain. The difference between the carbon absorbed in crops and the C-CO2eq emissions is the carbon imbalance of the chain.
Step 2: Building a database of technical solutions related to the recovery and recycling of wastes in the production chain. Options of waste treatment, recovery, recycling and thermal processes, as well as their specifications are determined by using the data taken from the published literature. Then, a general diagram with all streams is built for the modeling purpose.
-
Step 3: Modelling the system toward the optimal circular goal based on a generalized process diagram that integrates all possible options. his study constructed the mathematical equations for the material and energy balance for the whole chain. With purpose to have the best circular model, this study proposed 5 criteria as follows:
- The ratio between CO2 uptake from farming and CO2 emissions in the chain is largest (highest).
- Fossil fuels are not consumed.
- Heat from additional energy sources is not consumed.
- Additional electricity from national power grid is not consumed.
- At the same time, GHG (Green house gases) emissions from transportation should be minimal.
Step 4: Solving the target planning problem and determining the optimal model. Based on data collected on the current status and data of technological options for the treatment of the waste streams along with mathematical equations describing the model, this study applied Lingo 9.0 software to determine parameters of the chain towards the optimal model. There are 2 tasks in this step:: Re-planing the transport network so that CO2 emissions from transportation are the lowest (or the sum of the product of distances and shipping weights from farms to factories is the smallest). The results of the material transport network planning together with data on technological options are used to determine the model of optimal technological solutions for the chain.
2.2 Optimal Circular Production Model Toward Zero Carbon Emissions For The Cassava Starch Production Chain in Tay Ninh
Currently, there are many options that have been studied and published to treat wastes arising from the operation of the cassava starch production chain, proven feasible, and typical technologies considered to be employed in this study are as follows:
Treatment options for cassava stalks: treatment with rapid pyrolysis; co-treatment with wastewater according to the biogas-CHP (combined heat power) technology model; co-treatment with wastewater according to the biogas-CHP-RO (reverse osmosis) technology model.
Treatment options for peels: treatment with windrow compost; treatment with anaerobic compost (burying) without heat recovery; treatment with anaerobic compost with heat recovery; treatment with slow pyrolysis.
Treatment options for production wastewater: biogas technology − CHP; biogas technology with heat recovery; co-treatment with pulp by biogas technology − liquid fertilizer; co-treatment with pulp + stalk + wastewater (ww): biogas −CHP- liquid fertilizer; co-treatment with pulp + stalk + ww: biogas − CHP-RO.
Treatment options for cassava pulp: Ethanol production with biogas recovery; Ethanol production, deeplagoon without biogas recovery; dried pulp as by-products for livestock; production of animal feed pellets; co-treatment with wastewater applying the technology for pulp + stalk + ww: biogas −CHP − liquid fertilizer; co-treatment with wastewater according to the technology for pulp + stalk + ww: biogas − CHP-RO.
In addition, the solution for transportation is CO2 emissions from transporting materials from supply regions to the factories are minimized. On the basis of integrating the above solutions, the integration model of solutions that can be applied to the current cassava industry chain is presented in Fig. 2.

Diagram of integrated management model of the cassava production chain.
The cultivation process is described in Eq. (1):
where N_total is the total amount of N fertilizer used for 1ha on average; m_ure, m_dap: are the amounts of Urea and DAP (Di-ammonium phosphate) fertilizers used for 1ha; 0.46 and 0.18 are conversion coefficients from Urea and DAP to N which are shown in Eq. (2, 3):
where P and K are the amounts of Phosphorus and Potassium fertilizers needed for 1 ha on average, P is only in DAP, K is only in KCl, DAP contains 20% P, KCl contains 52% K as Eq. (4):
where S_farm is the total hectares of cassava cultivation to supply for production needs, field_av is the average yield of cassava (ton/ha), root is the total amount of cassava produced (ton) as Eq. (5, 6):
where Stalk is the total mass of cassava stalks obtained from cultivation, Stalk_seed is the amount of stalks used for seeding, norm_stalk is the ratio between cassava stalks obtained and tubers, and norm_seed is the ratio between seeding stalks and the total stalks obtained.
Based on the wastewater treatment process, there are five production technologies as in Table S1.
The total amount of cassava materials for the production process is follows Eq. (7):
The total amount of peels and pulp generated from the production process (ton), norm_peel, norm_pulp are the average emission levels of peel and pulp from 01 ton of cassava materials as Eq. (8, 9):
Set wwef as the total amount of wastewater generated from the production process (m3), norm_ww is the average emission level of wastewater from 01 ton of cassava materials Eq. (10)
With the technology options for waste treatment from the cassava industry chain that have been studied for feasibility and published as presented in content 3.2.1, other variables are set in Table S2.
We have the material balance equation for peels, stalks and pulp as follows Eq. (11–13):
2.3 Calculation of Electricity Consumption and Production
Electricity consumption of the whole chain includes electricity consumed by farming activities (irrigation), starch production (including wastewater treatment), treatment of stalks, peels, and pulp. Set Elect_total as the number of kWh of electricity consumed by the whole chain, elect_farm as the electricity consumed by the farm, elect_fact as the electricity consumed by the starch factory, elect_pulp_m1 to m4 as the electricity consumed by the pulp processing processes according to the treatment options from m1–m4, elect_peel_m1 and m2 as the electricity consumed by the peels treatment options m1, m2 as Eq. (14):
The average electricity usages of the chain activities are as follows: farming process 44.4kWh/ha (according to the above calculation), production process 293.4 kWh/ton of starch, producing 01 liter of ethanol consumes 430 kWh on average (with the pulp_m1 and pulp_m2 options). Rewlay-ngoen et al. [39] dried 01 ton of wet pulp into dry pulp consumes 6.96/0.682 kWh, producing feed pellets from 01 ton of wet pulp consumes 11.5/0.682 kWh [38], producing fertilizer from 01 ton of dry peels using windrow compost technology uses 64.5 kWh [47]. Pyrolysis of 01 ton of dry peels requires 267 kWh [48], producing fertilizer from dry peels applying anaerobic technology without CH4 recovery consumes 220kWh/ton dry materials [49, 50], pyrolysis of stalks requires 1039 kWh/ton dry materials [37]. With the moisture content of cassava peel as 45%, cassava stalk as 63.5% and the input parameters of the production process, the above equation can be written as follows Eq. (15):
According to the diagram in Fig. 3, the peel treatment process by anaerobic composting technology combined with CHP and wastewater treatment technologies combining CHP will produce electricity to serve the activities of the production chain. Set Elect_product as the total kWh of electricity produced by the whole chain, elect_ww_m1, elect_ww_m4, elect_ww_m5, elect_peel_m4 as the amounts of electricity produced from wastewater treatment processes applying the treatment options m1–m4, elect_peel_m1 and m2 as the electricity amounts consumed by peel treatment options m1 and m2 as Eq. (16):

Carbon balance diagram in cassava starch production.
Wastewater treatment technology combined with CHP will produce 88.4kWh/ton of raw cassava materials [51], co-treatment technology for wastewater + pulp + stalk using biogas − CHP will produce 3834 kWh/ton of raw cassava materials. Co-treatment technology for wastewater + pulp + stalk with biogas − CHP − RO will produce 1156 kWh/ton of raw cassava materials [22], and the compost-CHP technology for peels will produce 430 kWh/ton of dried peels [49, 50]. With the moisture content of the cassava peels as 45% and the input parameters of the production process, the above equation can be written as follows Eq. (17):
2.4. Calculation of Heat Consumption and Production
The chain requires heat for drying starch in the production process, for ethanol production without heat recovery, and for fertilizer production from anaerobic composting of peels. Set heat_total as the number of MJ (thermal energy consumption) of the whole chain; heat_fact, heat_pulp_m2 and heat_peel_m3 as the required heat for the starch factory, treatment options for pulp and peels, respectively. In which the heat required for drying starch is 1311 MJ/ton starch, ethanol production requires 4.66 MJ/4.13 tons dry pulp [39], anaerobic composting of peels without heat recovery requires 3,000 MJ/ton of dry peels [49, 50] as Eq. (18, 19):
Some technological options of the chain are capable of producing heat such as wastewater treatment technologies with heat recovery and the treatment of peels with heat recovery. Set heat_product as the total MJ of heat produced by the whole chain, heat_ww_m1, heat_ww_m2, heat_ww_m3, heat_ww_m4, heat_peel_m4 as the heat produced from waste-water treatment processes according to the treatment options m1–m5, and from the peel treatment option m3. In which heat produced from the wastewater treatment technology options ww_m1 to ww_m4 are 342, 385, 377, 377 MJ/ton of raw cassava materials, respectively [22, 51]. Produced heat from biogas recovery - CHP when producing fertilizer from peels is 2600 MJ/ton of dry peels as Eq. (20, 21):
2.5. Calculation of Diesel Oil Consumption and Bio-oil Production
Diesel oil (DO) is a common fuel used in the production chain activities. Set DO_total as the total number of liters of diesel oil used for both production chain and treatment options; DO_fact as the amount of diesel oil used within the factory, do_vc as the diesel oil used for transporting raw materials to the factory; DO_farm as the diesel oil used for farming; DO_peel_m1 as the diesel oil used for peel processing technology m1. In which, the average fuel consumption in the starch factory is 8.3 liters diesel oil/100 tons of cassava, in cultivation is 22.9 liters diesel oil/ha, in transportation is 0.0077 liters diesel oil/km, and in peel processing technology m1 is 9 liters/ton. Setting qij and dij as the output and the transport distance from farm j to factory i, the total diesel oil consumption of the chain expressed is obtained by the following Eq. (22, 23):
Set demandi as the total material demand of factory i, Cj as the material output of farm j (specific values of demandi and Cj are shown in Annexes), the material balance for factories and raw material regions is obtained as follows Eq. (24, 25):
Bio-oil and bio-alcohol, collectively known as bio-oil, are the products of several wastes treatment options of the chain. Set bio_oil_product as the total MJ of bio-oil energy produced, et_pulp_m1, et_pulp_m2 as the amount of ethanol produced from the pulp, bio_peel_m2 and bio_stalk_m1 as the bio-oil obtained from the pyrolysis of peels. In which, 4.13 tons of dry pulp produces 1000 liters of ethanol [39], 1 ton of dry peels produces 512 kg bio-oil [41], 1 ton of dry stalks produces 610 kg bio-oil [37]. And the average calorific value of bio-oils is 20 MJ/liter or kg as Eq. (26, 27):
2.6. Calculation of CO2 Accumulation from Farming and Production Chain
CO2 gas emitted from the cultivation process is accumulated in the cassava tubers and stalks. Set CO2_absorb as the total number of tons of CO2 absorbed from the cultivation process, C_root, C_stalk as the carbon accumulated in the cassava tubers and stalks. In which, the C contents in tubers and stalks are 40% and 44% of dry weight respectively, moisture content of tubers is 65%, of stalks is 63.5% as Eq. (28, 29):
The CO2 emissions of the chain include those from fertilizer use, diesel oil use, CH4 recovery and combustion from waste-water treatment/co-treatment with pulp and stalks, and from peel treatment options. Set CO2_fer as CO2 emission from fertilizer use, together with the emission coefficients in Table 1 and describes in Eq. (30):

CO2 Emissions from Farming and Production.
When total diesel fuel serving the chain is replaced by bio-oil, with calorific value of diesel oil is 45.5 MJ/kg, calorific value of bio-oil is 20 MJ/kg, and carbon content of bio-oil is 51.5%, CO2 emissions from fuel use is described in Eq. (31):
CO2 emission from wastewater is due to the recovery and burning of CH4, of which 1 kg of COD in wastewater will produce 0.25 kg of CH4, in case cassava pulp is added, 60% of the C in the pulp will convert to CH4. Burning the cassava stalks will convert all C to CO2, so CO2 emissions from wastewater treatment and wastewater co-treatment options (from ww_m1 to ww_m5) are described in Eq. (32) :
Regarding CO2 emission from peel treatment process, 56% of contained C in peels will be decomposed to CH4 or CO2. For the option that CH4 is not recovered and burned, the conversion coefficient of 1 kg CH4 to 25 kg CO2 is applied as in Eq. (33, 34):
From the above equations, we have the total tons of CO2 emissions of the whole chain is described in Eq. (35):
2.7. Objectives and Conditions to Be Achieved
According to the criteria proposed in content 2, the conditions towards the best circular model are:
The ratio between CO2 uptake from farming and CO2 emissions in the chain should be maximized as in Eq. (36):
Fossil fuels are not consumed in Eq. (37):
Heat from additional energy sources is not consumed as Eq. (38):
Additional electricity from national power grid is not consumed as Eq. (39):
GHG emissions from transportation should be minimal, in other words, sum of product of distances and shipping weights should be minimized in Eq. (40).
Solve the problem of target planning and determine the parameters of the model:
Based on data collected on the current status and data of technological options for waste treatment along with the mathematical equations described in the previous sections, the software Lingo 9.0 is applied to determine the parameters of the optimal circular model.
Fig. S1 is describing the activities of the cassava production chain in local area (Tay Ninh province, Vietnam). The analysis on the current status (CO2 emission, carbon balance) of the chain is based on different steps of the chain: farming (at the cultivation areas), transporting raw materials to the factory, and production processes at the factories (local companies).
3. Results and Discussion
3.1 CO2 Emissions and Carbon Balance of The Cassava Production Chain
Farming (at the cultivation area): the demands for raw materials and output in the process of cassava cultivation in Tay Ninh through the results of a survey of 30 typical households (details as shown in Table S3) are as follows:
Average yield: 30.3 tons of tubers/ha
The amount of fertilizer used is: 131.1 kgN/ha, 50.5 kgP/ha, 83.9 kgK/ha and 542.3 kg CaO/ha, organic fertilizer: 990.2 kg/ha.
Energy: Electricity is used for irrigation with an average amount of 44.4 kWh/ha, diesel oil used for farming equipment is 22.9 liters/ha on average.
Cassava stalks after harvest: 18.8 tons/ha.
Cassava stalks used as seedlings on average: 758.7 kg/ha
The average distance from the location of purchase of agricultural supplies to the farm is 9.5 km.
CO2 emissions were obtained from farming: mainly from electricity consumption for irrigation, diesel oil for agricultural machine operation, from fertilizers and plant protection products, and from transporting agricultural supplies. The average CO2 emission results from farming calculated for 1 ha are presented in Table 1(a, b):
With an average yield of 30.3 tons/ha, the average CO2 emission coefficient is 64.66 kgCO2e/ton of cassava. There are 35 areas of raw materials for supplying to local factories in Tay Ninh province, of which 70% are mainly imported from Cambodia, therefore, with the output as shown in the supplementary materials, the total emission from farming process in Tay Ninh is 743,555,560 kg CO2e, and the value in Cambodia is 1,356,620,489 kg CO2e (because there is no data for the farms in Cambodia, emission coefficients are considered to be similar to that in Vietnam).
3.1.1. Transportation of raw materials to the factory
The total demand for raw materials for factories is about 5 million tons of cassava/year (Table S4) and the average distance from raw material areas to factories is 50–51 km (Table S5). The amount of diesel oil in transporting cassava is 0.0077 liters/km/ton (Table S6). Based on the data of the current situation of cassava collection in raw material areas, current status of CO2 emissions from the process of transporting cassava to factories were calculated as follows (Table S7), in which the total CO2 emission for 39 factories is 68,737,489 kgCO2e, corresonding to the total number of raw materials: 5,060,484 tons cassava/year.
Emission from transporting cassava to the factories is 13.58 kg CO2e/ton. If the total emissions from farming and transport are taken into account, the emissions is 78 kg CO2e/ton cassava, which is similar to the average amount of 58–96 kg CO2e/ton cassava from other studies of typical factories in Thailand [53].
3.1.2. Production process at the factory
Currently, cassava factory in Tay Ninh has a total capacity of about 1,255,800 tons of starch/year. According to the assessment in Table S7, the average amount of water used in cassava starch factories in the Tay Ninh province is 17.4 m3/ton product. Thus, with this total capacity, the current amount of water used is 21,896,000 m3/year, electricity used is about 300 million kWh/year, diesel oil for equipment in the plants is 415 thousand liters/year. Peels are about 146 thousand tons/year, and about 713 thousand tons of pulp/year (see Table S7). The CO2 emitted from the production process is mainly from electricity, biogas recovery from wastewater and from the composting process of the peels as shown in Table 1b above.
The above data in Table 1b shows that the largest emission is from the composting process of the peels under anaerobic conditions, which emits CH4 into the environment (each kg of CH4 is equivalent to 25 kg of CO2). The average emission per product unit in the production process is 2,210 kg CO2e/ton of starch (for the purpose of calculating the carbon balance, this study included emissions from biogas combustion and peels processing). In comparison, the emissions from production of the study of Usubharatana et al. [53] were 560–635 CO2e/ton starch. The reason for this difference is that the study by Usubharatana et al. [53] did not take into account emissions from peels treatment and biogas, and the emission coefficient of the Thailand power grid at the time of calculation was lower than that of Vietnam (0.6093 kg CO2e/kWh versus 0.8485 kg CO2e/kWh).
3.1.3. Assessment of total greenhouse gas emissions from the starch production chain
The total GHG emissions from the cultivation, transportation and production of cassava starch are generalized in Table 2 as follows:
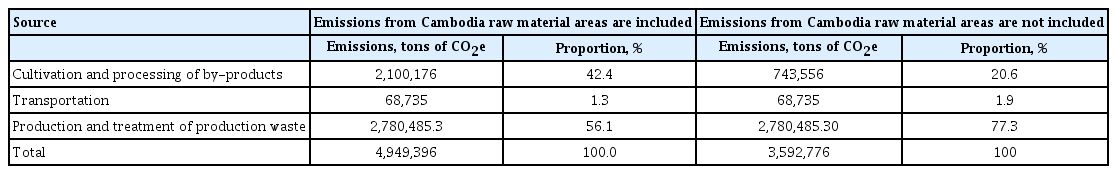
Total Greenhouse Gas Emissions of Tay Ninh Cassava Starch Industry.
With the total production of starch is 1,255,800 tons/year and the emissions of the cassava industry has been audited, we can calculate the emission coefficient per 1 ton of starch in Tay Ninh is 3.94 tons of CO2e/ton of starch and 2.86 tons of CO2e/ton of starch (in the case of excluding emissions from the cultivation process in raw material areas outside the province).
3.1.4. Assessment of carbon balance from the production chain
Cassava is considered a carbon-fixing plant, carbon is taken mainly from CO2 in the air and is fixed in the stalks, leaves, and tubers. The carbon flow diagram in the production process chain is shown in Fig. 3.
The carbon content in tubers is about 40% dry weight [54], in stalks and leaves is 44% dry weight [55]. Based on the production status, the absorbed carbon is calculated as in Table 3.
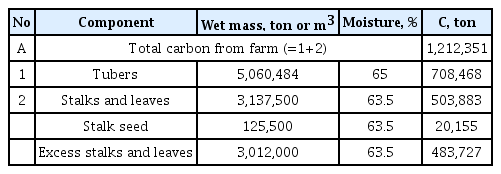
Mass of The Carbon Flows.
The above data show that the total carbon absorbed from farming is 1,212,351 tons C/year, equivalent to 4,445,287 tons CO2/year. Meanwhile, the total CO2e emission of the production chain is 4,949,396 tons of CO2e/year. Therefore, according to the CO2e balance, the carbon emissions are higher than the carbon absorbed from the farming process. In particular, the production chain emits 504,109 tons of CO2e/year. So the problem here is to find a solution for the cassava production chain which can help towards zero carbon emission and even carbon absorption which can contribute to the reduction of carbon emissions from other activities.
3.2 Determination of The Optimal Production Chain Model for The Cassava Industry in Tay Ninh
3.2.1. Optimization of the material collection network
By solving LGP (Linear goal programming) equation 40, the model results show that, to minimize CO2 emissions, the material supply network needs to be redesigned. When optimizing the material transportation and collection network, 44,777 tons of CO2 will be emitted per year, compared with the current emissions of 68,737 tons of CO2 (23,960 tons of CO2 will be reduced yearly, equivalent to a decrease of 34.8%). The results of the re-planning show that 10 factories will obtain materials source internally in the province, 21 factories must get materials from Cambodia, and the remaining factories will collect materials from both sources (specific results are presented in Table S9). The result of transport network optimization will be used to optimize the model's production chain.
3.2.2. Optimal production model
Lingo 9.0 software is used to solve LGP equation 36 and determine the parameters of the model. The results in Fig. 1 show that about 2.2 million tons/year out of the total excess cassava stalks (excluding the seeding stalks) after harvesting are treated by pyrolysis technology to produce bio-oil. The rest will be treated with biogas-CHP and biogas-CHP-RO systems to recover and provide energy for the production process. All peels are processed by pyrolysis technology to recover bio-oil. Total amount of bio-oil from the production chain is about 520,000 tons/year. Although bio-oil can not be used directly for internal combustion engines yet, it is a raw material for biodiesel production plants. Therefore, bio-oil can be considered as a substitute for fossil fuels in the production chain. In addition, bio-oil from biomass pyrolysis is also a source of raw materials for pharmaceuticals, production of biological plant protection products, etc. All the generated pulp is anaerobically treated together with wastewater applying biogas −CHP technology. The results show that all CO2 emissions from different sources are completely absorbed by the cassava cultivation process and the chain also absorbs about 2.7 million tons of CO2 from other sources. Furthermore, the chain can also be completely self-sufficient in terms of electricity, fuel, and fertilizer which are even surplus and can be sold to external markets. These results satisfy the goals of zero CO2, zero fossil energy and electricity. Summary of the model results is shown in Table 4, and the planned diagram for the integrated management model of the cassava production chain towards optimization is depicted in Fig.4.

Summary of The Main Results of The Optimal Production Chain.
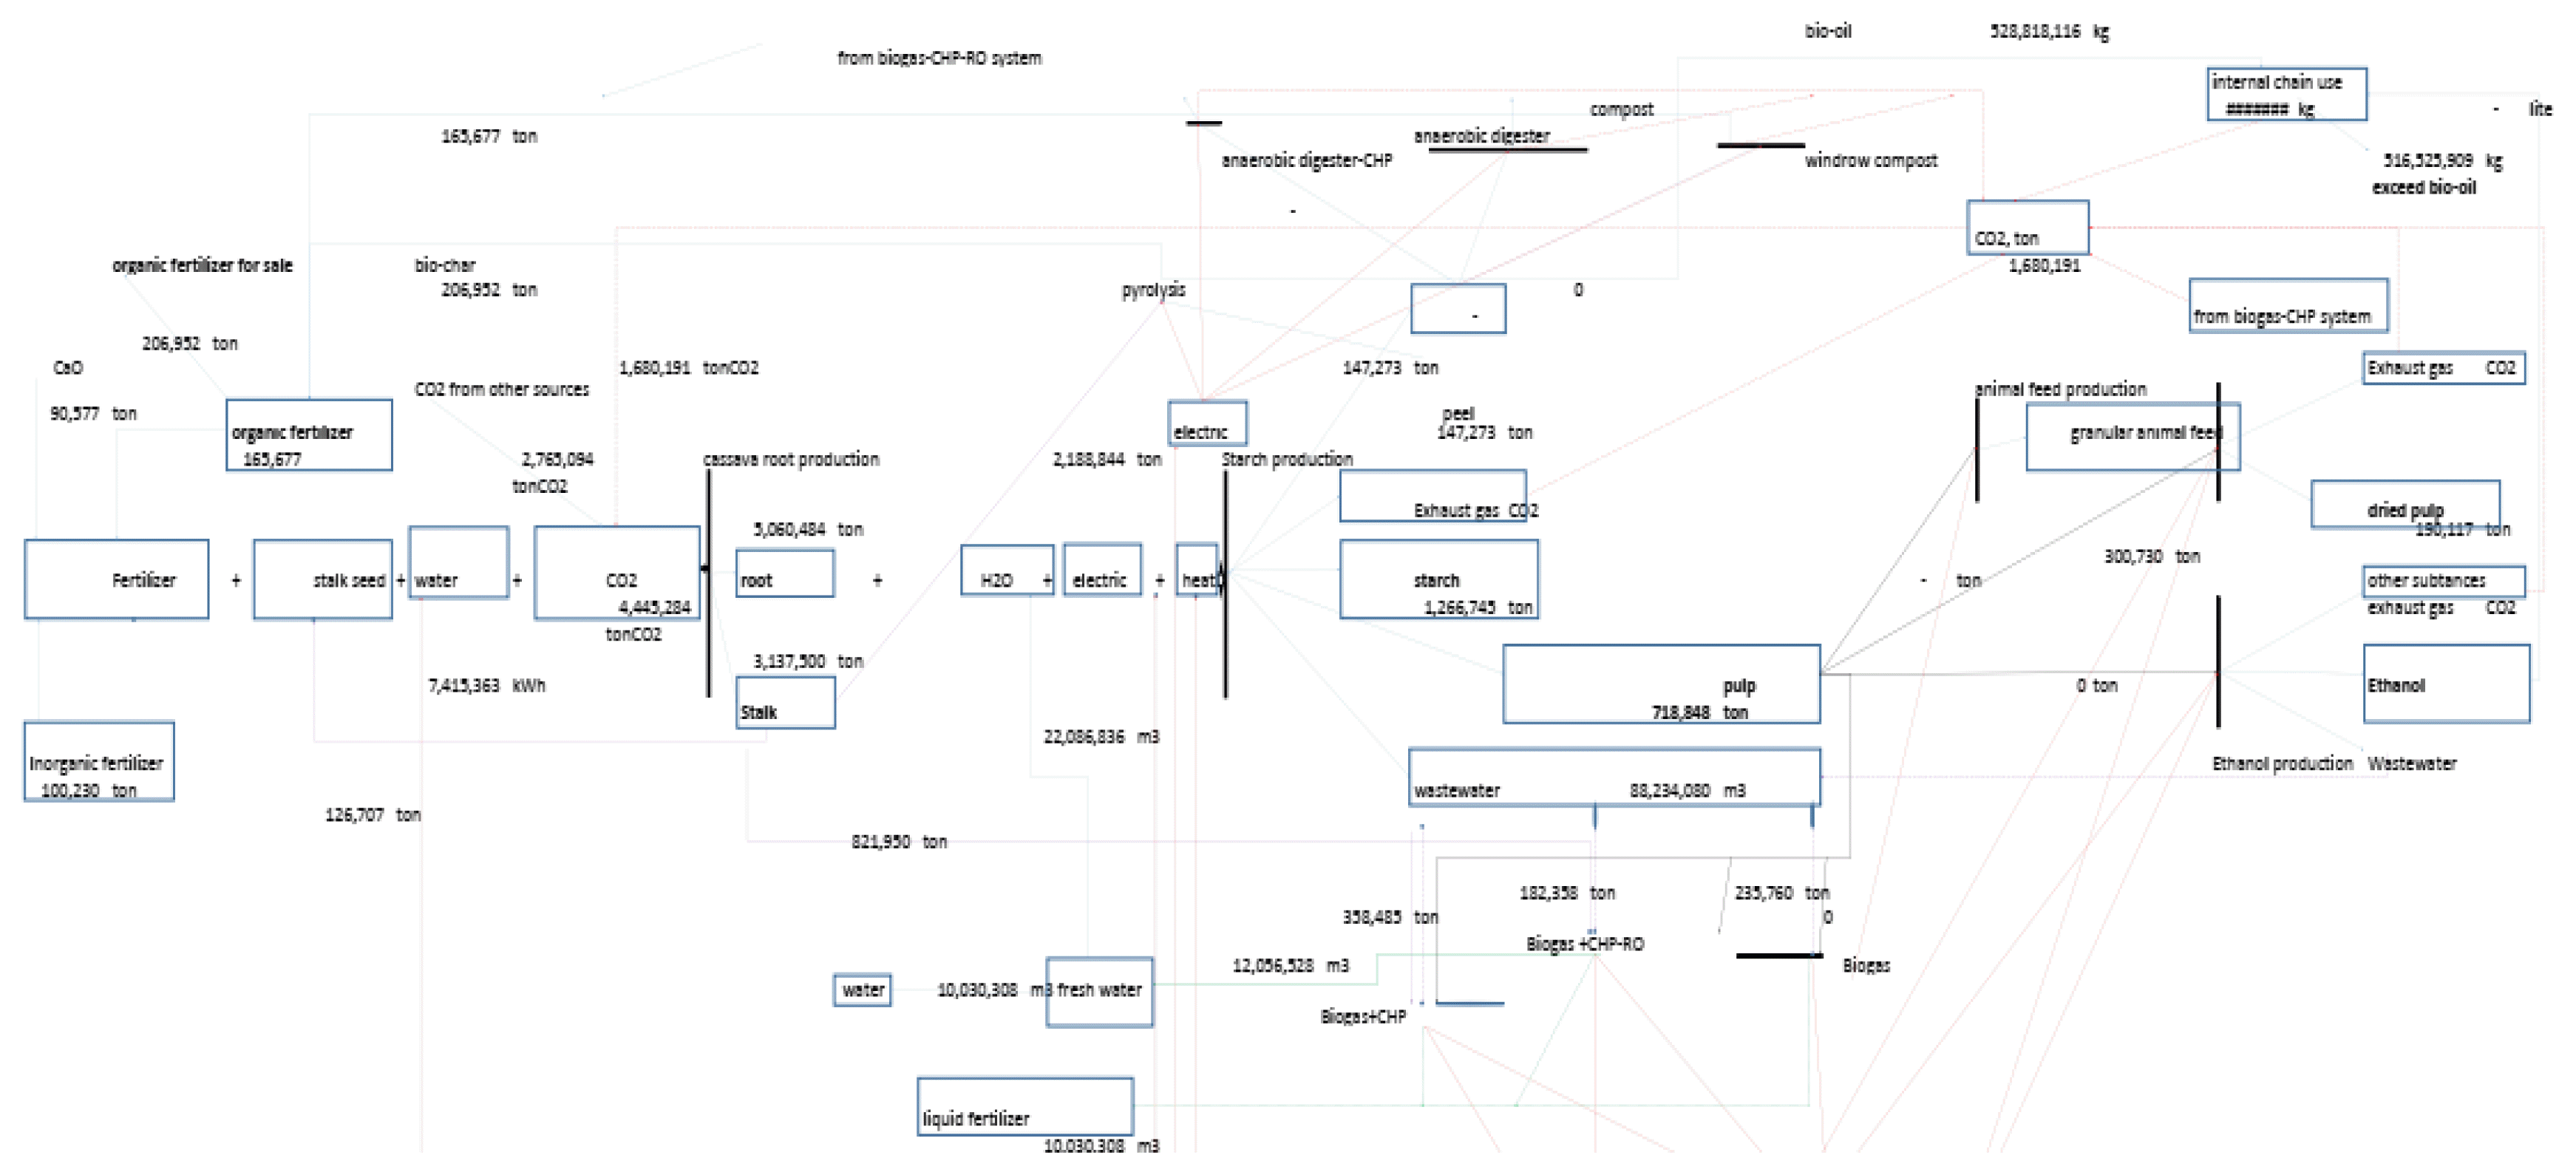
Planned diagram for the integrated management model of the cassava production chain towards optimization.
To achieve the above goals, the treatment technology orientation is shown in Table S10, in which the technical options such as Pyrolysis, bio-oil recovery, Seeding, Biogas_CHP technology, and Biogas_CHP-RO technology could be applied for cassava stalk; while Biogas_CHP-RO technology could be used for cassava peel; and for the cassava pulp we can use the options like Biogas_CHP-RO technology, Biogas_CHP technology, or direct use as Animal feed (from dried pulp).
4. Conclusions
In general, circular economy is the current inevitable trend in order to organize production efficiently and sustainably with the environment. This study applied the main principles of the circular economy and proposed a model for the starch production chain in Tay Ninh province resulted the principle of building circulations from farming to production. Thanks to the circular model, the inputs of the chain are minimized and the goals of zero electricity, zero waste, zero fossil energy are achieved. In addition, the output products of the chain include 517.5 thousand tons of bio-oil/year, 206.7 thousand tons of biochar/year, 190 thousand tons of dry pulp/year, creating added values of the chain. Besides that, the chain also has about 10 million m3/year liquid fertilizer after anaerobic tank that can be used to supplement nutrients for plants or produce micro-algae. Future researches need to evaluate the effects of bio fertilizer from cassava peel on crop yield as well as the feasibility of microalgae production under practical conditions in Tay Ninh, which is considered the capital of Vietnam's cassava industry. The surplus by-products have created biological inputs for other types of farming, contributing to the formation of a industrial-agricultural symbiosis model between the starch industry and other fields.
Supplementary Information
Acknowledgements
This research is funded by Vietnam National University - Ho Chi Minh City (VNU-HCM) under grant number NCM-2020-24-01. The authors would like to thank to the Department of Natural Resources and Environment (DONRE) in Tay Ninh province for assistance during site investigation and data collection, and ASEAN-European Academic University network (ASEA-UNINET) for collaboration with IPPE, TU Graz, Austria, to implement this study. Special thanks to Mr. Mark Looney (Environmental Source Samplers, Inc., Wilmington, NC, mark@essknowsair.com) for your elaborative language editing on our manuscript.
Notes
Conflict-of-Interest Statement
The authors declare that they have no conflict of interest.
Author Contributions
V.V.G. (PhD student) collecting data, doing experiments, preparing for the manuscript draft; T.V.T. (Doctoral researcher) support the analysis tool; T.L.L. (Assoc. Prof): revised the manuscript, final checking, H.S. (Prof.): manuscript checking, L.T.H. (Prof.): sketch the idea, manuscript revision.