Emergy-based comparative analysis of an ecological economy in the Yangtze River Delta
Article information

Abstract
The Yangtze River Delta (YRD) has abundant regional advantages. Its rapid economic development plays an essential strategic role in China’s overall growth; however, this place significantly pressurized on resources and the environment. Accordingly, this study developed an evaluation index and system of sustainable development for a green economic system based on the emergy theory. Moreover, comparative analyses were made according to the present ecological–socioeconomic systems of the YRD. The results indicated a large gap between the production efficiencies of the three provinces and a single city in the YRD. The highest emergy yield ratio was in Anhui Province, but the corresponding emergy yield per capita and emergy output density was the lowest; the environmental load ratios were all > 10, which is considered a high load; the sustainable development indices were all < 1, which represents a state of unsustainable development. According to the present research results, suggestions for the sustainable development of the YRD were put forth here. This research provides theoretical and methodological support for the sustainable development of an ecological economy in the YRD. It can serve as a decision-making reference for China to achieve the goal of carbon peak and carbon neutralization.
1. Introduction
The conflict between rapid economic development and social or ecological well-being has become prominent [1]. Hence, determining how to optimize this balance and overcome the conflicts between economic development and environmental protection [2] is essential for modern ecology. As the world’s second-largest economy and the most populous country, China has put forward the “30.60” response to global climate change; 30 implies that it will strive to reach the peak of carbon emissions by 2030, and 60 indicates that it aims to achieve carbon net neutrality by 2060. The Yangtze River Delta (YRD) is one of China’s most advanced and economically developed regions and is endowed with abundant resources. However, the long-term and high-intensity progress of China has been achieved through high resource consumption and pollution emissions, which have overloaded the local ecological system. In recent years, the YRD has vigorously promoted the construction of an ecological civilization, which has significantly improved the environmental quality of the region [3]. Nonetheless, environmental concern remains an important factor restricting further development of the region [4]. In 2021, the state proposed that development should be based on the efficient use of resources, strict protection of the ecological environment, and effective control of greenhouse gas emissions. This is essential to promote high-quality development, ensure high-level protection of environmental resources, and create a green, low-carbon economic system based on circular development. Environmental integrity and economic development can complement each other; moreover, sustainable development is an essential indicator of the coordination between economic and environmental resources and is important to ensure high-quality development. Accordingly, it is essential to assess the sustainable development potential of the YRD region to promote high-quality development while achieving the goal of carbon peak and neutralization.
The sustainable development of the urban eco-economic system is the key to sustainable human development and one of the United Nations’ 17 goals for global sustainable development [5]. The sustainable evaluation of urban eco-economic systems has garnered much attention. At present, there are several methods to evaluate its progress, including the economic/environmental single ratio method [6, 7], index system method [8, 9], and data envelopment analysis [10]. In recent years, material flow analysis [11, 12], life cycle assessment [13], the ecological footprint method [14, 15], among others, have been introduced for the evaluation of ecological efficiency, thereby enriching the theories and methods of ecological efficiency evaluation. The index of regional eco-economic sustainable evaluation has gradually changed from single-to multi-factorial, overcome the subjective issue of weight-setting, and changed to an objective model simulation. However, these methods are less concerned with environmental integrity and resource utilization of the socioeconomic system, and hence, the contribution of healthy ecosystems to the local economic development cannot be reasonably evaluated [16].
Emergy theory is an objective method to evaluate the sustainable development ability of a regional eco-economic system at different scales by quantitatively analyzing the actual monetary value and relationship between resources, environment, and economic activities [17]. Odum first proposed the emergy analysis theory in the 1980s. Using the emergy conversion rate, different substances and energies in the natural environment and economic system are converted to an order of magnitude index, the solar Joule [18]. This process overcomes the deficiency of comparing different, incompatible energies and currencies that otherwise could not be compared in traditional energy analyses and provides a new perspective for understanding the relationship between natural resources and human activities. It has been widely applied for the evaluation of sustainable development across different landcover types, such as agricultural fields [19], industrial fields [20, 21], engineering projects [22, 23], and other related fields [24–26]. Emergy theory is also applicable for sustainability evaluations of regional economic ecosystems, including assessments of the eco-economic and social coordination of city-level [26] as well as entire province-level [27, 28] systems. Recently, scholars have begun to study the ecological-economic coordination of cross-regional urban agglomerations and the health of internal cities, such as the Fujian Delta [29] and Taihu Lake [30]. Furthermore, emergy theory can be combined with comparative analysis to directly and objectively identify the differences in efficiency and sustainability of different ecosystems [31–33].
Presently, there are some limitations regarding emergy theory research for regional economies: (i) Most scholars have analyzed the emergy of a specific region for a given year, reflecting the resource utilization structure and sustainable development of the region to a certain extent, but the analyzed emergy is not reflective of the dynamic characteristics and development trends of the system. (ii) Urban agglomerations and regional integration are complex heterogeneous systems and multi-dimensional structures with highly intensive emergy flow, which are formed by the interaction and coupling of the eco- and economic systems. These regions serve as hubs for strategic support and growth in China’s productivity distribution pattern; however, they are burdened with increasingly severe resource and environmental stressors owing to the development. At present, the research on the sustainable development of urban agglomerations and integrated regions is relatively lacking.
The present research employed emergy analysis theory and the sustainable evaluation index system method. Using the YRD as an example, the emergy input required to maintain the operation of the YRD ecological economic system was quantified. For the sustainable development of various locations within the integrated region, an emergy-based index evaluation system was constructed using quantitative research and comparative analysis, which revealed the historical evolution and impacts of the regional eco-economic system. Such research can improve the theoretical basis of regional integration sustainable development and provide reliable reference evaluations and decision-making bases for the sustainable development of system planning integration; thus, relevant data and conclusions can provide decision support for industrial and government managers.
The innovation of this study is that the emergy method is used to measure the input and output of various ecological and economic resources in the economy of urban agglomeration, which provides a unified scale for measuring and comparing various energies. The evaluation index system is constructed by adding indicators such as emergy output per capita (ECO) and emergy output density (EAO) and introducing emergy waste ratio (EWR) into the revised emergy sustainable development index (ESI), which can more accurately and genuinely reflect the sustainable development level of the regional economy. Moreover, the combination of dynamic and comparative analysis is used to evaluate the economic system of urban agglomeration rather than that of a single city, thereby expanding the research scope.
To this end, the following research framework was employed: Section 2 describes the methods and evaluation indices, particular from the economic, natural, and sociological dimensions, to construct an overall sustainability evaluation index; Section 3 discusses the sustainability of the YRD eco-economic system based on the created index, and the effectiveness and feasibility of the method are verified, and Section 4 presents the conclusions of the research. The methodology flow chart is illustrated in Fig. 1.
Methodology flow chart.
2. Methods
In this section, we briefly introduce the basic theory of emergy and define the boundary of the regional eco economic system before pointing out the direction of energy flow, material flow, and money flow in the system. Finally, based on previous studies, we construct the evaluation index of sustainable development ability from four aspects: nature, economy, society, and sustainable development.
2.1. Emergy Theory
Emergy is a new scientific concept founded by H. T. Odum; it is defined as the amount of energy of another type contained in flowing or stored energy [18]. The essence of emergy is the energy contained in the matter; as the various forms of energy on the earth are transformed by solar energy, solar emergy is usually used as the benchmark to measure various energy.
The emergy analysis method converts different materials and energy flowing and stored in the eco-economic system (such as rain, wind, coal, oil, natural gas, capital, technology, and labor.) into a unified solar energy value for quantitative analysis. It provides a novel method for studying the contribution of ecosystems to socioeconomic development and is calculated according to Eq. (1):
where EM is emergy, UEV is the emergy conversion rate of different materials or energies, and N is the input stream of different units (mass, g; energy, J).
It is necessary to determine the boundary of the eco-economic system in the YRD by collecting data on the natural environment, geography, and regional economy to identify the primary energy sources, components, and interrelations of the regional eco-economic system; the flow direction of energy, materials, and money; and clarify the relationships between each component of the system and the environment. The primary emergy input values of regional eco-economic systems include renewable energy, such as solar, wind, and rainwater, which are distributed free of charge; non-renewable natural resources (i.e., fossil fuels), such as coal, oil, and natural gas; and, economic feedback emergy of imported goods, fuel, and capital from the economy. The output emergy of regional economies primarily refers to agriculture, industrial products, and various services, such as wastewater, waste gasses, and solid waste formed in production and service [34].
2.2. Evaluation index System
Emergy evaluation index system comprises an emergy calculation index and emergy measurement evaluation index. Emergy calculation index includes local renewable resource emergy (EMR), local non-renewable resource emergy (EMN), external input emergy (i.e., economic feedback emergy (EMI)), output emergy (EMO), and waste emergy (EMW).
Based on the emergy index, by reviewing relevant emergy resources in the literature and combining this knowledge with the actual status of the regional economy, the emergy evaluation indices were constructed from four aspects of sustainable development as well as natural, economic, and social subsystems to evaluate ecological efficiency and growth of the regional eco-economic system [35].
2.2.1. Natural subsystem evaluation index
(1) Emergy self-sufficiency ratio (ESR) refers to the ratio of the emergy input of local resources (including renewable resources and non-renewable resources) to the total emergy input [36]. The mathematical representation for ESR is:
ESR can reflect the regional resources endowment and the support capacity of the natural environment. The higher the ESR, the stronger the support capacity of the natural environment and the greater the regional resources.
(2) Environmental load ratio (ELR) refers to the ratio of non-renewable resource input (including local non-renewable resource emergy and economic feedback emergy) to renewable resource emergy input. The mathematical representation for ELR is:
A high ELR indicates that regional economic activities exhibit a high utilization intensity of the natural environment and bring tremendous pressure to the environmental system [37]. ELR plays an early warning role in the development of the economic system.
(3) Emergy waste ratio (EWR) is the ratio of waste emergy to the regional economic output and output (expressed in terms of Gross Domestic Product (GDP)). The mathematical representation for EWR is:
This index is used to measure the pollution degree of unit output to the ecological environment in the economic system. The higher the EWR, the greater the pollution of unit output to the ecological environment [38].
(4) Waste emission intensity (EWA) refers to the ratio of waste output to the area. This index reflects the pollution degree of the natural environment due to economic activities.
2.2.2. Economic subsystem evaluation index
(1) Emergy yield ratio (EYR) refers to the ratio of emergy generated in regional economic activities (including renewable resource emergy, non-renewable resource emergy, and economic feedback emergy) to the economic feedback emergy [17]. The mathematical representation for EYR is:
The index reflects the economic efficiency and competitiveness of the regional economic system. The higher the EYR, the higher the efficiency of the region’s production and operation of economic activities.
(2) Emergy yield per capita (EPO) refers to the ratio of regional output emergy to the population. This index can be used to measure the productivity of the regional labor force.
(3) Emergy output density (EAO) is the ratio of the emergy of regional output to the area. It is used to calculate the output level per unit area and then evaluate the efficiency of a regional economic system.
2.2.3. Social subsystem evaluation index
(1) Emergy per capita (EPC) refers to the per capita emergy consumption of the region; that is, the ratio of the total emergy generated by economic activities to the total regional population. It is an index evaluating the material living standard and quality of the people in the region. The living standard is higher in areas with higher EPC.
(2) Emergy per unit area (EPA) refers to the ratio of the total emergy use of a region to the area. This index is used to evaluate the level and intensity of economic development in the study area. It reflects the quality of life and welfare of the local people. A higher EPA in the study area indicates a more developed economy and a higher quality of life.
2.2.4 Sustainable development evaluation index
Emergy sustainable development index (ESI) was put forward by Brown and Ulgiati in 1997 and defined as the ratio of EYR to ELR [39]. The sustainable development level of the regional economic system is not only directly proportional to the EYR and inversely proportional to the ELR, but also inversely proportional to the EWR. Therefore, the revised emergy sustainable development index (ESI’) is introduced, and its calculation formula is:
The index reflects the sustainable development level of the regional economic system. The larger the index value, the more sustainable the regional economy.
3. Results and Discussion
To verify the feasibility and effectiveness of the proposed methods, relevant data were collected and combined with the evaluation index system that was constructed (detailed in Section 2) to evaluate and discuss the sustainable development ability of the region.
3.1. Background
The YRD is located along the center of the Asian Pacific coast, in the lower reaches of the Yangtze River, where it intersects the Yellow and East China seas. It consists of the alluvial plain formed before the Yangtze River enters the sea. According to the “Yangtze River Delta regional integration planning outline” issued by the Communist Party of China Central Committee and the State Council in 2019, the region contains 41 cities in Shanghai, Jiangsu, Zhejiang, and Anhui provinces. It covers an area of 358,000 km2, ~3.7% of China’s total land area, as shown in Fig. 2.
Yangtze River Delta research area.
At the end of 2019, the YRD had a population of ~227 million, most densely populated regions of China. The region is rich in ~16% of China’s total residents, making it one of the three natural resources, with convenient transportation and numerous ports located along the river. Moreover, two comprehensive national science centers, approximately one-quarter of the “double first-class” universities in the country, state key laboratories, and the National Engineering Research Center are located in the region and contribute to the regional importance of scientific and technological innovation. In 2019, the GDP of the YRD region, which has < 4% of China’s total land area, was 23.72 trillion yuan; it accounts for nearly one-quarter of the country’s total economic output, one-third of the total import-exports, and one-third of the foreign (in)direct investment, which plays an essential role in the economic construction of the country. The YRD region is one of China’s most rapidly developing economies, exhibiting a great degree of openness and the strongest innovation abilities; it exhibits flourishing science and technology, culture and education, and active international trade and cooperation. The YRD urban agglomeration has become one of the six internationally recognized world-class urban agglomerations, with the largest area and population. However, economic development has brought about air pollution, a sharp decline in vegetation, and land degradation, while the ecological environment is being seriously damaged. The exploration and practice of sustainable development in the Yangtze River Delta are conducive to its structural optimization, industrial upgrading, and sustainable development, which in turn promote the formation of a demonstration effect and provide a reference for the sustainable development of other urban areas agglomerations in the world.
3.2. Calculations and Results
Based on the data collection and sorting of natural geography, economy, society, and waste emission in YRD from 2010 to 2018 (Table S1, S3, S5, S7), the present research selected the appropriate emergy conversion rate through a review of the reference literature and obtained emergy data of the input and output materials or energy primarily from the China Statistical Yearbook, provincial statistical yearbooks, and government announcements. The emergy flow data for Anhui (Table S2), Jiangsu (Table S4), Zhejiang (Table S6) and Shanghai (Table S8) were obtained, combined, and summarized to form the emergy flow of the YRD eco-economic system from 2010 to 2018 (Table 1).
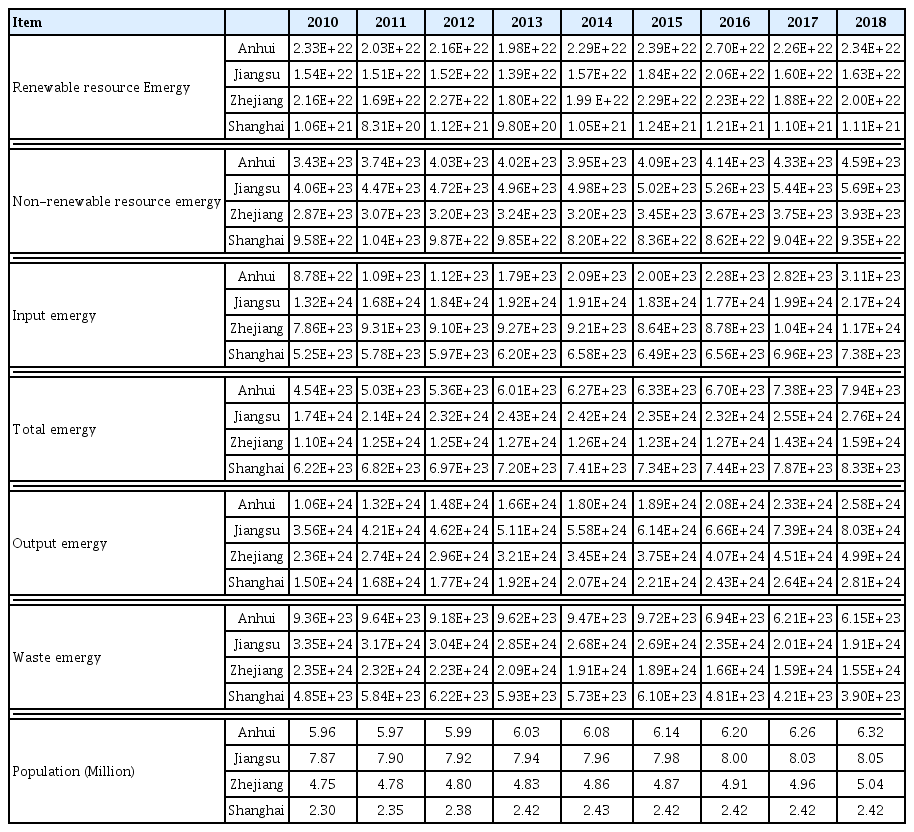
Summary of Main Emergy Flow in the Yangtze River Delta, 2010–2018
According to the relevant emergy data, combined with the evaluation index system of the eco-economic system constructed in Section 2, the index values of the three provinces above and one city in the YRD were obtained (Table 2).
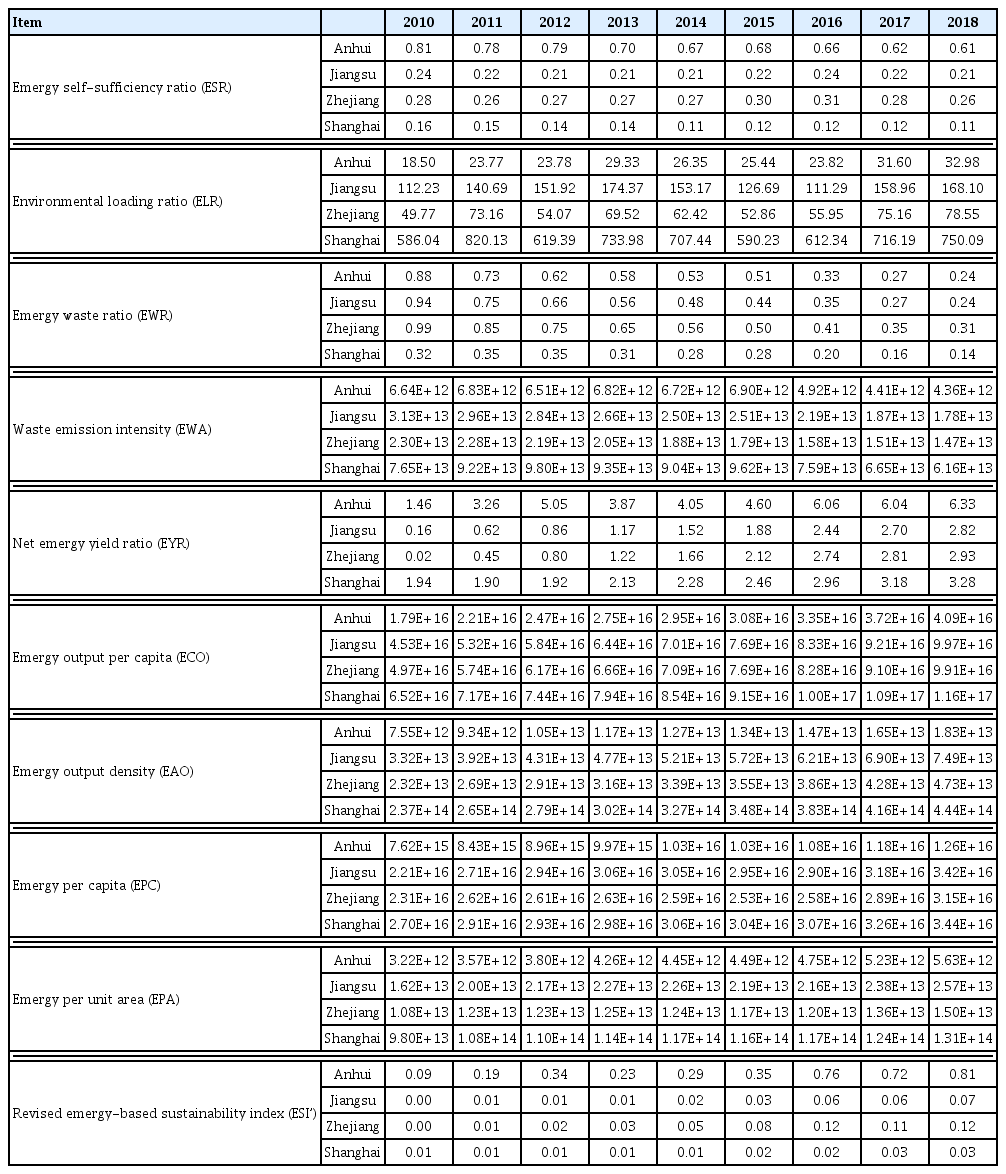
Emergy Index of the Eco-economic System in the Yangtze River Delta, 2010–2018
According to the established index system, we analyze the results reflected in Table 2 from four aspects: natural subsystem, economic subsystem, social subsystem, and sustainable development.
3.2.1. Natural subsystem evaluation index
First, although the ESR of Anhui Province decreased over the study period (from 81 to 61%), it remained far greater than that of the other locations. The intensity of natural resources development and utilization in Anhui Province was the largest, with the least external emergy introduced. Moreover, the Anhui region has low degree of foreign exchange, which indicates that the economic development of this region depends on natural resource consumption, an extensive economic development model and low degree of openness to the outside world. Shanghai had the lowest ESR, the most negligible dependence on natural resources, and the highest introduction of external emergy, reflecting its dependence on imported resources and openness. Compared with Jiangsu, Zhejiang, and Shanghai, Anhui Province is rich in natural (i.e., biological), water, and mineral resources; however, it also has a strong relationship with the division of work in the YRD. Anhui Province exports a large quantity of raw materials and energy for the economic development of Jiangsu, Zhejiang, and Shanghai, helping to fulfill the production needs of these areas. Since 2010, the ESR of Anhui Province has decreased significantly, indicating that the intensity of natural resource development and utilization has been gradually declining, and the resource utilization structure is becoming more rationalized.
Evaluation indices of the natural subsystems for YRD, 2010–2018.
Second, ELR reflects the pressure of economic activities on the environment. According to Brown and Ulgiati [40], it is considered a high load when the ELR is > 10. The ELR of all three provinces and city were > 10, particularly in Shanghai where the average ELR was 681.76. This indicates the strong dependence on non-renewable and external resources for the economic development of the YRD; thus, the eco-economic system bears enormous environmental pressure and is in a sustained state of high load. This alarming situation regarding economic development in YRD needs to be addressed to restore the eco-economic system of the region.
Finally, EWR and EWA reflect the resource utilization efficiency of the system and the impact of waste emissions on the environment. The EWR values of Zhejiang, Jiangsu, and Anhui were much higher (i.e., more waste is produced per unit GDP) than that of Shanghai. This may reflect the awareness of environmental protection via the process of industrial production in Shanghai; for example, an increase in waste recycling is observed while implementing energy conservation and emission reduction techniques. The EWA is directly proportional to the total waste emissions and inversely proportional to the regional area. The EWA of Shanghai was the highest, followed by those of Jiangsu and Zhejiang. The economic activities in these areas release a high degree of pollution to the natural environment, placing a tremendous burden on the environment. China’s government launched a series of favorable environmental policies in 2015, promoting energy conservation and reducing emissions and waste. Accordingly, EWR and EWA in the YRD region decreased remarkably in 2015.
3.2.2. Economic subsystem evaluation index
EYR reflects the relationship between a system’s emergy output and economic feedback emergy and is a critical production efficiency index. The higher the ratio, the higher the production efficiency. Since 2010, the EYR of Jiangsu, Zhejiang, and Shanghai has been steadily increasing. Anhui Province has also presented a rapid growth trend, following a decrease due to the downturn of the coal industry in 2012, and thus indicating that the overall productivity of the YRD has dramatically improved since 2010. Anhui Province maintains abundant resources, with the largest amount of stored energy and the highest energy self-sufficiency rate, contributing to its large EYR. The EYR of Jiangsu and Zhejiang was low despite their relatively high levels of output emergy; however, as the input emergy levels are also high, and since the waste discharge is considered in the calculation of this index, the high EWR of these provinces reduced their EYR.
Alternatively, from Fig. 4, we can see that in terms of the ECO and EAO, Shanghai was the highest, and Anhui the lowest, consistent with the actual situation of the YRD. High labor productivity provides favorable conditions for these regions to attract foreign investment and promote regional economic development.
Evaluation indices of the economic subsystem for YRD, 2010–2018.
3.2.3. Social subsystem evaluation index
EPC is an essential indicator of the living standard and income in a region. This metric also includes the natural environment’s free energy income and the emergy obtained by bartering with others. The EPC in the YRD region presented an overall upward trend (especially after 2016; Fig. 5). The continuous development of the economy in the YRD has been accompanied by the protection and improvement of people’s livelihood and an increase in the supply of high-quality public services. The results of the reform and development have improved the living standards and quality of life of the residents, providing residents with a greater sense of gain, happiness, and security in the integrated development; however, the EPC in Anhui Province is far lower than the other locations analyzed. Accordingly, the investment in livelihood projects should be strengthened to improve the natural environment and quality of life.
Evaluation indices of the social subsystem for YRD, 2010–2018.
EPA directly reflects the development degree and level of the regional economy. The EPA of Shanghai was the largest, indicating that the region has invested higher emergy in a smaller area, with high emergy utilization intensity and a substantial degree of economic development (Fig. 5). In contrast, the EPA of Anhui Province was the lowest, indicating that the intensity and level of economic development were low, with a slow circulation speed of the eco-economic system.
3.2.4. Sustainable development index
ESI’ is used to measure the sustainable development ability of a regional ecosystem. EWR was introduced into the revised emergy-based sustainability index to normalize ESI’ and make it more comparable. ESI’ is directly proportional to EYR and inversely proportional to ELR and EWR. The ESI’ of YRD was < 1, implying that the use of non-renewable resources in the system was large, belonging to the city consumption type [38]; the intensity of social and economic development was high; the impact of consumption on the environment was high; the pressure of regional economic development on the environment was enormous, and the economic system was in a state of unsustainable development. Overall, the ESI’ of the YRD displays a clear upward trend, indicating that the resource utilization efficiency of the YRD region is constantly improving along with rapid economic development, as is the intensity of resource recycling, with increased recycling of waste resources, implying that the evolving sustainable development ability is improving. In the process of economic development in the future, we should reduce the use of non-renewable resources and waste emissions, reduce the ELR and EWR as much as possible, and improve the level of sustainable development.

Sustainable development index for YRD, 2010–2018.
3.3. Suggestions
From the above emergy analyses, the issues of the YRD eco-economic system can be summarized as follows: primarily, the resource structure is unsustainable. With the continuous expansion of foreign trade, the high dependence of Jiangsu, Zhejiang, and Shanghai on foreign resources, especially in Shanghai, creates an emergy self-sufficiency ratio < 20% that is only decreasing with time. The utilization of renewable resources is insufficient, and the ELR is high, especially in Jiangsu (> 100). Second, the regional development is unbalanced. When assessing the economic subsystem, although the EYR of Anhui was higher with a constantly improving production efficiency, combined with the ECO and EAO, the labor efficiency and output per unit area of the province were lower than the other regions, creating a relatively backward pattern of economic development. Examining the social subsystem, the EPC and EPA were much lower than the other regions, reflecting that the living standard and resident quality of life have a significant gap compared to Jiangsu, Zhejiang, and Shanghai. Third, the relatively high output and intensity of waste discharge have a significant negative impact on the region’s environment and sustainable development ability. When combined with the analysis results, the following suggestions were put forth for the sustainable development of the eco-economic system in the YRD.
3.3.1. Increase new energy development and utilization
Overall, the energy resource structure of the YRD is dominated by input resources, and its economic development is dependent on the utilization of coal, gasoline, natural gas, and other non-renewable resources considered “resource consumption.” Thus, the YRD should increase technological investment in harnessing new energy resources; strengthen the development, construction, and application of regional advantageous renewable natural resources (e.g., solar, wind, biomass, geothermal, and hydro energy) in social production and residents’ lives; improve all renewable energy supporting facilities within the state grid and the magnitude of resource utilization; reduce the consumption of non-renewable resources, promote the sustainable development of the ecosystem.
3.3.2. Employ comparative advantages and optimize industrial structures
In the development of the YRD region, the comparative advantages of each region must be employed. Any reasonable regional planning scheme must be formulated using the relative regional role within the YRD, the regional resource base, and the present situation. It must be based on scientific analysis and systematic research to optimize the spatial industrial layout, strengthen the division of labor and cooperation, carry out dislocation development, improve regional development’s overall level and efficiency, and promote the coordinated and sustainable development of the eco-economy.
Anhui Province is in the interior hinterlands and has substantial ecological resources and robust innovation. It provides an essential supporting capacity for YRD industries; however, its economic development relies heavily on local resources. Although commodity exports have supported the economic growth of Jiangsu, Zhejiang, and Shanghai, raw materials and primary products, the most abundant in the province, maintain low added values. Accordingly, Anhui Province should take advantage of the main grain-producing areas in the north, actively develop characteristic and supporting industries such as agricultural product processing, and direct Northern Anhui towards undertaking the industrial transfer. The transformation and modernization of traditional industries should be accelerated throughout this process, increasing investment in scientific and technological innovation and eliminating backward production capacity. The full potential of existing raw material and primary product processing exports should be realized, improving export commodities’ grade and technical content and enhancing comprehensive regional competitiveness.
Jiangsu has a developed manufacturing industry, rich science and education resources, and a high degree of openness. In contrast, Zhejiang has a leading digital economy, beautiful ecology, and a developed private economy. However, the export products of these provinces are primarily industrial finished products, with low added value and spillover effects on local enterprises. Although it has historically promoted employment and regional economic development, the latter will be hindered due to the correlated high energy consumption and carbon emissions. Therefore, it is suggested that Jiangsu and Zhejiang should make use of Shanghai as a center to develop new economic forms, such as cross-border e-commerce, introduce foreign-funded enterprises with technology spillover effects on the forefront of international industrial technology, create a high-level talents team, and improve the quality, performance, and added value of technological export commodities. With a focus on the low carbon industries, the development of a green intelligent manufacturing mode should be encouraged, modernizing technology through increases in research and development, establishing a development mode of low mining, high utilization, low emissions, and high recycling, while promoting the sustainable development of the ecosystem.
3.3.3. Promote public service sharing and improve livelihoods
Through the social subsystem indicators, it was shown that the living standards and public services of Anhui Province were far below those elsewhere. While improving the YRD residents’ livelihood and quality of life, a standardized public service system should be developed by expanding the radius of public services, thus providing benefits and a more affordable lifestyle. The vulnerable groups must be acknowledged and take priority in the equalization of essential public services. The supply capacity and quality of non-basic public services should be improved, creating high-quality living spaces, thus improving the sense of gain, happiness, and security in the integrated development and promoting people’s overall development and prosperity. At present, the YRD is expanding shared public services and exploring the construction of a high-quality integrated platform for essential public services. The “YRD regional integration development planning outline” proposed to make the achievements of integration development more equitable for the benefit of all. In January 2020, the list of public services jointly built and shared within the YRD ecological and green integration development demonstration zone (the first batch) was published, covering 20 projects in eight major areas—health, medical security, education, cultural tourism, sports, pension, transportation, and government services—to enable residents to conveniently enjoy essential public services across provinces and cities, while maintaining a balanced distribution and scientific allocation of social resources.
3.3.4. Reduce waste discharge and promote joint protection of the environment
The EWR and EWA of YRD were relatively high, particularly in Jiangsu and Zhejiang, creating a substantial negative impact on the region’s environment and sustainable development ability. To address this, energy structures should be optimized, controlling the amount of coal consumption while promoting its clean and efficient use, vigorously promoting energy conservation and emissions reduction activities, improving the scientific and technological level of production processes, as well as the degree of waste recycling and resource utilization, realigning from a traditional linear economy to circular one, and creating a green and recycling industrial system. Simultaneously, it is necessary to promote the mechanisms of joint prevention and treatment of environmental pollution; strengthen the regional governance of the environment; jointly formulate industry standards for controlling high energy consumption, high emissions, as well as solid and hazardous wastes; establish a collaborative supervision system for monitoring the environment; improve regional ecological compensation mechanisms, and improve environmental quality to create an aesthetically appealing YRD.
3.4. Management Implications
Sustainable development is one critical global issue and is rapidly becoming a new strategy for regional development. Sustainability does not only refer to economic or social development, nor is it solely ecology-based; instead, it refers to the entirety of the anthropocentric eco-socioeconomic complex. Compared to previous research on sustainable development of regional eco-economies [10, 13, 14], the present study had the following advantages: (i) The emergy method was used to evaluate the input and outputs of the regional economy, as well as those of various ecological and economic resources to provide a standardized unit of measure. The contribution of ecological products and services to sustainable development, and the detrimental impacts of waste, were evaluated. The sustainable development of the eco-economic system was also assessed, providing an essential standard for the quantitative research of the regional ecosystem; (ii) Some indices, such as ECO and EAO, were added to analyze the natural, economic, and social subsystems of the greater regional eco-economic system, and comprehensively study sustainable development ability; (iii) Combining dynamic with comparative analyses, this research analyzed the developmental trends and gaps between regional eco-economic systems, offering insight into the environmental performance and sustainability of regional eco-economies.
As a result of these novel methods, the case study of the YRD here yielded the following management implications:
First, emergy analysis is a new approach to measuring regional eco-economic systems and is complementary to other evaluation tools. Its quantitative methods account for the limitation of comparing non-economic resources scientifically, further capable of assessing the eco-friendliness of the regional economic production process.
Second, the sustainable development ability of the regional economy was dependent on the emergy yield rate and closely correlated with environmental load rate and waste discharge. The system that develops the most functional relationship with inflowing emergy will dominate [41, 42]; therefore, regional economic development should align with the regional resource endowment, increasing the use of local renewable resources, reinforcing productive processes, and overcoming limitations of system organization. Further, pollution prevention and resource recovery are also conducive to realizing sustainable development [43]. Reducing waste emissions and strengthening the recycling of waste byproducts and energy in the local production process can better protect the natural environment and improve overall system performance [44], thus enhancing the sustainable development level of the regional eco-economy.
Lastly, most urban agglomerations and regional integrations have issues with industrial structure and inadequate divisions of labor. Spatial differences in environmental loading capacity, investment, and pollution control efficiency vary by different region. As a result of the multiple administrative regions, there is vicious competition among internal cities, with a lack of integrated coordination mechanisms; therefore, it will be necessary to design mixed policies to coordinate intra- and intercity resources [45] and create interregional mechanisms of coordinated development, joint prevention, and ecological protection to enhance ecosystem stability and security.
4. Conclusions
With the rapid development of regional economies, energy shortages, environmental pollution, land degradation, biodiversity reduction, and other urbanization problems are increasing in severity and placing tremendous pressure on the natural ecosystem. Accordingly, optimizing the sustainability of regional eco-economic systems is paramount for achieving global sustainable development.
Based on emergy theory, this research examined regional eco-economic systems in YRD. The following conclusions were derived: (i) Considering the direct and indirect environmental contribution of economic development in the region, the inputs to the eco-economic system were quantified at the same scale; (ii) The commonly used index system of regional ecosystem sustainable development was modified through the addition of ECO, EAO, EWA, and other indicators. EWR was introduced into the revised ESI’, thus expanding the applicability of the sustainable development index; (iii) Previous research has selected data from 2010 to 2018 to conduct dynamic and comparative analyses on the sustainable development of the eco-economic system in the YRD. Accordingly, it can reflect the recent historical path and development trends of the various regions and intuitively understand regional differences in resource composition and sustainable development ability, which can help in identifying issues as well as formulate scientific and sustainable development policies.
Some limitations in the research should be acknowledged: In different periods of socioeconomic development across regions, the integration, classification, and statistical caliber of the data have varied, possibly creating a slight deviation between emergy calculation results and actual values. In constructing the index system, some emergy values, such as science and technology, talent, information, education, and culture, could not be reflected due to limited data availability. The emergy index system requires further improvement. The various regions study herein adopted a single emergy conversion rate. However, they exhibit different ecosystem types, development levels, and production processes, thus introducing a certain degree of error.
Additionally, this research only analyzed the differences among the three provinces and one city in the YRD. It did not account for the correlation between regional ecosystems. That said, the above-mentioned results can help direct future research.
Supplementary Information
Acknowledgments
This research is supported by a key project of Anhui philosophy and social science planning (no. AHSKXZX2020D13).
Notes
Conflict-of-Interest
The authors declare that they have no known competing financial interests or personal relationships that could have appeared to influence the work reported in this paper.
Author Contributions
C.W. (Ph.D.) analyzed and interpreted all the data and wrote the manuscript. F.L. (Lecturer) collected all the data and wrote the manuscript. Y.W. (Ph.D.) revised the manuscript. All authors read and approved the final manuscript.