The synthesis of polyhydroxyalkanoates from low carbon wastewater under anaerobic-microaerobic process: effects of pH and nitrogen and phosphorus limitation
Article information

Abstract
Polyhydroxyalkanoate (PHA) is a new type of bio-polyester which is expected to replace traditional petroleum-based plastics. The experiment was carried out based on anaerobic-microaerobic process. Firstly, the PHA accumulation capacity of activated sludge under different pH conditions was discussed, and then the batch test of nitrogen and phosphorus limitation was carried out under the condition of optimal pH. Moreover, the content of PHA monomer under nutrient restriction was also studied. The experimental results showed that when pH was not controlled (7.5~8.5), C:N and C:P weight ratio was equal to 150, the maximum content of PHA accounted for 50.39% and 36.07% of the dry cell weight, respectively. Besides, it was found that increasing the C:N weight ratio was beneficial to increasing the proportion of polyhydroxyvalerate (PHV) monomer in PHA.
1. Introduction
The accumulation rate of waste generated in the world is catching up with urbanization, of which plastic accounts for 10%, predicted to reach 2.2 billion tons annually by 2025 [1]. Microplastics pollution at sea has become an increasingly serious problem. It is expected that the accumulation of plastics will reach 1.552 billion tons by 2060 [2].
Polyhydroxyalkanoate is a biodegradable biopolyester accumulated by various microorganisms under unbalanced growth conditions [3]. Due to its unique biodegradability and renewability, it can effectively alleviate the environmental problems caused by traditional plastics (polypropylene and low density polyethylene) [4]. Therefore, the production and application of PHA have attracted much attention. At present, the most common technology for industrial production of PHA is mainly to use natural pure strains to ferment and cultivate [5]. However, studies have pointed out that the operating cost of the PHA production process with pure culture is 5~10 times that of traditional petroleum-based plastics [6]. It has primarily hindered the widespread application of PHA in the market. Compared with the pure culture method, the use of MMC will reduce the cost, because a simple control process is needed, it can easily adapt to the change of carbon source [7]. Relevant studies show that the volatile fatty acids (VFAs) produced by the fermentation of excess sludge can be used as a good carbon source for the production of PHA by mixed strains [6]. Studies have realized efficient PHA production in the sludge fermentation broth mainly containing valerate by using the MMC method [8]. However, it is more challenging to simultaneously recover and synthesize PHA in the process of nitrogen and phosphorus removal in low carbon areas. Studies have shown that low-carbon wastewater will also have a certain limitation on nitrogen and phosphorus removal [9]. In order to alleviate the competitive relationship of carbon sources in the process of sewage treatment in low-carbon areas, Li et al. [10] and Fang et al. [11] have found that the high concentration of polyhydroxybutyrate (PHB) accumulated by microorganisms can effectively alleviate the competition contradiction of carbon sources. On this basis, Huang et al. [12] studied the use of actual solid waste fermentation broth as an external carbon source and used the activated sludge mixed flora to synthesize PHA under microoxygen conditions. Most of the researches on the PHA synthesis process domestically and abroad are focused on the anaerobic-aerobic [13], complete aerobic process [14], and microaerobic process [15, 16]. There is almost no research on the synthesis of PHA under the condition of microaerobic process. Besides, the metabolic process of PHA is usually closely related to parameter changes, for instance, the nutrient ratio (C:P weight ratios, C:N weight ratios) required for microbial growth and pH value. At present, scholars have different regulations on the optimal pH value of PHA synthesis. Most studies believe that the neutral, alkaline environment is most suitable for activated sludge accumulation of PHA. It was found that in the range of pH greater than or equal to 7, the accumulation efficiency of PHA was significantly higher than that of acidic conditions. When the pH value is 8.8~9.2, PHA has the best all-around production performance [17]. The studies found that the pH of 8 or 9 was an appropriate environment for PHA accumulation [18], and the yield of PHA was the highest when pH was 7.5~8.5 [19]. It was found that the content of PHA synthesized by activated sludge reached the maximum when the pH value in the reaction process was not controlled [20]. In addition to the influence factor of pH, nutrient sources (mainly phosphorus (P) and nitrogen (N)) are also crucial parameters during the synthesis process [21]. It was found that when the concentration of nitrogen and phosphorus was limited, the metabolism of PHA was extensively promoted. And in most studies, it was found that the effect of nitrogen limitation on the overall performance of PHA synthesis from activated sludge was greater than that of phosphorus limitation. Under variable nutrients concentration (pH ranging 8.8 to 9.2), the C:N:P ratios are 100:4.1:2.4(N-limited experiment); 100:8.8:1.3(P-limited experiment), the results indicate that the PHA content in the enriched biomass is higher under nitrogen limitation than phosphorus limitation (51 and 42%, respectively) [17]. Similar to the results, when C: N was 125, the maximum accumulation of PHA was as high as 59% of the dry weight of PHA cells; after 2.5 h of aeration, when the weight ratio of influent C:P is 750, the maximum percentage of PHA accumulation is 37% [22]. However, some related studies have found that limiting phosphorus is more conducive to accumulating PHA in activated sludge than limiting nitrogen. Based on the best values obtained in the previous work, the test evaluates the ability of activated sludge to synthesize PHA under P restriction by adjusting the OLR and N concentrations, it obtained higher PHA content for P-limitation than for N-limitation conditions (54 and 42%, respectively) [23]. The maximum accumulation of PHA could reach 51% of dry weight under the conditions of limited oxygen and nutrient elements and restricted phosphorus source [21]. In addition, a few studies found that limiting nitrogen and phosphorus concentration had different effects on PHA monomer content. The proportion of PHB/PHA has reached 0.99 when the C:P weight ratio is increased to 750. It shows that the limitation of nitrogen and phosphorus, especially under the limitation of phosphorus, the polyhydroxybutyrate produced by activated sludge is more than polyhydroxyvalerate [22].
There are few studies on the regulation of process parameters (pH value and nitrogen and phosphorus limit) with low-carbon wastewater as the research object of PHA production. The purpose of this study is to find the most favorable conditions for PHA production and improve the ability of low-carbon wastewater to synthesize PHA under anaerobic-microaerobic process. This study is expected to provide valuable theoretical and application guidance for the integration of renewable resource recovery in wastewater treatment into plastic circular economy.
2. Materials and Methods
2.1. Experimental Device
In this study, a cylindrical sequencing batch reactor (SBR) made of two kinds of plexiglass was used, with a total volume of 10 L and an actual volume of 7.5 L. Two peristaltic pumps (BT100M/YZ1515X, single channel pump, flow of 380 mL/min) are used for water inlet and drainage of the system. In order to ensure uniform reaction and mixing of substrate and activated sludge, a stirring paddle is set at the top of SBR, a sampling port is set at the outer wall and a sludge discharge port is set at the bottom. Online detection devices (WTW340i, Germany) for pH and dissolved oxygen (DO) are provided for monitoring at the same time. The reactors were operated at room temperature (25±2°C, set by Guangzhou indoor air conditioner), and the timer controls (KERDE, TW-268, Hangzhou) the reaction time. The experimental systems were operated in an anaerobic-microaerobic cycle. Each cycle consists of the following phases: influent feeding for 10 min, anaerobic reaction for 2 h, microaerobic reaction for 3 h, sedimentation for 25 min, drainage for 5 min, and the rest is static. Three cycles are operated every day.
2.2. Experimental Sludge
The SBR reactor was inoculated using activated sludge from a municipal wastewater treatment plant (Lijiao, Guangzhou, China). The process of water plant is an improved anoxic oxic (A/O). The service objects of the sewage treatment plant are some areas of Guangzhou, and the removal rates of various indicators are high. Specific indicators are as follows: Influent biochemical oxygen demand for 5 d (BOD5) is less than 200 mg/L, ammonia Nitrogen (NH4+-N) is less than 25; total phosphorus (TP) is less than 4 mg/L, and the effluent quality is stable and better than the discharge standard. The water content of the dry sludge was around 99.3%. The inoculated sludge is dark grayish brown flocculent with loose structure and general sedimentation performance. The essential characteristics of sludge are as follows: mixed liquid suspended solids (MLSS) = 12,829 mg/L, sludge settling velocity (SV) = 97%, sludge volume index (SVI) = 756 mL/g and pH = 7.56.
2.3. Experimental Water
Synthetic wastewater was used as the influent, the composition of the synthetic medium used was as follows: CH3COOH as carbon source, NH4Cl as nitrogen source, KH2PO4 as phosphorus source. The trace elements solution was of the following composition (per liter): 0.12g MgSO4·7H2O, 0.05g FeSO4·7H2O, 0.03g CaCl2, 0.12g MnCl4·7H2O, 0.1g KI (All chemicals are analytical pure, from Damao Chemical Reagent Factory, Tianjin, China). The pH value of water distribution was kept at about 7 by using a phosphate buffer solution (the mixing stock solutions of 0.1M KH2PO4 and 0.1M K2HPO4) [4].
2.4. Experimental Design
2.4.1. Start-up stage
In this stage, SBR was initially started with an anaerobic-microaerobic process. With the increase of domestication days, the system showed good phosphorus removal effect and certain PHA synthesis ability. Due to the low carbon source in urban sewage in this area, the influent COD starts from 200 mg/L and increases at the speed of 100 mg/L·d until the maximum COD concentration of influent is 1,000 mg/L. The influent was prepared according to the previous discussion (CH3COOH as carbon source, NH4Cl as nitrogen source, KH2PO4 as phosphorus source). The weight ratio of C:N:P in the domestication section is required for 100:6:2. Water samples and sludge samples were collected after the system was running for three, eight and eleven days. Throughout the SBR operation, the concentration of COD, released phosphate (TP) and PHA content were determined.
2.4.2. Effect of pH value on the synthesis of PHA
To evaluate the capacity of activated sludge to synthesize PHA under anaerobic-microaerobic process, batch experiments were carried out under different pH conditions: 5.0, 6.0, 7.0, and and no control ( When sodium acetate is used as carbon source, the pH value of the system ranges from 7.5 to 8.5 without adding any acid and alkali). In batch experiments under different pH values, 10% dilute sulfuric acid, and 10% sodium hydroxide solutions were used as pH adjustment solutions, and the pH was strictly controlled within the preset value of 0.2. The MLSS in the reactor was controlled at 4,500~5,000 mg/L(differ from the the previous concentration of sludges from the initial inoculation), and the rotameter adjusted the DO, in the reactor to maintain the DO value below 2 mg/L under microaerobic condition.
2.4.3. Effect of C:N and C:P weight ratios on PHA synthesis by activated sludge
Two groups of nutrient ratio restriction tests with different nitrogen and phosphorus concentrations were designed to evaluate activated sludge’s PHA synthesis capacity under these two other nutrient conditions. As in the previous experiments, the DO of the microaerobic stage was maintained below 2 mg/L. First of all, a P-limiting investigation was carried out in a one #SBR reactor. The influent COD was increased to 1,500 mg/L, other nutrient ratios except phosphorus were kept unchanged, and the influent carbon-nitrogen balance was maintained at 20:1. The synthesis capacity of PHA was investigated when the C:P weight ratios was 100, 150, 200, 250, and 500. The N-limiting experiment was carried out in a two # SBR reactor similar to phosphorus limitation. The PHA synthesis was investigated when the C:N weight ratios was 20, 60, 100, 120, and 150.
Besides, the effects on PHA monomer content(%) under two conditions of phosphorus and nitrogen limitation were investigated. Therefore, we can synthesis PHA according to the actual production requirements by regulating the monomer.

The Experimental Design Condition in This Study
2.5. Analytical Methods
Routine analysis of the water samples were carried out following the standards specified in “Water and Wastewater Monitoring and Analysis method (Fourth Edition)” issued by the National Environmental Protection Agency. The analysis items include COD, TP, DO, pH, MLSS, VSS, SV%. DO, pH were detected by online monitoring of wtw340i instrument in Germany. SV was detected by 100-mL cylinder method.
Cell dry weight (CDW) was determined as the concentration of volatile suspended solids (VSS) according to Standard Methods (APHA, 1995) [24]. MLSS or phosphate and COD analyses were performed according to the Chinese SEPAC Standard Methods (SEPAC, 1997) [25]. The PHA content was measured by a gas chromatograph 7980A-5975C (Agilent, USA), which equipped with a flame ionization detector and a DB-1MS capillary column (30 m × 0.25 mm I.D. × 0.25 μm film) [26]. The heating program: after holding at 100°C for 2 min, the temperature was raised to 160°C at the speed of 15°C/min for 2 min, and the mass scanning range of MS was 20~550 da. The specific operation method is as follows: put the appropriate amount of sludge powder after centrifugation and freeze-drying into the heat-resistant tube, add 2 mL chloroform, 2 mL acidified methanol solution with a volume fraction of 10%, and 2 mL methanol benzoate solution in turn. After sealing, water bath at 100°C for four hours, cool to room temperature, add 2 mL demonized water, shake for 10 min, and then stand for stratification. The lower organic phase was filtered with 0.45 μm filter membranes and added into the injection bottle for chromatographic analysis. Finally, the standard internal method was used to calculate the content of PHA. Analyze the monomer components and content in the sample to be tested with the standard sample of PHA (8% PHV, 92% PHB). The content to be measured is quantified by drawing a standard curve. The specific steps are as follows: the mass of PHB and PHV in the normal sample of PHA under different mass gradients was taken as the Y-axis, and the ratio of PHB peak area and PHV peak area to benzoic acid peak area was taken as X-axis to draw the standard curves of PHB and PHV respectively. Substitute the peak area and mass of the sample to be measured into your formula, the contents of PHA and PHA can be calculated respectively. To avoid the error caused by the test operation, each sample is detected twice by GC-MS to improve test data accuracy.
2.6. Calculations
The relevant calculation for the determination of PHA included in this test is shown in the following formula.
The meaning of each formula is as follows: (1) the PHA accumulation content; (2) the substrate consumption; (3) PHA produced; (4) PHA yield; (5) response time; (6) PHA production rate; (7) substrate consumption rate. Among them, t1 and t0 are the time and initial time to reach the maximum concentration of PHA; S1 and S0 (Cmmol/L) represent the substrate concentrations at the maximum synthesis and the beginning, respectively; PHA1 and PHA0 (Cmmol/L) are the PHA concentrations at the maximum and the beginning, respectively.
3. Results and Discussion
3.1. Initial Acclimation of Sludge
Started the SBR reactor under an anaerobic-microaerobic condition. The variation of phosphate concentration and PHA content in one cycle was shown in Fig. 1.
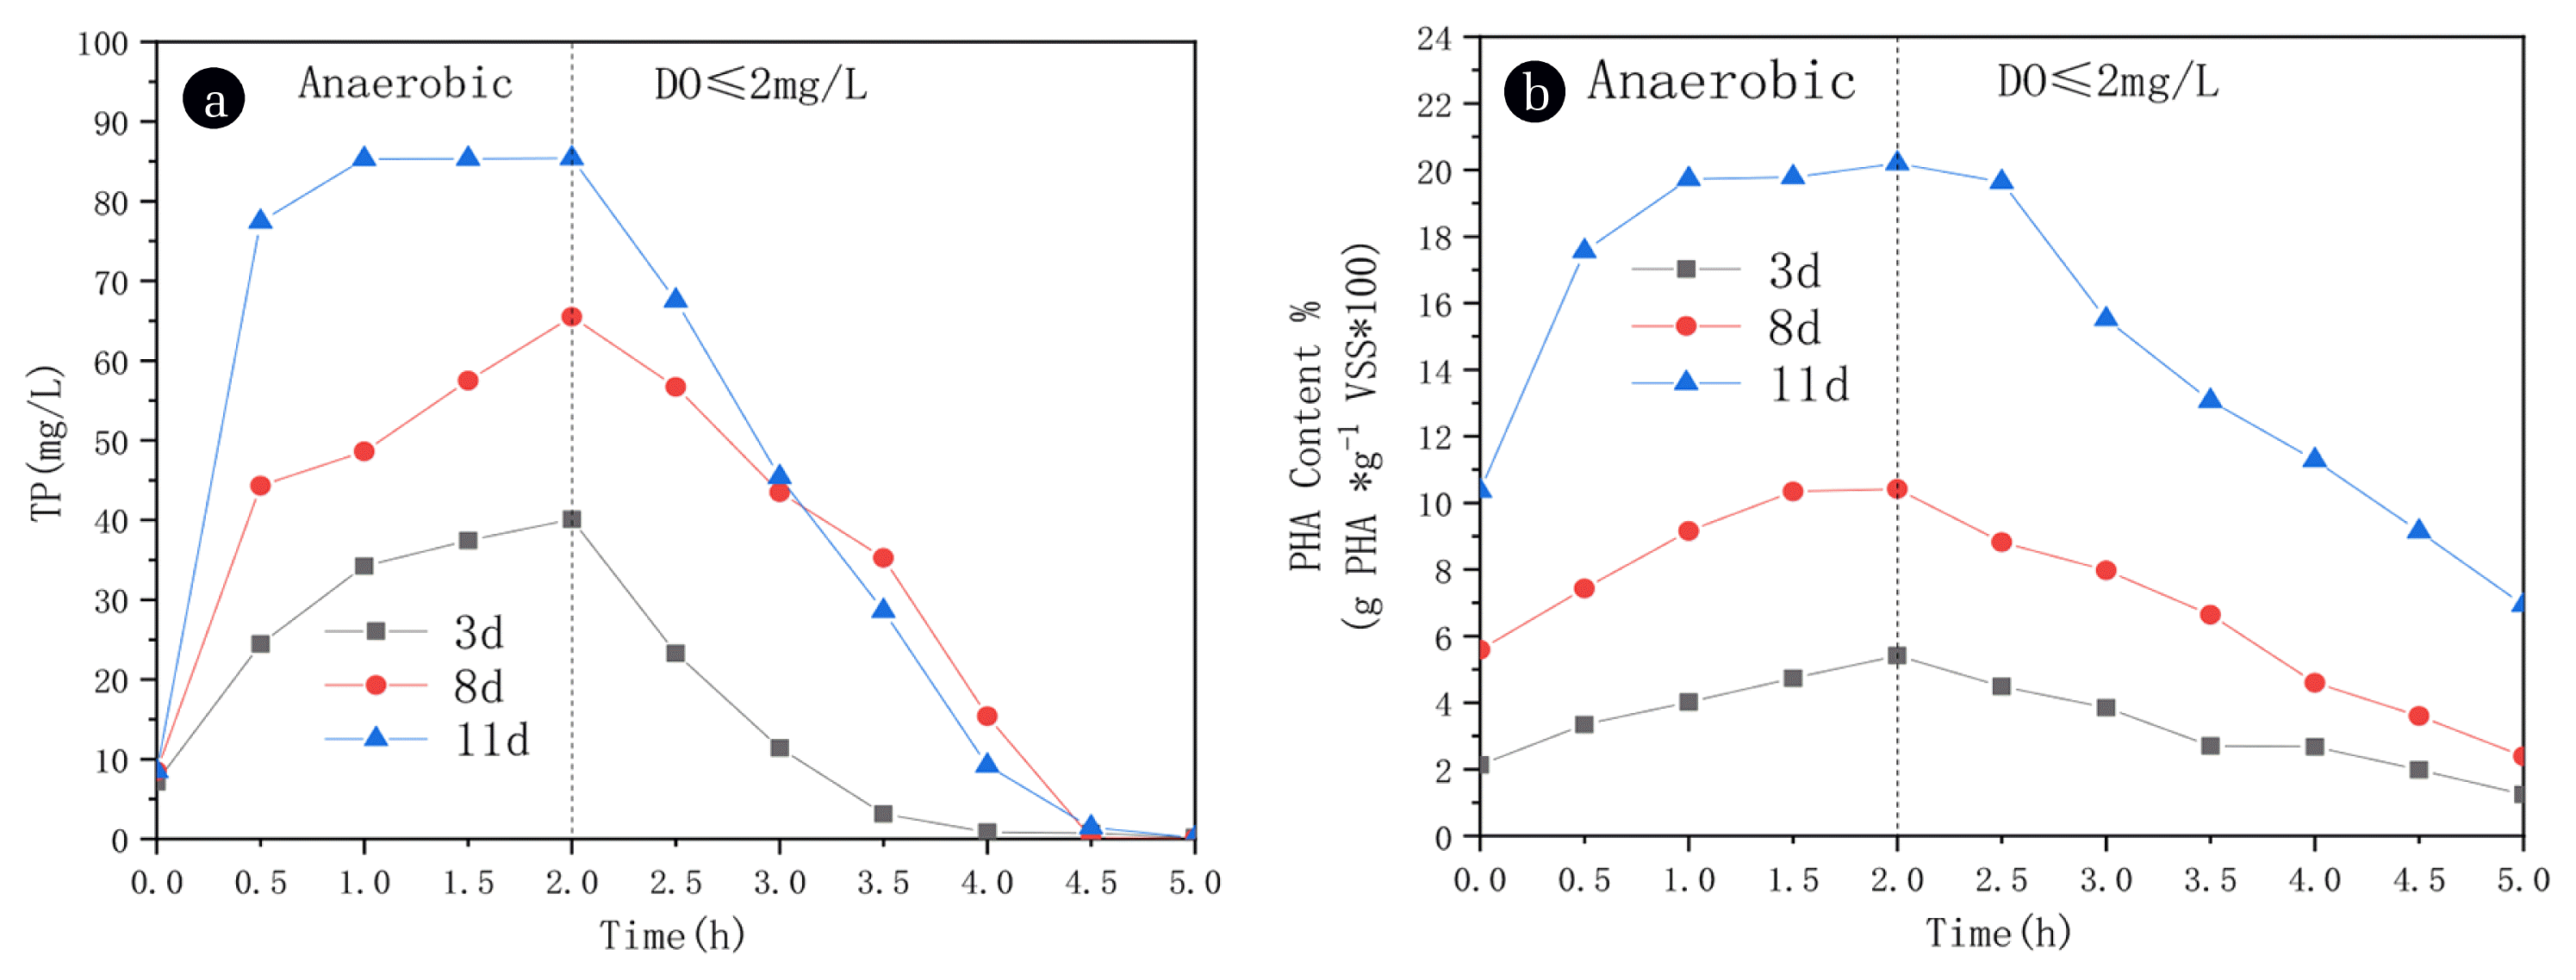
Changes in the concentration of phosphate (a) and PHA content (b) under different acclimation days. (The meaning of “Time” in the figure is as follows: a one operation cycle, consists of anaerobic 2-h and micro aerobic 3-h).
The inoculated sludge gradually turns from dark grayish brown to yellowish brown, the structure is gradually compact, and the sedimentation performance is getting better and better. It can be seen from Fig. 1(a) that with the increase of domestication days, the phosphorus release amount in the anaerobic stage showed a continuous upward trend. The concentration of phosphate in water increased from 8.5 to 77.45 mg/L in the first half-hour of anaerobic treatment, and the total amount of TP released at the end of the anaerobic process reached the maximum (85.4 mg/L). In the microaerobic condition (DO: 2±0.1 mg/L), microorganisms oxidize a small amount of organic matter for self synthesis and cell metabolism. Instead, it will accumulate a large amount of PHA in cells. The initial researchers found the phenomenon of mixed bacteria synthesizing PHA in the process of phosphorus removal in wastewater treatment [27]. Phosphate accumulating organisms (PAOs), glycogen-accumulating organisms (GAOs) and filamentous bacteria are most common bacteria with PHA accumulation ability in activated sludge [28]. Based on the principle of enhanced biological phosphorus removal from wastewater, under anaerobic condition [29], the polyphosphate accumulating bacteria can rapidly decompose the phosphorus accumulating in the cells, release a large amount of phosphate, and the concentration of phosphorus in the reactor rises quickly; in the aerobic stage, the polyphosphate accumulating bacteria take molecular oxygen as electron acceptor and absorb excessive phosphorus from water to form polyphosphate. It can be observed in Fig. 1(b) that the variation of PHA content in activated sludge is highly correlated with the phosphorus release and absorption curve. With the increase of working days, the system’s phosphorus removal effect is better, and PHA synthesis also increases. Smolders et al reported the metabolic model of PAOs in activated sludge, in the anaerobic stage, PAOs actively transports and absorbs acetate and converts it into PHB by using ATP and reducing force produced by intracellular polyphosphate release and a small amount of glycogen degradation [30]. In the microaerobic stage, PAOs absorb excessive phosphate from wastewater as energy storage and use free oxygen as an electron acceptor to oxidize the internal carbon source stored under anaerobic conditions. Therefore, PHA was slowly consumed. After 11 days, PHA content synthesized by activated sludge reached 20.19% of dry sludge weight (Fig. 1(b)). This shows that activated sludge has a high activity after anaerobic microaerobic operation. When the influent containing carbon source and nutrient solution enters the system, it can quickly absorb external carbon source and decompose phosphorus accumulation in cells, effectively remove phosphorus and complete a certain amount of PHA synthesis.
In conclusion, after 11 days of stable operation, the system can recover and synthesize a certain PHA amount while effectively removing phosphorus.
3.2. Influence of pH on the Accumulation and Synthesis of PHA
After the above 11 days of anaerobic-microaeroibic process, PHA content was measured at the end of the anaerobic period to account for 20.19% of the sludge’s dry weight. Batch experiments were conducted varying pH conditions At 7, 6, 5 and at free pH (ranging from 7.5 to 8.5) and the results are shown in Fig. 2.

Changes in the concentration of COD (a) and PHA content (b) under different pH values.
As can be seen from Fig. 2(a), when entering the microaerobic stage, the substrate is consumed rapidly. At this point, the COD degradation curve shows a clear downward trend, the microorganism is in a highly active state, as same high the substrate’s utilization efficiency is. After the microaerobic of 1h, the PHA content reached the highest value (Fig. 2(b)), accounting for 28.22% of the sludge’s dry weight. Both the synthesis of PHA and the degradation of COD are affected when pH is checked. As shown in Fig. 2(a), the residual part of COD in the microaerobic end-stage system is not degraded, which directly affects PHA synthesis. It can be seen that the content of PHA has also been reduced (Fig. 2b), and at the time of anaerobic 1.5 h reached the highest value, accounting for 28.17% of the dry weight of sludge, under the condition of pH-6, the utilization rate of the system substrate is significantly inhibited, PHA synthesis has become irregular. Under the condition of pH-5, COD is hardly degraded (Fig. 2(a)), the amount of PHA is decreasing (Fig. 2(b)), and the system has gradually lost the synthesis ability of PHA.
The synthesis of PHA at different pH values is analyzed dynamically, and the results are shown in Table 2.

Kinetic Parameters of PHA Production under Different pH
The main kinetic and stoichiometric parameters of PHA formation are shown in Table 2. Under the condition of nitrogen limitation, when pH is not controlled, it is the most favorable for the total production of PHA. Considering the accumulation of PHA in this stage, it reached the highest value under several conditions, accounting for 28.22% of the cell dry weight. The substrate consumption rates of this stage also got the maximum value, which was 8.68 Cmmol/L·h, which indicated that microorganisms were absorbing the carbon source to synthesize PHA. Besides, the PHA productivity rPHA reached 5.96 Cmmol PHA/L/h, and YPHA/S were also high, going 0.69 Cmmol PHA Cmmol/S. Under the condition of phosphorus limitation, when the pH was not controlled, the substrate consumption rate was the highest (rS = 18.06 Cmmol S/L/h), the production rate of PHA was the highest (rPHA = 20.46 Cmmol PHA/L/h), the maximum accumulation of PHA was 25.81% of the cell dry weight, and the storage capacity of PHA was 1.13 Cmmol PHA Cmmol/S, which indicated that carbon source was being used for the accumulation of PHA. The results also showed that the formation and substrate conversion of PHA was inhibited in the acidic pH range of less than 7. The higher production performance of PHA could be obtained with no uncontrol pH(7.5~8.5). Consistent with the previous report of Montiel et al. [17], the substrate’s polymer yield is higher than different pH values (0.33 Cmmol PHA/Cmmol S) at pH 8.8~9.2, indicating that carbon source is being used for PHA accumulation.
The above experimental results show that pH value regulates the synthesis of PHA by affecting the metabolic process of mixed flora. Combined with the analysis of kinetic results, this may be due to the following reasons:
The effect of pH on enzyme activity is the main reason for decreasing PHA synthesis ability at low pH. As the water was developed with sodium acetate as a carbon source, it was weakly alkaline. The strain of PHA synthesis in activated sludge adapted to this condition had better adaptability to alkaline conditions. When the pH was adjusted to be acidic, the enzyme activity might be affected. The enzyme is the fundamental factor of a biochemical reaction. There are a lot of amino acid side chain groups in its molecule. The action of the enzyme is mainly through the dissociation of these side-chain groups. With different pH, the dissociation state of these side-chain groups will be other. The proportion of specific ionic groups with catalytic activity in the total amount of enzyme will be different, result in the different enzyme’s catalytic ability.
The electronegativity of bacteria changed. The lower pH has reached the electric point of some bacteria, and the surface charge of bacteria has changed from negative to positive. The extracellular secretions and active substances adsorbed on the surface of bacteria dissociate into the solution, leading to the unstable COD change. Chua et al. [18] reported that PHA accumulation was the lowest when pH values were 4.0, 5.5, and 6.5. This phenomenon can be explained as follows: under low pH value, acetate is still in the form of undistributed, and this undivided acetic acid will rapidly diffuse into bacterial cells, and then it dissociates and exerts an intracellular proton load, thus reducing the intracellular pH value. This decrease in internal pH may result in a reduction of PHA production.
3.3. Influence of Nutrient Ratio on PHA Synthesis by Activated Sludge
The C:N and C:P weigh ratios are significant factors affecting PHA content synthesized by activated sludge. Under the condition of limiting nutrient ratio, the content of PHA synthesized by microorganisms is higher. In this section, pH = 7.5 is controlled under anaerobic microaerobic process because previous results (Section 3.2) have shown that weak alkaline conditions without pH control under this process are most conducive to PHA production. The second group of tests was conducted by gradually reducing nitrogen and phosphorus concentration in the influent water. Variation of PHA content in a running cycle is shown in Fig. 3.

(a) Changes of PHA content under different C:P weight ratios; (b) Changes of PHA content under different C:N weight ratios.
In the process of limiting phosphorus source (Fig. 3(a)), the content of PHA showed a rising trend in the anaerobic stage but gradually decreased in the microaerobic stage. Since in the anaerobic phase, microorganisms use the energy released from polyphosphate esters to absorb organic substrates (VFAs) and store them in the internal carbon source (PHA). The microaerobic section consumes the inner storage material PHA when the external carbon source is insufficient, so the synthesis trend is shown in the Fig. 3(a). It can be seen from Fig. 3(a) that when the C:P ratio increases from the initial 100 to 150, the PHA content presents a significant upward trend and reaches the highest value at the end of anaerobic treatment, at this time, the content accounts for 36.07% of the dry sludge weight; if the C:P ratio continues to increase, the content of PHA is gradually decreased. Compared with the domesticated sludge, the color gradually changed from dark grayish brown to yellowish brown, and then to light yellow, the structure gradually changed from loose to tight, and then to loose, and the sedimentation performance gradually became worse. This is because microorganisms are in the condition of long-term nutritional imbalance, and their own growth is greatly limited. Therefore, the overall biomass of the system will gradually lose, so that it will eventually lead to serious inactivation of the system. Besides, it shows that the content of PHA did not fall immediately at the initial stage of oxygen limitation but continued to increase. The following analysis is made on this situation. Due to the continuous reduction of phosphorus source in the system, the absorption and utilization of carbon source by activated sludge are hindered, and part of carbon source will remain at the end of the anaerobic process. Microorganisms make extensive use of organic matter, which can accumulate intracellular storage material PHA and synthesize polyphosphate ester and glycogen and other energy storage materials at the same time. Therefore, a large amount of oxygen needs to be consumed. At the initial stage of oxygen limitation, the reactor’s actual dissolved oxygen concentration is always deficient, which is actually in micro oxygen or low oxygen state. Studies have demonstrated that the micro oxygen state is more beneficial to PHA accumulation [31]. Therefore, microorganisms use some of the capacity provided by dissolved oxygen to convert the residual organic matter into PHA, resulting in the phenomenon of PHA synthesis after the start of the microaerobic stage. The results showed that limiting phosphorus concentration significantly affected PHA accumulation by activated sludge mixed bacteria. However, excessive phosphorus limitation will lead to the deterioration of sludge settling performance, increased flocculent sludge viscosity, and decreased synthesis. With the increase of the limiting ratio, the extracellular substances with high water content were secreted by the microbial micelles, which caused the non-filamentous sludge bulking to hinder the further improvement of PHA synthesis [32]. Similar to the phosphorus limit test, the content of PHA synthesized by activated sludge keeps increasing when the C:N ratio increases from 20 to 150 (Fig. 3(b)). When the C: N ratio increased from 20 to 150, PHA reached the maximum at 0.5 h of oxygen limitation, which accounted for 50.39% of the cell dry weight. It have shown that under the condition of low nutrient concentration, microorganisms will be stimulated to enter the metabolic pathway of PHA accumulation rather than their biomass growth [23]. Under the condition of limited nutrients, the biosynthesis process of cellular materials is also inhibited to a certain extent, and Acetyl CoA, the intermediate product of metabolism, is transformed from the material needed to flow to the TCA cycle to form synthetic bacteria into the PHA synthesis pathway. The experimental results are similar to those obtained by [22], which indicates that excessive limitation of nitrogen concentration will lead to the proliferation of filamentous bacteria, resulting in poor sludge settleability and sludge bulking, thus reducing the PHA content. The results showed that no matter which nutrient concentration was limited, the PHA synthesis capacity of activated sludge was more substantial than that of the initial acclimation stage, which helped improve the synthesis capacity of PHA.
Besides, combined with this paper’s study, it was found that the maximum synthesis of PHA under nitrogen limitation (50.39%) was higher than that under phosphorus limitation (36.07%), indicating that nitrogen limitation was more conducive to the accumulation of PHA than phosphorus limitation. Similar results were obtained by Montiel et al. [17] and Wen et al. [22] higher PHA content was obtained under N restriction than p restriction (51, 42, 59 and 37%, respectively). However, excessive nitrogen and phosphorus limitation will result in sludge bulking. It is an important problem to control sludge bulking while PHA production is high.
3.4. Influence of N-limitation and P-limitation on PHA Monomer
Hydroxybutyrate (HB) and hydroxyvalerate (HV) are two most common HA monomer types in MMC-PHA productionain [33]. According to the monomer structure or content, the properties can vary from hard to soft to elastic. For example, PHB is a homopolymer with poor mechanical properties, easy pyrolysis, poor solvent resistance, and high crystallinity, which makes the material hard and brittle, which is not conducive to processing and production, and limits its commercial application; In contrast, the homopolymer PHV has good physical flexibility and can be widely used as a good processing material. To adjust and control PHA with different performance to meet additional production requirements, the monomer composition of PHA reached the maximum synthesis under five different nutrient ratios (C:N ratio of 20, 60, 100, 120, 150; C:P ratio of 100, 150, 200, 250, 500) was further analyzed, and the influence of different nutrient ratio on the monomer composition of PHA was evaluated. The results are shown in Fig. 4.

(a) Changes in the proportion of PHA monomer under different C:P weight ratios, and (b) different C:N weight ratios.
Fig. 4 compares and analyzes the proportion of PHB and PHV under the limitation of two nutrient sources. With the decrease of phosphorus concentration (Fig. 4(a)), the content of PHB and PHV showed no obvious change rule when the synthesis of PHA was the highest. Since the composition of PHA is mainly determined by the type of substrate, acetic acid is used as a carbon source in the experiment, which leads to PHB is the main product of PHA synthesized by activated sludge. When the C:P ratio was 100, PHB accounted for 67.86% (Fig. 4(a)). When the C:P ratio was 150, 200, 250 and 500, the proportion of PHB/PHA was 66.01, 66.49, 66.70 and 66.19%, respectively. The ratio of PHV/PHA was 32.14, 33.99, 33.51, 33.3 and 33.81%, respectively. Under the condition of nitrogen limitation (Fig. 4(b)), it can be seen from the figure that the decrease of nitrogen concentration has an observable promoting effect on the accumulation of PHV when the C:N ratio increases from 20 to 150, the proportion of PHV/PHA is continually increasing, from 33.79% to 49.14%. However, the proportion of PHB/PHA decreased gradually with the C:N ratio increase. When the C:N ratio was 20, 60, 100, 120 and 150, the proportion of PHB/PHA was 66.21, 65.42, 60.59, 53.81 and 50.86%, respectively. The results showed that PHB was the principal monomer for cell synthesis, no matter the nitrogen or phosphorus limitation. Increasing the C:N ratio is beneficial to increase the proportion of PHV in PHA, but with the increase of the C:P ratio, the change of PHB and PHV is not apparent. Therefore, the results provided the possibility of regulating the monomer composition of PHA product by regulating regulating the monomer composition of PHA in the future.
4. Conclusions
Started the reactor with an anaerobic-microaerobic condition. A considerable PHA production was achieved by adjusting the pH and nitrogen and phosphorus concentration in operation. The maximum PHA content (50.39%) is obtained when no pH control (7.5~8.5) and the weight ratio of C:N is 150. This study provides valuable operation conditions for the synthesis of PHA from low-carbon wastewater.
Acknowledgments
This work was supported by the Natural Science Foundation of Guangdong Province(Grant no. 2017A030313273).
Notes
Authors Contributions
K.Z. (Master student) conducted the experiment and finished this manuscript. Q.F. (Professor) designed the whole experiment and provided laboratory equipment. Y.X. (Master student) participated across the entire investigation. T.W. (Master student), Y.C. (Master student) and Y.X. (Master student) assist in completing data measurement.