Environmental resilience and sustainability through green technologies: A case evidence from rural coastal India
Article information

Abstract
Rural coastal regions in developing countries are generally neglected with respect to environmental issues. The present study examined the feasibility of green technologies such as rainwater harvesting (RWH), sand filtration (SF), and composting (in-vessel and pit) to recover from the environmental issues in the coastal rural regions using survey and geographic information systems considering a rural Indian case study. According to the results, RWH yielded 0.140 million litres per 100 m2 rooftop in the area, while a maximum total dissolved solids removal of 52% was achieved using the SF alleviating the water concerns. Meanwhile, with a solid waste generation of 0.207 kg d−1 capita−1 comprising 79.81% organic fraction, composting becomes the best waste resource recovery option in the area. Pilot-scale studies of composting transformed organic wastes into compost manure rich in nutrients improving the soil quality. Further analysis using a multi-criteria decision-making approach revealed that the public interest in applying these technologies depends on investment costs, additional resources requirements, and governmental policies. With the scope of improved lifestyle and quality, the study proposes more future research over green technologies and their implementation and is also directed towards developing decentralized site-specific rural governmental policies to achieve sustainability goals.
1. Introduction
Rapid utilization of natural resources leads to the deterioration in groundwater quality and availability, stressed ecology, and a surge in seawater intrusion in coastal areas [1]. As an outcome, a high amount of total dissolved solids (TDS), total hardness, calcium, magnesium, sodium, potassium, bicarbonates, sulfates, and chlorides are present in groundwater based on coastal areas [2], resulting in Alzheimer’s disease, cancer, cardiovascular diseases, diabetes, kidney stones, and affects reproductive health when consumed on a regular basis [3]. It is a huge concern since about 600 million people (10% of the world’s population) residing in coastal areas (within less than 10 m) are directly affected [4], with shortage of clean drinking water.
Rainwater Harvesting (RWH) is the most appropriate technique for artificially recharging the coastal aquifers [5], diluting the specified dissolved solids [6]. Meanwhile, to achieve the United Nations (UN) sustainable development goals (SDG) of Clean Water and Sanitation, several attempts have been made through ion exchange [7], membrane treatment process [8], reverse osmosis [9], sand filtration (SF) [10], etc. Sand filtration is a viable and economic option to treat wastewater, potable water, and rainwater [11]. Using SF, the maximum TDS removal efficiency of 97.42–99.15% was achieved for influent TDS concentration < 30 mg L−1 [12], while performance declined to 17–59% when TDS concentration increased up to 250 mg L−1 [13]. However, the performance of SF at a higher concentration of TDS above 250 mg L−1 is still uncertain.
On the other hand, improper management of solid wastes makes rural areas more susceptible to decline in soil, air and water quality and associated health issues. In contrast, solid waste management in urban areas nowadays follows a holistic approach based on 4R principles: refuse, reduce, reuse, and recycle [14]. The non-biodegradable wastes such as plastics, metals, and glasses are turned into value-added products [15], while the biochemical processes of composting and anaerobic digestion are considered the best to manage biodegradable wastes with the possibility of recovery of resources [16–19]. The prevalence of the inter-transport system between rural and urban regions introduced non-biodegradable wastes such as plastics into a rural environment; however, the main composition of solid wastes is still biodegradable wastes comprising kitchen wastes, agricultural residues, plant biomass, etc. [20, 21]. The concept of sustainable solid waste management must fulfil proper waste management systems that retain valuable resources within the economy. An investigation alleviating all these concerns at the ground level in a rural arena has not been addressed yet as of the author’s knowledge.
Thus, the motivation behind this study is based on overcoming these environmental concerns proposing a sustainable rural model supporting UN SDG 6 through a case study from rural coastal India. Hence, the primary objectives of the study are to evaluate the feasibility of RWH and SF techniques in managing the water resource management concerns and composting methods for solid waste management to achieve sustainable rural development.
2. Materials and Methods
2.1. Study Area
The study area is a coastal panchayat (Kadinamkulam) that lies in Thiruvananthapuram district, Kerala, India, with a latitude and longitude of 8° 33′ 0.2844″ N and 76° 51′ 19.5732″ E and mean sea level less than 8 m, which fairly represents issues of seawater intrusion and groundwater depletion. Among the 14 districts of Kerala, Thiruvananthapuram district is the most densely populated district in the state, with about 1,508 people occupying per sq. km mainly based on the coast [22]. The study area comprises both semi-urban and rural nature due to its proximity to Thiruvananthapuram City. The panchayat region spreads over 17.68 sq. km, with a total population of about 57,290 and comprises 13,992 households grouped into 23 wards (according to data for the year 2017 as per local self-governing body). The area has a humid subtropical climate with an average temperature of 28.15 ± 2.8°C and an average annual rainfall of 1,865.21 mm between the years 2006 and 2017 [23].
2.2. Household Survey and Geographical Information Systems Application
Convenient sampling was conducted in 130 households to assess peoples’ awareness, education, financial background, current issues in the study area concerning waste and water management, and practices being followed to overcome these issues using prepared questionnaires. The daily solid wastes generation, water consumption, and rooftop RWH potential encrypted on a ward-distribution map of the study area were developed using ArcGIS 10.2 software (licensed to Doon University).
2.3. Water: Its Consumption, Estimation of Potential Using RWH, and Treatment by SF
2.3.1. Water consumption
The average water consumption per capita per day in Thiruvananthapuram District is 0.11 m3d−1 [24]. The average no. of individuals in each household is calculated as,
Thus, the total domestic water consumption for the area can be derived using the formula,
2.3.2. Rainwater harvesting potential
The rooftop RWH technique alone was considered in this study. Google Earth Pro software was used to calculate the rooftop area. The rooftop area of 110 buildings was assessed to determine the total rainwater that can be collected. The rainwater collected from each building has been calculated as proposed in the study by Mishra et al. [25],
2.3.3. Water treatment by SF: reactor configuration and operating strategy
The efficacy of the SF technique for TDS removal from the saline water was determined using two columns of polyvinyl chloride (PVC) with 2 L capacity batch reactors (R1 and R2) operated at the School of Environment and Natural Resources Laboratory, Doon University, Dehradun. Each reactor column was 9 cm wide and 31.5 cm in height. Locally available river sand was used as media for SF after following the sand washing and oven drying procedures at 120°C. The sand media arrangement from top to bottom in R1 and R2 were as follows: 10 mm, 2 mm, 1 mm and 0.106 mm (R1) and 10 mm, 2 mm, 1 mm and 0.25 mm (R2). The reactors were differentiated based on sand retained on sieve sizes of 0.2 mm (considered coarse sand) and 0.106 mm (considered fine sand) in the study. While the effective diameter of R1 and R2 were 0.25 and 0.4 mm. The sand media was filled at a depth of 15 cm in both reactors.
The reactors were fed daily with freshly prepared simulated saline water for 16 d at hydraulic retention time (HRT) of 24 h. The saline water was prepared with the addition of sodium chloride (NaCl) in double-distilled water. The selection of NaCl salt was done based on its relatively higher contribution in the seawater and it correlates well with the TDS. 1 mg of NaCl per litre is equivalent to 1 mg of TDS in a litre of water found out by laboratory analysis. The NaCl concentration in the saline water was increased every 4 d till the end of the experiment from day one to maintain an average TDS concentration of 53, 263, 420, and 874 mg L−1. The saline water fed into the reactor was grab sampled and analysed on the same day of feeding. Meanwhile, the effluent samples were analysed on the next day.
2.3.4. Physical analysis
The sieve analysis of sand media was carried out as per the American Society for Testing and Materials (ASTM) test methods [10]. The water holding capacity, bulk density and porosity of the soil were determined as in Goswami et al. [26] and Jain and Kalamdhad [27].
2.3.5. Chemical analysis
The quality of regional groundwater was tested from samples of randomly selected households having water wells. The results were compared with the seawater samples taken from the study area. The portable multi-parameter kit (Make: LABMAN, Model: LMMP-30) was used to analyse pH, electrical conductivity (EC), salinity, and TDS. The TDS concentration in grab water samples (influent and effluent) from the SF technique was also analysed using this method. The estimation of the total hardness and chloride was done as per standard methods [28].
2.4. Waste Generation and Treatment Techniques
2.4.1. Solid wastes generation potential
The quantification of solid wastes in the area was validated by undergoing a one-day sampling of over 106 households. The domestic solid wastes generated per household were collected in a separate polyethylene bag, segregated and weighed (in kg) using the WeiHeng MCP digital weighing machine at the source of generation itself. The wastes are generally categorized as biodegradable and non-biodegradable. The biodegradable wastes were further classified as the kitchen, paper, and cloth wastes; meanwhile, the non-biodegradable commonly found were plastic, glass, metals, rubber, hazardous, and e-wastes. The sanitary napkins, diapers, medicine wrappers & bottles, unused medicines, pesticides, batteries, etc., were categorized as hazardous wastes. The electronic equipment of any kind, unused/thrown/rejected, was reckoned as e-waste. The waste generation per capita, waste generation per household per day and waste generated per ward per day was calculated using the formula as given in Eq. (6), (7) and (8),
Further, the feasibility of two composting methods (viz. pit composting and in-vessel composting) was assessed. The compost temperature during the digestion period of both composting methods was monitored using ThermoPro TP-01A Digital Thermometer.
2.4.2. Pit composting
The daily wastes collected from the households were dumped in a yard compost pit of dimensions 2 × 2 × 2 ft. The collected wastes contained fresh wastes such as fruit peels, broken coconut shells, coconut leaves, vegetable clippings, shredded green leaves, cardboard shreds, paper wastes. The pit was filled with a 1:1 of the collected wastes and dry leaves on a volume basis, maintaining a suitable carbon-to-nitrogen (C/N) ratio. The filling was continued for 1 week until the ¾th part of the pit was completed. The pit was partially filled with soil every day after filling to avoid the foul smell and any interaction with insects and animals. After 1 week of filling, the pit was covered with a thick layer of soil. When the top layer of the soil was observed dry, watering was done over the compost pit at an interval of 3–4 d to get enough moisture. This procedure was stopped during rainy days. A similar procedure for pit composting is prescribed in guidelines for solid waste management by Central Pollution Control Board, India [29].
2.4.3. In-vessel composting
A 35 L bucket setup was used as the composting bin for the in-vessel composting. Small holes at appropriate places were manually made in the bucket, viz., upper part for air circulation and lower for leachate collection. The procedure for the in-vessel technique was kept the same as that of pit composting. However, an adequate amount of watering and manual mixing was done using a digging fork hand tool at intervals of 3–4 d for proper aeration and moisture.
2.4.4. Compost maturity test
The maturity of composts was determined through the germination test. For this purpose, 2 mg of compost samples were weighed and dissolved in 20 mL of distilled water. After allowing it to mix well in the rotary shaker for 15 min, the solution was filtered out using Whatman (0.45 μm). A fresh Whatman filter paper was placed over the Petri plate, and 10 mustard seeds were placed over it. The filtered extract was poured upon the seeds drop by drop. The Petri plate was covered and kept in incubation for 24 h at 27°C. A Petri plate set soaked in distilled water was set as a control. The percentage emergence and mean germination time (MGT) were calculated using the formula,
Where t is the time in hours from 0 to the end of the germination test, and n is the number of seeds germinated on the day, t.
2.4.5. Physical analysis
The physical analysis of compost samples was done, as described for the sand filter experiment.
2.4.6. Chemical analysis
The pH and EC of the compost and soil samples were measured using a multi-parameter kit (Make: LABMAN, Model: LMMP-30). 1 mg of each sample was diluted in 9 mL of distilled water after shaking for 2 h, and the supernatant was used to determine the pH and EC. The total organic carbon (TOC) content of the compost was determined using the wet digestion method proposed by Walkley and Black [30]. The total Kjeldahl nitrogen (TKN) content in the compost samples was determined using the closed Kjeldahl apparatus (Make: Pelican, Model: Kelvac), while ICP-MS (Make: Teledyne leemal labs, Model: PRODIGY XP) and flame photometer (Make: SYSTONIC, Model: S-935) were used to determine total phosphorus, potassium, and sodium content.
2.5. Forecast Modelling
The constant growth rate model was used for population forecasting [31]. The future population has been obtained using the Eq. (11), (12) and (13),
Where GR is the growth rate, P2011 is the population during the year 2011, P2001 is the population during the year 2001, GF is the Growth Factor, Pfut is the future population for the concerned year, and t is the time gap between the years. The resulting population in respective years was used to calculate waste generation and water consumption per year.
2.6. Statistical Analyses
One-way ANOVA was carried out to analyse the performance of the reactors R1 and R2 in the SF technique at different TDS concentrations. For all the statistical analyses and multi-criteria decision-making (MCDM) method, including calculation of mean, maximum, minimum, and standard deviation values, Microsoft Excel 2019 was used with a 95% confidence level.
3. Results and Discussion
3.1. Current Scenario in the Study Area
3.1.1. Water quality, crisis and its impact on the water demand
Although the coastal zone in Kerala contributes only 10% to the total land area, 58.72% of the state’s population is generally based on the coastal area [32]. Consequently, there would be more burden on the groundwater resources near the coast. Fig. 1 represents the areas facing the deterioration of groundwater quality due to seawater intrusion in the study area. The phenomena of rapid seawater intrusion could result from overexploitation of ground-water and high dense seawater from the Arabian Sea, replacing the natural groundwater in the aquifers [33].

The influence of seawater intrusion over the study area.
Table 1 shows the composition of the seawater and groundwater samples from the study area. The seawater was highly alkaline (8.74 pH) with a TDS concentration of 1,650 mg L−1. It was observed that the seawater strongly influences the quality of the groundwater samples as the pH, TDS, EC, salinity, chloride, and hardness were on the higher side. According to the World Health Organization (WHO) and Bureau of Indian Standards (BIS), the permissible range of pH should be between 6.9–9.2 and 6.5–8.5 and TDS between 300–500 mg L−1 for good drinking water. Eventhough, the average pH and TDS of the groundwater were 8.87 ± 0.41, and 498.50 ± 182.37 mg L−1 (Range: 267–879 mg L−1) respectively, some of the areas exceeded the standard permissible limit.

The Water Quality Parameters of Seawater and Groundwater Samples from the Study Area
From the survey, it was found that people were less concerned about groundwater depletion and misuse the resource excessively, especially for agricultural purposes, than required, as no stringent government control policy exists to utilize the groundwater resources. The remoteness and non-continuous supply or availability of the public drinking water system also influenced the people to depend heavily on groundwater resources. There were cases of kidney stones and other related issues in seawater intrusion-affected areas. It could be attributed to the daily ingestion of saline groundwater for drinking and cooking purposes.
3.1.2. State of current solid waste management practices
The non-existence of proper solid waste management practices forced people to choose other easy ways for waste minimization. The study area followed the current solid waste management practices of burning, burying, composting, etc. Generally, the people opted to burn the solid wastes (59%) or bury them under the soil (33% of them). The ease and simplicity, availability of larger back yards, and unawareness might be the probable reasons behind improper waste management practices. Only a few people (6%) preferred composting as a waste minimization approach, using mature compost as organic manure in agricultural farms. Other options, such as open disposal or using neighbour municipal corporation solid waste disposal facilities, were also prevailed. It was evident from the questionnaire survey that there is a correlation between awareness and education. The people were familiar with environmental protection, solid waste management, composting, recycling, etc. A majority of the people were mindful of this manner and are conscious of the consequences of current practices. However, the lack of proper solid waste management remains the main obstacle to tackle the issues of solid wastes.
3.1.3. Waste generation and water consumption potential
The waste generation per capita over the study area was determined as 0.207 kg d−1. However, this was very low compared with urban waste generation per capita, with about 1.56 kg d−1 of waste generation per capita per day in the urban south Asian region [34]. In the study area, one house generates an average amount of 0.758 kg d−1 of solid wastes. The study area generates solid waste per day of 11.90 t, contributing to an annual generation of 4,343.40 t. With the emission factors of CO2, CH4 and N2O prescribed by the Intergovernmental Panel on Climate Change [35, 36], the green-house gas potential of the current waste management practices was estimated to be 2,584.13 t CO2-equivalent from burning and 44.70 t CO2-equivalent from composting of the total waste generated (considering emissions were only occurred from open burning and composting).
Meanwhile, the average water consumption per household was determined as 0.56 m3 d−1, with an average water consumption over the area was determined as 6.51 million litres per day. It contributed to the annual water consumption of 2,375.50 million litres per year. Figure 2 represents the waste generation and water consumption potential per ward. The areas with high waste generation and water consumption potential are in the south-eastern part of the study area. It could be attributed to the rapid urbanization happening in those areas, as it shares boundaries with the nearest city corporation (Thiruvananthapuram).

The ward-wise waste generation and water consumption potential in the area.
3.2. Forecasting of Population, Waste Generation and Water Consumption
The population, waste generation and water consumption have increased each decade from 2020 to 2050. The population growth is expected to rise to 2,81,866 in 2050 in the area and waste generation of 58,346 kg d−1 and water consumption of 31,005.26 m3 d−1. Meanwhile, there is a positive relationship between economic development and the generation of solid wastes [37]. The study area has seen the substantial influence of education and the economy on waste generation and water consumption. In the future, the increase in economy and urbanization causes solid waste generation and water consumption to rise rapidly. It is a fact that the population growth rate is always expected to rise; the predicted projection shows the minimum solid waste generation and water consumption.
3.3. Sustainable Solutions for Managing Solid Wastes Generated
3.3.1. Composting as a green initiative
About 79.81% of the total waste generated in the study area is biodegradable wastes that could be turned into a viable nutrient resource for agriculture through soil conditioning. Thus, two composting techniques: pit and in-vessel composting, were demonstrated in the study area. Composting is recommended as the most suitable and cost-effective option for the volume reduction of biodegradable wastes and soil conditioning, thereby improving its quality, fertility, and productivity [27]. The resulting compost also reduces the need for chemical fertilizers, associated costs, and environmental consequences. In composting, the stabilization of organic matter under controlled conditions is enhanced by micro-organisms, eliminates pathogens, reduces GHGs emissions, and impacts climate change [38]. The temperature substantially reached the thermophilic range for the pit composting technique, in contrast with the in-vessel composting. The thermophilic range could eliminate pathogenic activity during the composting process [27]. The maturity of the compost was determined according to temperature and compost texture. The composts obtained from both the composting methods were seen blackish, with soil type textural properties.
Table 2 represents the results of the nutrient analysis and germination test of compost samples. The pit compost possessed high nutrients of potassium and sodium, while total nitrogen and phosphorus were higher in in-vessel compost. The nutrient values were comparable with the compost prepared using H. verticillate, cow dung, sawdust, and biochar enriched with high nitrogen and stabilized organic matter [39] and vermicompost made from duckweed (Spirodela polyrhiza) [40] (Table 2). pH values were found to be within the neutral range, which is essential for microbial activities. EC indicates the manure quality, and it is non-toxic if its values are almost around 400 μs cm−1 [40]. The values of TOC, C/N ratio, TKN, total potassium and total phosphorus were suitable for microbial degradation, carbon loss and nutrients recovery. According to the percent emergence values, the composts were matured, especially those obtained from the in-vessel composting than from the pit composting within 60 d. The MGT of the seeds was less for the in-vessel composting, which implies a better compost product than pit composting. The MGT values of 21.60 and 25.20 h were less than that of local compost prepared by Radhouani et al. [41], which reported above 72 h. The rain washout, presence of plants and trees near the pit might have influenced the nutrient content, microbial activity and maturity of pit composting within the experimental run period. In general, the quality analysis of the composts suggests that they were suitable for the application in the local soil, improving its quality and properties.

Comparison of the Results of Qualitative Analysis and Germination Test of Compost Ssamples with Previously Reported Literature
3.3.2. Value-added products from non-biodegradable wastes
The green initiative methods can reduce the generated biodegradable wastes and utilize them as bio compost manure. For the total solid waste generated per day, 20.19% includes the non-biodegradable wastes, of which the plastic contributes the major portion of 1,330.24 kg d−1 (11.18%) among non-biodegradable wastes, including plastics. The metal, glass, rubber, hazardous and e-waste were quantified as 383.26 kg d−1 (3.22%), 101.25 kg d−1 (0.85%), 73.27 kg d−1 (0.62%), 310.87 kg d−1 (2.61%) and 202.96 kg d−1 (1.71%), respectively. Table 3 ([42–47]) compares the percentage composition of non-biodegradable wastes in urban areas from several reported literature and the present study. The composition of non-biodegradables in the area follows almost the same pattern as that of an urban area. It could be the influence of proximity to the urban area and rapid urbanization taking place in the area.

The Comparison of Non-biodegradable Wastes in Urban India and Present Study (wt.%)
The low-quality plastics could be shredded and fused with the asphalt to construct roads that improve the quality [48]. This practice increases the durability and longevity of roads by minimizing the consumption of asphalt. Meanwhile, high-quality plastics and metals could be recycled or mixed with other materials for value-added products [49]. Islam et al. [50] and Tamanna et al. [51] propose incorporating the glass powder and shredded rubber as an alternative to the natural sand for concrete mixing. While the powdered glass can be used as an insulation foam [52], the rubber can also be transformed into activated charcoal for the adsorption of pollutants [53]. Such scientific waste management methods could substantially decrease the GHGs emissions than from current improper practices.
3.4. Groundwater Rejuvenation and Saline Groundwater Treatment for Potable Water
3.4.1. Efficacy of rainwater harvesting for artificial groundwater recharging
In the study area, the groundwater level declined up to 4–20 m during the pre-monsoon and post-monsoon seasons of 2013 and 2014 [54]. The rainfall pattern over the area is strongly influenced by the southwest and northeast monsoons. The area is characterized by dry days (about 263 d), mainly in summer and winter [24]. Thus, the massive pressure on groundwater would be reduced considerably with the availability application of the proper technique to feed the runoff water into the ground. It was estimated that every 100 m2 rooftop area of a household could collect about 0.140 million litres per year in the area. Considering that about 50% of the area is constructed structures, about 123.66 million litres of water per year can be collected through proper rainwater harvesting techniques. It was observed in the area that there were decentralized water wells in all the wards in the study area. The modification of these water wells with a percolation tank is recommended for the artificial recharging of groundwater [55]. The RWH technique might cause a reduction in seawater intrusion in coastal wards.
3.4.2. Feasibility of SF for potable water treatment
For the effective removal of TDS from potable water, the feasibility of SF was assessed. The TDS removal efficiency gradually increased as the influent concentration increased in both the reactors (Fig. 3(a), (b)). However, the R2 reactor with coarse sand performed better than the R1 with fine sand regarding TDS removal efficiency. The ANOVA test results showed that R2 was strongly significant than R1 in terms of TDS removal (p < 0.05; fobs > fcrit) at every TDS concentration. The average removal efficiency of the reactors R1 and R2 at different TDS (average) concentrations were 9.36 and 20.65% at 53 mg L−1, 12.05 and 20.06% at 263 mg L−1, 28.20 and 45.08% at 420 mg L−1, and 49.72 and 51.27% at 874 mg L−1, respectively. Also, it was observed that the influent and effluent TDS concentrations were exponentially related (R2 = 0.98 for R1; 0.96 for R2). Hence, it is validated that both the reactors showed that a higher concentration of TDS could be reduced significantly using SF. However, this was opposed to the study done by Solomon [13]. The HRT, media depth and sand characteristics enhance the performance of the sand filtration Verma et al. [10], which could be the reason for the varied results in this study from the reported literature. The pH, temperature, and porosity play a vital role in removing TDS from the water samples. The correlation between the effluent TDS with pH, temperature, and porosity is 0.35, 0.59, and 0.65, respectively, for the reactor R1, whereas for the reactor R2, it showed a relation of −0.83, −0.83 and 0.54, respectively.

The TDS treatment profile of reactors R1 and R2 during the experimental study.
3.4.3. Evaluation of local soil characteristics for artificial recharging and SF media
The physical and chemical properties of the soil samples from the study area are illustrated in Table 4. The soil samples’ texture was sandy loam with a small amount of clay present in certain areas, with sand (0.05–2 mm) comprising 74% of the total composition. Hence, the water holding capacity was lower (47.86%), and porosity was higher (52.14%), the reason behind the need for a high frequency of watering in agriculture in the study area. However, the advantage of sandy loam soil is its low runoff and high infiltration capacity [56], which makes it viable for artificial groundwater recharging using RWH [57]. Meanwhile, the particle size between 0.106–2 mm of sand is also suitable for sand media [13], which was primarily available in the soil samples.

Physical and Chemical Properties of Soil Samples from Study Area
3.5. Economics of Green Technologies for Rural Application
Two types of conditions were considered for the cost estimation of the RWH system: (a) households with existing water wells and (b) households with no water wells. On average, it was estimated that costs for retrofitting the RWH system in a household with a rooftop area of 100 m2, typically ranges from USD 150 to 400. Meanwhile, the construction of a new groundwater recharge well could charge an additional cost of approx. USD 400–500 per household. Estimating the total capital cost of an RWH system ultimately depends on site conditions and consumer preferences. For new constructions, if the planning is done upfront, the incremental costs due to rainwater harvesting would be reduced.
Regarding the cost estimation of the SF unit, it was assumed that the sand filter media were locally available; investment was done only on outer material (considered as PVC) and installation charges. The estimated cost for the SF unit was calculated to be USD 16 to 85 per m3 per household. It was about 25 to 80% less expensive than the available water purifiers in the market with less operating volume and primarily unaffordable for the rural population.
For the in-vessel composting method, the market price of available products (capacity: 10 to 50 L) varied from USD 12 to 350 per unit. However, the same would be reduced by approx. 33.33 to 98% if the in-vessel composting unit is prepared using a pot, bucket, or similar equipment. The in-vessel composting unit of 35 L had a total expense of USD 8 to 10 for conducting experiments in the study. Moreover, the cost of the composting unit varies according to the quality of the material, added features such as in-built mixer, closing lid, enclosed bacterial inoculum, working capacity etc. It was considered that no cost is to be invested for the pit composting, as no external products are required. The only expense that could be considered is labour charges if they do the maintenance of the pit. If that is the case, it might cost about USD 2 to 10 per household per day in developing countries.
3.6. Decision-making and Policy Interventions for the Application of Green Technologies in Rural Areas
From the ground-level scenario observations and survey results, an approach to decision-making regarding selecting and applying green technologies was solved using the weighted sum model (WSM), an MCDM method. WSM is a popular, simple, and effective method for evaluating several alternatives (green technologies here) in terms of different attributes [58]. The four different attributes considered in this study were: needs of additional resources, investment cost, social acceptance and ease of implementation and operation. Table 5 shows the step-by-step estimation of the WSM method as per Loganathan et al. [58], considering equal criteria weights of value 0.2 and Table 7 shows the performance score and ranking of the three green technologies addressed. From the results, composting seems to be the option that would be opted among the public for implementation, considering the four attributes followed by SF and RWH. It is majorly because of the public’s social acceptance, awareness, and willingness to avail the composting techniques with the additional advantages of fewer requirements of additional resource and investment cost. The SF technique, which is still at preliminary research regarding TDS removal, had lower scores for social acceptance and ease of implementation and operation and required a good amount of additional resources. With the characteristics of higher investment cost and additional resources required, RWH ranked behind composting and SF. However, a vast coverage and application of these green technologies rely on the policies and associated linkages, which are currently not implied, particularly for rural regions.
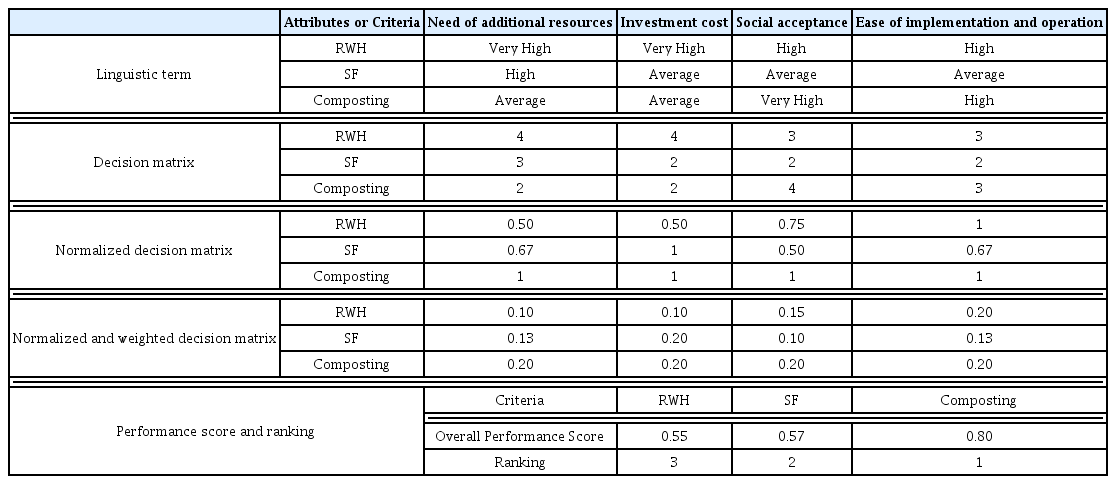
Matrices of WSM MCDM Method
Numerous policies for implementing solid waste management and water management exist in India for urban and rural regions. However, challenges and lack of clarity regarding implementation, skilling, safe usage and awareness, and social consciousness about the advantages of green technologies still prevail, especially in rural regions. Thus, the government must take initiatives to educate and empower the rural population and local self-governing bodies about the advantages of these green technologies, ensuring sustainability and improving the living standards for the local community. Implementing new policies, schemes, and subsidies specific to rural areas with different geographical features (hilly, plain, and coastal) must be done, advocating technological, socio-economic, and institutional novelties for sustainable solutions related to these environmental concerns.
3.7. Practical Implications and Future Recommendations
The green technologies of RWH, SF and composting were assessed in this study and explored the possible application in a rural arena.
But the study carried out was preliminary to check the feasibility and hence, requires further investigations. RWH has massive potential in recuperating the seawater intrusion concerns. Although RWH is preferred and feasible for artificial groundwater recharging, its ability to reduce seawater intrusion and salt concentrations needs further investigation over its implementation and its design suitable for rural regions. Meanwhile, SF possesses an advantage of localized treatment of groundwater for drinking. Though the study could not utilize the sand fraction from soil sample of the study area; nonetheless, the locally available sand was suitable for the application in SF as media. More research in terms of local media, long-term performance and backwashing intervals need to be analysed.
Moreover, the waste generation potential performed in the study was based on one day sampling, which needs to be further validated. Even though the consequences of burning and composting in terms of emissions have been addressed, the aftereffects of the burying of solid wastes must be evaluated further in terms of soil quality degradation and leaching of pollutants into the groundwater resources. In addition, in-vessel and pit composting methods were feasible for household waste management and supporting segregation at the source of organic and inorganic wastes. The matured compost from both the composting techniques could be utilized to improve the water holding capacity of the sandy loam soil present in the study area. However, further comprehensive composting studies are required using different inoculum, techniques, and strategies to evaluate the possibilities to reduce the compost run period. Although the current study is still preliminary, the following recommendations are proposed from the present study:
There is an immediate requirement of integrated solid waste management and control over groundwater exploitation in rural India, formulating and implementing a government policy mandate.
RWH and SF techniques could significantly reduce seawater intrusion and an improvement in the overall drinking water quality. However, this study recommends further research on these techniques.
The promotion of waste management approaches such as waste segregation at source and the adoption of composting might drastically minimize waste generation and human health repercussions, simultaneously increasing soil fertility and, consequently, agricultural production.
4. Conclusions
The study analysed the feasibility of green technologies and methods, viz. RWH, SF, and composting for remediating the environmental concerns in the coastal region of Kerala, India. RWH and SF could improve potable water quality through artificial recharging of rainwater and TDS removal using SF treatment. The soil quality of the area is feasible for RWH and has potential applications to be used as locally available SF media. Since there were no major differences in the compost characteristics, both methods are suitable for rural regions. The selection of the composting method was done based on two criteria: availability of plot area and quantity of waste generated. The households with a large backyard could be opted for pit composting, while those with lesser backyard areas could be adopted the in-vessel composting.
The deterioration of water quality and unmanaged solid wastes poses a threat to public health and quality of life, especially to the socially and economically weaker society and the local ecology. Thus, this preliminary study lays a stepping stone for sustainable rural development and directs future studies to improve the efficacy of these green technologies and their implementation in rural regions.
Acknowledgment
The authors sincerely acknowledge the School of Environment and Natural Resources faculties and laboratory staff, Doon University, Dehradun, and Department of Civil Engineering, Jamia Millia Islamia, New Delhi, for their continuous support and encouragement. The authors are thankful to Kadinamkulam Panchayat’s local self-governing body staff during the collection of demographical datasets. The co-operation of the local people was inevitable.
Notes
Author Contributions
T.C.D. (Master’s student) conducted all the experiments and wrote the initial draft of the manuscript. R.M.M. (Master’s student) supported the surveying and data analysis. S.V. (Ph.D. student) and A.A.K. (Assistant Professor) supervised and supported with the resources and wrote and revised the manuscript. R.C. (Assistant Professor) supervised, wrote and revised the manuscript.