Ecological risk by potentially toxic elements in surface sediments of the Lake Maracaibo (Venezuela)
Article information

Abstract
The evaluation of potential ecological risk of aquatic sediments associated with the presence of potentially toxic elements (PTE) determines its degree of danger on native biota. In this work, the potential ecological risk of V, Ti, Cr, Ni, Cu, Zn, As, Se, Cd, Sn, Hg and Pb in superficial sediments is explained in three different areas of Lake Maracaibo: El Tablazo Bay, Strait of Maracaibo and the lake itself, through a multi-guideline approach (elemental enrichment (enrichment factor, contamination degree, pollutant load index and geo-accumulation index), sediment quality guidelines and risk assessment code). The PTE levels ranged from < 0.025 to 176.722 mg·kg−1 DW, with an overall proportion of V > Ti > Pb > Zn > Cr > Cu > Ni > As > Cd > Se > Hg > Sn. The PTE concurrent effect on biota was El Tablazo Bay > lake > Strait of Maracaibo. The superficial sediments of Lake Maracaibo constitute a medium with a high potential ecological risk on estuarine biota. This is mainly due to the levels of As in El Tablazo Bay, Cd in the Strait of Maracaibo and Pb in the lake area. This represents a latent toxicity hazard for native biological communities and other associated organisms.
1. Introduction
Potentially toxic elements (PTE) such as metals, metalloids and others are persistent, and non-degradable. They can be bioconcentrated and biomagnified in the food chains until it reaches humans. The pollution by these elements in aquatic ecosystems is becoming a global problem, increasingly affecting biological communities, and may lead to various ecological changes (e.g. extinction of species, development of microbial resistance, enzymatic and genetic changes, among others) [1, 2]. The sediments and suspended materials play an important role in the processes of adsorption, desorption and dissolution, and sedimentation [3]. Solubilization, speciation, precipitation, as well as diffusion and advection, are also critical processes that determine the spatial distribution of PTE in water bodies [1]. For these reasons, sediments have been widely used as indicators of the environmental quality of aquatic ecosystems [4–9]. They provide essential information about the historical record and functionality of these environments. Furthermore, these compartments influence the trophic networks and serve as an area where contaminants for bioaccumulation and trophic transfers remain [10].
The PTE sources in the environment can be both natural and anthropogenic. Natural or geological sources include the weathering of element-containing rocks and volcanic eruptions. Global trends in industrialization and urbanization on Earth have led to an increase in the anthropogenic proportion of these elements in our environment. Anthropogenic sources include mining, road traffic, industrial and agricultural activities [11, 12]. These elements are released during the excavation and extraction of different compounds of their respective minerals. PTE released into the atmosphere during mining, smelting, and other industrial processes return to the earth through wet and dry deposition. The discharge of wastewaters such as industrial effluents and domestic wastewaters add PTE to the environment. The application of chemical fertilizers and the burning of fossil fuels also contribute to the anthropogenic contribution of these elements [1].
Due to the potential risk of sediments contaminated with PTE on the overlying water column and benthic biota through chemical and biological exchange mechanisms, it is important to acquire information on the quality of the sediment and its associated ecological risk status. In this sense, several risk assessment indices have been developed that consider the total concentration of PTE, in order to know their potential ecological risk. Similarly, due to the importance of the bioavailability of these elements, indices based on their fractions have also been established, to better understand the ecological risk related to element-specific associations [8, 13–15]. From the point of view of risk for aquatic communities, it is important to determine to what extent contamination in sediments negatively affects this environment, and whether it can be considered a stressor for organisms. Therefore, a challenge for scientists dealing with aquatic risk assessment is to reveal the relationships between sediment contaminants and the response of the biological community [16]. The application of a multi-guideline approach allows a valid and concise evaluation of the potential ecological risk due to the presence of PTE in surface sediments, taking into account the exposure levels to which aquatic organisms are exposed.
The aim of this work is to explain the potential ecological risk associated with PTE (V, Ti, Cr, Ni, Cu, Zn, As, Se, Cd, Sn, Hg and Pb) in surface sediments from three areas of Lake Maracaibo; El Tablazo Bay, Strait of Maracaibo and the lake itself, by estimating the elemental enrichment (enrichment factor, contamination degree, pollutant load index and geo-accumulation index), sediment quality guidelines and risk assessment code. This will establish whether there is a specific threat of PTE damage and its possible effects on environmental conditions. This article constitutes the first study with a multi-guideline approach for Lake Maracaibo sediments, representing an innovative strategy that allows the integration of different criteria of environmental quality, in the explanation of the potential risks regarding the presence of PTE in sediments, and their possible impact on native biota. The environmental problems of Lake Maracaibo date back to 1922, when the first sub-lacustrine extraction activities of crude oil by the Creole Petroleum Corporation began [17]. Over time, different sources of PTE have been detected in this basin from those related to the use of pesticides and domestic and industrial discharges, to the activities of the oil industry, which also involves production and transportation of crude oil, the petrochemical industry, gas processing and coal extraction in open pit mines [18–21]. Previous investigations in this body of water have shown the presence of appreciable amounts of PTE in water, sediment and biota [22–27]. However, a multi-guideline approach to ecological risk related to the presence of these elements has never before been applied in this water body.
As mentioned, the estimation of the potential ecological risk associated with the PTE presence in sediments can be carried out applying quality indices and guidelines, which allows determining the possible toxic effects on the biota caused by the bioavailable levels of PTE in sediments and, consequently, it provides the possibility of acting directly on the anthropogenic sources where these elements originate. Although this approach has been used in various aquatic ecosystems around the world, there is still a long way to go to determine the specific levels of risks and toxic effects of these elements at different trophic levels, in order to establish precise ordinances for the control and management of environmental pollution in each hydrographic system.
2. Materials and Methods
2.1. Study Area
Lake Maracaibo is a partially mixed hypertrophic tropical estuary (average annual temperature of the water 28.1 ± 1.1°C), situated in Western Venezuela (Zulia state). It is located between 70°30′ and 73°24′ West longitude and between 8°22′ and 11°51′ North latitude (Fig. 1), and it has an average depth of 20 m and a maximum of 34 m [18, 19].
Study area: Lake Maracaibo (Venezuela) showing the sampling sites (•).
The Lake Maracaibo System receives a global flow of fresh water of 1,900,000 L·sec−1 from 135 rivers and is formed by the Gulf of Venezuela, El Tablazo Bay, Strait of Maracaibo and the lake itself. The total extension of the system is 121,422 km2 of which 104,900 km2 belongs to Venezuela and 16,432 km2 belongs to Colombia because it is the born from Catatumbo River, the main water source of the lake. The area of the water mirror is 12,780 km2 with a volume of 280 km3, 152 km long and 70 km wide. The Strait of Maracaibo covers an area of 479 m2, with 40 km in length and 14 km wide; this strait and the El Tablazo Bay are an estuarine zone where there is a mixture of fresh water from the lake (South) and sea-water from the Caribbean Sea (North) through the Gulf of Venezuela [18, 20].
The 70% of the gross national product of Venezuela comes from the petroleum extracted from zones lying under Lake Maracaibo, the Misoa formation sands, which produce basically light crude oils (24–40°API) [28], thereby creating a heavy traffic in tankers in and out of the lake. In spite of this, an annual maintenance dredging in Lake Maracaibo has been carried out by the INC (Instituto Nacional de Canalizaciones) since 1953. This institute was formed to manage a dredging program to maintain a navigable channel in Lake Maracaibo with an average depth of 11 m and a longitude of 100.6 km. Over the last 40 years, the salinity of the water has increased by about 300% as a result of dredging, which has altered the natural interaction between the lake and the Caribbean Sea [29].
The lake is surrounded by about 2,000 diverse industries (e.g. petrochemical, gas processing, transportation of hydrocarbons, metal-mechanical, tanneries, pharmaceutical, food companies like slaughterhouses and shrimp, among others) and proximally 10,000 oil drilling platforms are situated near to its center [18, 20, 30]. A growing open coal industry near to the Guasare River (a tributary) and the transport through the lake (non-point contamination source) could also affect the concentrations of As, Hg, V and Pb [31]. In addition, the Lake Maracaibo receives loads of nutrients from tributaries, sewage discharges, and agricultural sources. The city of Maracaibo, with a population of 3 million people, discharges raw sewage directly into the Strait of Maracaibo located on the northern part of the lake. Moreover, the constant dredging of the channel maintain the sediments in a constant resuspension and open to different reactions with the nutrients that can increase eutrophication and the availability of PTE which can increase the concentration of the most dangerous toxic species [19].
2.2. Sampling
Fig. 1 shows the 13 sampling sites considered for this study which correspond to the stations used by ICLAM (Instituto para la Conservación del Lago de Maracaibo) for its environmental monitoring programs in the lake. In these sites, 1 kg of sample of surface sediments with the help of an Ekman-type hermetic dredge in three sampling campaigns were taken. The sediments were protected from light and kept refrigerated during transport to the laboratory. In the laboratory, the sediment samples were homogenized, frozen and lyophilized to start the PTE analysis.
The 13 sampling sites in Lake Maracaibo were distributed as follows: (i) 2 sites into the El Tablazo Bay (mixing zone with the Gulf of Venezuela) denoted PR and SC, (ii) 4 sites into the Strait of Maracaibo (intermediate estuarine zone with strong anthropogenic influence) denoted D-2, D-4, D-5A and NO-2, and (iii) 7 sites into the lake area (main zone of the lake with riverine influence) denoted O-13, O-20, C-1, C-11, C-9, CA-2 and D-33 (Fig. 1).
2.3. Analysis of Exchangeable, Reducible, Oxidisable and Residual Fractions of Potentially Toxic Elements
The contents of V, As, Se, Sn, Hg and Pb in aqueous extracts of sediment samples were determined by inductively coupled plasma mass spectrometry (ICP-MS) using a Hewlett Packard 4500 apparatus. The procedure of sequential extraction by Davidson et al. [32] was applied in the sediment samples (three steps).
2.4. Analysis of Total Potentially Toxic Elements
For the analysis of PTE total contents 0.2 g of lyophilized sediment were transferred into a microwave vessel (Milestone model MLS-1200 Mega), and 4 mL of concentrated HNO3 and 1 mL of H2O2 (30% v/v) were added. After the run, the vessel was cooled and opened, 1 mL of nitric acid and 0.25 mL of hydrogen peroxide were added. The microwave’s program was then run. The vessel was cooled, opened and the content transferred to a 25 mL volumetric flask and made up to volume with deionized water. V and Ti were measured by inductively coupled plasma atomic emission spectroscopy (ICP-AES) in a Hewlett Packard 4500 apparatus. Fe was determined by inductively coupled plasma optical emission spectrometry (ICP-OES) using an ICP Spectro model P apparatus. The other elements were analyzed by inductively coupled plasma mass spectroscopy (ICP-MS) in a Hewlett Packard 4500 apparatus. The results are expressed in dry weight (DW).
The polluted estuarine sediment IAEA-356 reference material (International Atomic Energy Agency, Austria) was used as quality control material to validate the total elemental determinations. The recovery rates for PTE in this standard reference material were between 97.8 and 102.4% indicating the good accuracy of the analysis method, while the precision expressed as relative standard deviation was below 5% showing an acceptable degree of variability between analytical repetitions. Analytical blanks were run in the same way as the samples and concentrations were determined using standard solutions prepared in the same acid matrix. Standards for the instrument calibration were prepared on the basis of mono element certified reference solutions (Merck, Germany).
2.5. Enrichment Factor and Contamination Degree
The enrichment factor (EF) is an effective tool of normalization that is widely used to separate the elements of natural variability from the element fractions that are associated to anthropogenic activities [8, 33]. The EFs for element concentrations in sediments (V, Ti, Cr, Ni, Cu, Zn, As, Se, Cd, Sn, Hg and Pb) at all the sampling sites were calculated as [34]:
Where element/Fe is the ratio of the element concentration to Fe. Fe was chosen as the element of normalization also because of natural sources (98%) vastly dominates its input [33], moreover, it is a major sorbent phase for trace elements, and is a quasi-conservative tracer of the natural element-bearing phases in fluvial and coastal sediments [35, 36]. The crustal abundance data of Turekian and Wedepohl [37] and of the soils of the Zulia state (Venezuela) [38] were used for all EF calculations. Usually, EFs values are categorized at four classes [39]: class 1 low (< 1), class 2 moderate (1–3), class 3 considerable (3–6) and class 4 very high (> 6).
The contamination degree (CD) is also widely used for the estimation of the anthropogenic impact on sediment chemistry, referring to the load degree of elemental concentrations in sediments investigated relative to uncontaminated background levels (baseline) [39]. The CDs values were calculated using the following equation [8]:
Where CF denotes the contamination factor of the specific PTE investigated. The CFs values were calculated as follows [39]:
Where Cs is the concentration of the examined element in the surface sediment studied sample and Cb is the geochemical background concentration of a given element. The background concentration data of Turekian and Wedepohl [37] (1961) and of the soils of the Zulia state (Venezuela) [38] were used for all CF calculations (V, Ti, Cr, Ni, Cu, Zn, As, Se, Cd, Sn, Hg and Pb). The CDs values are categorized at four classes [39, 40]: class 1 low (< 6), class 2 moderate (6–12), class 3 considerable (12–24) and class 4 very high (> 24).
2.6. Pollution Load Index
The overall contamination in PTE content of surface sediments at the studied sites was evaluated using the pollution load index (PLI), calculated with the following equation [8, 41, 42]:
Where n is the number of PTE and CF the contamination factor of studied elements. PLI values close to 0 or 1 indicate perfection or baseline levels of pollutants present, respectively; on the contrary, PLI values >1 indicate progressive deterioration of the area [8, 43].
2.7. Geo-accumulation Index
To understand the current status of the environment and the PTE contamination in respect to the natural condition for the Lake Maracaibo, the geo-accumulation index (Igeo) was applied using the following equation [44–46]:
Where Cn is the concentration of the examined element in the surface sediment studied sample, Cbn is the geochemical background concentration of a given element and the factor 1.5 is the matrix correction factor of the background concentration due to the lithogenic effects. The background concentration data of Turekian and Wedepohl [37] and of the soils of the Zulia state (Venezuela) [38] were used for all Igeo calculations (V, Ti, Cr, Ni, Cu, Zn, As, Se, Cd, Sn, Hg and Pb). Müller [47] has distinguished seven classes to Igeo: class 0 unpolluted (≤ 0), class 1 unpolluted/moderately polluted (0–1), class 2 moderately polluted (1–2), class 3 moderately/strongly polluted (2–3), class 4 strongly polluted (3–4), class 5 strongly/extremely polluted (4–5) and class 6 extremely polluted (5–6).
2.8. Sediment Quality Guidelines
SQGs are an important tool for the assessment of contamination in estuarine sediments, because they can have a high predictive ability and are a vital tool for identifying areas with potentially adverse biological effects [6]. In this study, we applied the Canadian sediment quality guidelines that include maximum concentrations of PTE for the protection of aquatic life [48]. Also, the PTE concentrations in surface sediments at each site were compared with the SQG values and classified according to the proposal by MacDonald et al. [49] as follows; effect range low (ERL), effect range median (ERM), threshold effect level (TEL) and probable effect level (PEL), considering that: (i) Concentrations below TEL are not associated with any adverse biological effect, between TEL and PEL they can occur occasionally and above PEL frequently, (ii) Concentrations below ERL rarely can cause adverse biological effects, between ERL and ERM occasionally and higher than ERM frequently [49, 50]. These two sets of numerical SQGs are directly applied to assess the possible risk associated with PTE contamination in the sediments.
The multiple PTE contamination which is often encountered in natural environments affected by human activities was also calculated in terms of mean-effects range medium-quotient (m-ERM-Q) by the following relationship [51, 52]:
Where Ci is the concentration of measured element i, ERMi is the ERM values of element i [50], and n is the number of element i. The m-ERM-Qs values are defined at four classes of toxicity probability for biota [4, 51]: class 1, 9% (< 0.1); class 2, 21% (0.11–0.5); class 3, 49% (0.51–1.5) and class 4, 76% (> 1.51).
2.9. Risk Assessment Code
Risk assessment code (RAC) determines the availability of PTE in sediments by applying a scale to the percentage of elements in the exchangeable and carbonate fractions [52], considering that the association of elements with different geochemical fractions is a critical parameter in assessing the potential mobility and bioavailability of PTE in sediments. The RAC was established by Perin et al. [53], and according to the RAC guideline, for any element, when the total ratio of the exchangeable and carbonate fractions is less than 1%, the environment can be seen as secure; when the total ratio is more than 50%, the hazard is very high, the PTE are very easy to enter the food chain [54]. The RACs for elemental concentrations in sediments (V, As, Se, Sn, Hg y Pb) were calculated as [53, 55]:
Where CF1 is the element concentration in exchangeable, carbonate and soluble fractions of the sediment and Ctotal is the total concentration of each element in the sediment. The classification of risk has been categorized in terms of RAC [53] as: grade I no risk (< 1), grade II low (1–10), grade III medium (11–30), grade IV high (31–50) and grade V very high (> 50).
2.10. Statistical Analysis
For the interpretation of the data of PTE analysis the following methodology was used: (i) descriptive statistics (arithmetic mean, range, and standard deviation), these values were studied by means of analysis of variance (ANOVA, one way), to determine the existence of significant differences between the three areas: El Tablazo Bay, Strait of Maracaibo and lake. A value of P ≤ 0.05 was considered to indicate statistical significance; and (ii) multivariate analysis, including Pearson’s correlation analysis, and cluster analysis, among sampling sites (13 factors) and among PTE (12 factors), as an effective tool to identify the PTE sources [7, 8, 15, 56]. The assumptions for these analyzes: (i) subjects were independent, (ii) the standardized residuals were normally distributed (Shapiro-Wilk test), and (iii) homoscedasticity was guaranteed (Levene test) but cosine transformations were required for data to meet this condition. For the hierarchical cluster analysis (HCA) the distance metrics were based on the Euclidean distance single linkage method (nearest neighbor). All statistical analysis in this study is performed using SPSS 20.0 analysis software.
3. Results and Discussion
3.1. Distribution of Potentially Toxic Elements in Surface Sediments
Fig. 2 shows the PTE’s percentage contribution in surface sediments of El Tablazo Bay, Strait of Maracaibo and lake. The concentrations of V, Sn and Se were significantly different (P < 0.05) between these three areas of the lake. The lowest levels of Ti, V, Ni, Cu, Zn, As, Se and Cd were present in D-5A (Strait of Maracaibo), the highest levels of Cr, Ni, Cu and Pb in D-33 (lake), while that the highest total sum was observed in O-20 (lake). In general, the concentrations were V > Ti > Pb > Zn > Cr > Cu > Ni > As > Cd > Se > Hg > Sn.
Percentage contribution of potentially toxic elements in surface sediments of Lake Maracaibo.
The low PTE content in D-5A (Fig. 2, Strait of Maracaibo) could result from type and composition of sediment [57] in this area, as well as from physicochemical characteristics of the water-sediment interface [58], and of processes involved in its mobilization and bioavailability [3], which can result in low elemental retention capacity in the sedimentary bottom. In contrast, O-20 (lake) exhibited the highest total sum of PTE, possibly due to these same factors and the counterclockwise circulation pattern of water masses around the hypolimnetic cone located near the center of this lake (other sites of this zone with a high elemental content were D-33, O-13, C-11 and C-9). The Catatumbo River contributes an appreciable amount of freshwater and sediments to lake and influences this vortex movement. Since its discharge produces water isolation at the lake southern portion, functioning as a hydrostatic barrier, raising water level and causing a pressure gradient from South to North. This movement of water masses is consistent throughout the year, having great repercussions on distribution of elements, nutrients and some biological factors [18, 20, 59]. In the same way, a higher concentration of Cr, Ni, Cu and Pb would be observed in D-33 (lake), coupled with discharges of the main tributary rivers in the Southern zone of Lake Maracaibo.
The HCA was used to classify and characterize the sampling sites in relatively homogeneous groups, according to elemental content in surface sediments (Fig. 3(a)), obtaining two main conglomerates, the first formed by O-20 and the second by remaining sampling sites. In this second group, three smaller conglomerates could be distinguished, the first with C-11, C-9, D-4 and D-33 belonging to the lake area (except D-4), where concentrations were Pb > V > Zn > Ti > Cr, representing central-South zone dynamics of this system with strong lacustrine characteristics around the hypolinmetic cone. The second conglomerate with C-1, CA-2, O-13 and D-2 also from the lake area (except D-2), where amounts were Ti > V >Zn > Pb > Cr and under the possible influence of tributary rivers: in C-1 Pueblo Nuevo, Machango and Misoa rivers; in O-13 Palmar River and in CA-2 Catatumbo, Escalante and Birimbay rivers (Fig. 1). The third conglomerate formed by PR, SC, NO-2 and D-5A from El Tablazo Bay and Strait of Maracaibo with a proportion of Zn > Ti > V > Pb > Cr, where effects of point discharges from various industries, factories and coastal cities is observed. Finally, completely differentiated of the remaining sites is O-20, having Ti > V > Pb > Zn > Cr and possibly reflecting a particular area within this ecosystem, with distinctive characteristics resulting from the counterclockwise movement around the hypolimnetic cone and hydrostatic barriers of water masses, according to Parra-Pardi [18].

Dendrograms of hierarchical clustering analysis show the relevant association in surface sediments from Lake Maracaibo, (a) concentrations of potentially toxic elements at each sampling site, (b) Pearson’s correlations among potentially toxic elements, distance metrics are based on the Euclidean distance single linkage method (nearest neighbor).
Multivariate statistical analysis, including Pearson’s correlation analysis and HCA, is used to identify similar origins or geochemical characteristics between PTE when they are interrelated [7, 8, 15, 56]. According to Pearson’s analysis, significant positive correlations were found between some of them (Table 1), which could represent similar sources of natural and anthropogenic origin, while the significant negative correlation between Se and Sn (r = −0.774, P < 0.01), would indicate a contribution from different sources. In addition, the absence of significant correlations between Hg and another element was characteristic, being able to indicate that it comes from a particular source different from those of other elements, while Ti, Sn and Se only showed affinity with V (r = 0.606, P < 0.05), As (r = 0.740, P < 0.01), and V (r = 0.625, P < 0.05), respectively. Using HCA (Fig. 3(b)), two main groups of elements could be distinguished, the first formed by As, Sn and Hg, and the second by Cu, V, Ti, Se, Ni, Zn, Cr, Pb and Cd. In the first group, two smaller conglomerates were obtained, one with Hg and the other with As and Sn. In the second group, two smaller conglomerates were also observed, one with Cu, V, Ti and Se, and the other with Ni, Zn, Cr, Pb and Cd, due to the following pairs of significant positive correlations: Cu-V = 0.805, Zn-Ni = 0.725, Cd-Zn = 0.598, Cr-Zn = 0.629, Ni-Pb = 0.574, Pb-Cr = 0.542 and Ni-Cr = 0.647, denoting a possible common source for these elements and intervening on the toxicity level of sediments, which will be discussed later.

Pearson’s Correlation Matrix for Potentially Toxic Elements in Surface Sediments of Lake Maracaibo
The PTE concentrations found in superficial sediments of Lake Maracaibo contrast with those of some water bodies (Table S1). The Cr, Ni, Cu and Zn levels, for example, are lower than those of Chaohu Lake, China [14] and Bahía Blanca Estuary, Argentina [60], while the Cd and Pb concentrations are greater than those reported for Gala Lake, Turkey [61], Gulf of Cariaco, Venezuela [62] and Bay of Bengal, Bangladesh [63]. The As concentrations, meanwhile, are lower than those found in the Guadiana Estuary, Spain [64], and higher than those of the Gala Lake, Turkey [61]. These differences reflect the impact of local anthropogenic sources which differently affect each ecosystem, and which contribute to the risk level of sediments in each locality.
3.2. Elemental Enrichment Levels in Surface Sediments
The use of different enrichment level indices allowed the estimation of anthropogenic contributions of Ti, V, Cr, Ni, Cu, Zn, As, Se, Cd, Sn, Hg and Pb in surface sediments of Lake Maracaibo: EF (Fig. 4(a)), CD (Fig. 4(b)) and PLI (Fig. 4(c)). However, there could be an overestimation of the EF values in D-5A associated with the use of Fe as a normalizing element, resulting from the low elemental proportion in sediments of this sampling site (Fig. 2). According to Birch [65], changes in sediment’s granulometry and mineral composition of clays, among other factors, affect the EF estimates through the use of Fe and Al as normalizing elements, even existing ambiguities in the calculations regarding a particular element [66]. In general, the EF levels were: Pb > As > Cd > V > Se > Zn > Cr > Hg > Cu > Ni > Sn > Ti. V and Cd differed significantly (P < 0.05) between the three areas, with respect to anthropic enrichment levels. In the Lake Maracaibo basin, diverse antropogenic activities are developed in conjunction to the presence of numerous industries and companies stationed on the lake’s shoreline, particularly in the Strait of Maracaibo. Thus, the tributary rivers contribute a large amount of materials and substances that enter the lake [59, 67], including products of the Caño Limón pipeline, in Colombia, due to illegal actions of insurgent groups; as well as large oil spills through the Catatumbo and Tarra rivers that drain into the lake [68].
Elemental enrichment levels in surface sediments of Lake Maracaibo, (a) enrichment factor (EF), (b) contamination degree (CD), the horizontal segmented line represents the CD value of 24 (very high contamination), (c) pollution load index (PLI), the horizontal segmented line represents the PLI value of 1 (progressive deterioration of the area).
In El Tablazo Bay, an 8.3% of low anthropogenic enrichment level was found for Ti (EF value < 1), 33.3% moderate level for Ni, Cu, Sn and Hg (EF value 1–3), 8.3% considerable level for Se (EF value 3–6) and 50.1% very high level for V, Cr, Zn, As, Cd and Pb (EF value > 6). In the Strait of Maracaibo, an 8.3% of moderate level was determined for Ti (EF value 1–3), 16.7% considerable level for Ni and Cu (EF value 3–6) and 75.0% very high level for V, Cr, Zn, As, Se, Cd, Sn, Hg and Pb (EF value > 6). In the lake area, a 16.7% of low level was observed for Ti and Sn (EF value < 1), 25.0% moderate level for Ni, Cu and Hg (EF value 1–3), and 58.3% very high level for V, Cr, Zn, As, Se, Cd and Pb (EF value > 6). These data reveal a very high anthropogenic impact on sediments of the study area (EF El Tablazo Bay = Strait of Maracaibo = lake), mainly due to V, Cr, Zn, As, Se, Cd and Pb, which belong to the same HCA conglomerate (except As, Fig. 3(b)).
According to Rivas et al. [59] an average load of 16,405.94 tons of total suspended solids enters Lake Maracaibo daily through its main tributary rivers (Catatumbo, Chama, Escalante, Birimbay, Motatán, Bravo and Santa Ana), contributing specifically with the magnitudes of elements from the lake South to the system’s rest in a North direction (Fig. 1). In addition to this, in the El Tablazo Bay-Strait of Maracaibo zone the presence of PTE of industrial origin in water and sediment is affected by the continuous dredging activity carried out by the INC since 1953, in order to maintain the navigation channel (mean depth of 11 m and length of 100.6 km) for transit of oil tankers [18–20]. This continuous activity causes resuspension and dispersion of elements and other substances, affecting quality and toxicity and enrichment levels of waters and sediments, which would also help explain the low elemental content and high enrichment degree in D-5A for certain elements. According to de Bautista et al. [19], these dredging activities contribute to releasing the Hg trapped in lake sediments, whose concentrations in some cases were above 1 mg·kg−1, warning that an adequate treatment and disposal strategy of dredged material must be implemented.
When the EF values of surface sediments of Lake Maracaibo are compared with those of other aquatic ecosystems (Table S1), it is observed that the As and Pb levels are higher than those of the Bay of Bengal, Bangladesh [63], which has been described as an environment with a high level of anthropogenic impact. Regarding the EF-Cd values, these are similar to those of the Gulf of Cariaco, Venezuela [62], whose pollution degree is moderately severe. Likewise, the enrichment values for Ni and Cu are lower than those of Chaohu Lake, China [14] and Gulf of Cariaco, Venezuela [62], with moderate anthropic impact levels.
All PLI levels were below 1 indicating absence of environmental deterioration [8, 43] in the different areas of Lake Maracaibo (the highest magnitude 0.96 was found in D-2 from the Strait of Maracaibo area). However, regarding the CD guide (Fig. 4(b)), 53.8% (El Tablazo Bay 50.0%, Strait of Maracaibo 50.0% and lake 57.1%) of the sampling sites presented a value > 24, revealing very high contamination; 38.5% (El Tablazo Bay 50.0%, Strait of Maracaibo 25.0% and lake 42.9%) with values between 12 and 24 of considerable contamination and 7.7% (Strait of Maracaibo 25.0%) with values <6 of low contamination. According to the CD for PTE in surface sediments, the anthropogenic impact on Lake Maracaibo is: lake = El Tablazo Bay > Strait of Maracaibo, with a considerable to very high degree of contamination. Stamatis et al. [8] reported CD levels between 19.49 and 209.74 and PLI levels between 0.00 and 11.50 for the Ierissos Gulf (Greece), including Cu, Pb, Zn, Cr and Ni; Mortuza and Al-Misned [69] indicated a CD of 1.28 and a PLI of 0.06 for Cr, Mn, Ni, Cu, Zn, Cd, Pb and As in sediments from the Red Sea (Saudi Arabia), while Truchet et al. [60] found PLI levels between 0.32 and 0.37 in the fine fraction of sediments from Bahía Blanca Estuary (Argentina) for Cd, Cu, Pb, Zn, Mn, Ni, Cr and Fe. These values contrast with those calculated in the present work for Lake Maracaibo, all being characteristic of ecosystems with different levels of pollution, associated with anthropogenic activities carried out locally and that can affect the native biota to a greater or lesser degree, as a result of the discharge of PTE (natural and anthropic) to surrounding environment.
In other matters, the distribution of Igeo values is presented in Fig. 5 with the following magnitudes: Cd > As > Pb > V > Se > Zn > Cr > Hg > Cu = Ni > Ti > Sn. Significant differences (P < 0.05) of the Igeo index for Sn and Se were obtained between the three areas of Lake Maracaibo, as a result of the possible contribution of different sources (significant negative Pearson’s correlation coefficient, Table 1).

Geo-accumulation index (Igeo) of potentially toxic elements in surface sediments of Lake Maracaibo. The horizontal segmented lines represent the Igeo values from 1 to 2 (quality of sediment moderately polluted).
The Igeo values for the sampling sites in Lake Maracaibo allow to classify sediments according to the Müller’s classes [47], as follows: i) El Tablazo Bay: class 0 unpolluted for Cu, Ni, Cr, Ti, Zn, Sn, Hg and Se (66.7%); class 1 unpolluted/moderately polluted for V (8.3%); class 2 moderately polluted for Cd and Pb (16.7%), and class 3 moderately/strongly polluted for As (8.3%); ii) Strait of Maracaibo: class 0 unpolluted for Cu, Ni, Cr, V, Ti, Zn, Sn, Hg and Se (75.0%); class 1 unpolluted/moderately polluted for Pb and As (16.7%), and class 2 moderately polluted for Cd (8.3%); and iii) lake: class 0 unpolluted for Cu, Ni, Cr, Ti, Zn, Sn and Hg (58.3%); and class 2 moderately polluted for Cd, V, Pb, As and Se (41.7%). The sites with the greatest anthropogenic impact in relation to the Igeo guide were (Fig. 5): class 3 (moderately/strongly polluted) for PR and SC (As) in El Tablazo Bay; D-2 (As, Pb and Cd) and D-4 (As and Pb) in the Strait of Maracaibo, and O-20, C-11 and C-9 (Pb) in the lake area; and class 4 (strongly polluted) for D-33 (Pb) in the lake. These results suggest the contribution of substantial sources of As in the El Tablazo Bay, of Cd in the Strait of Maracaibo and of Pb in the lake area, as a product of the sedimentological dynamics of this hydrographic basin and the activities that take place in it.
The Igeo values for As, Cd and Pb in sediments of Lake Maracaibo are similar to reported by Hasan et al. [63] for the Bay of Bengal (Bangladesh) (Table S1), being typical levels of moderately to strongly polluted water bodies. In this way, the elemental enrichment level in superficial sediments of Lake Maracaibo, considering EF, CD and Igeo guidelines, is characterized by a high anthropogenic impact of the three areas studied: El Tablazo Bay, Strait of Maracaibo and lake, where As, Cd and Pb are identified as the elements with the greatest presence and contaminating effect, respectively. Accordingly, these sediments exhibit a considerable to very high impact level (EF and CD) and moderately to strongly polluted (Igeo). Other elements that represented dangerous levels of human influence on this estuarine ecosystem were: V, Cr, Zn and Se, from various sources that contribute differentially to each of the lake areas.
3.3. Potential Ecological Risk Associated with Potentially Toxic Elements in Sediments
Table 2 displays the percentage of sampling sites that exhibited concentrations in the three defined ranges, that is: < TEL/ERL, TEL/PEL-ERL/ERM or ≥ PEL/ERM. As can be seen, the concentrations of Cr, Ni, Cu and Zn in 100% of the sites are not associated with adverse biological effects (< TEL) and could rarely cause this type of effects (< ERL), while 77 and 85% of As, respectively, had the same behavior. A considerable percentage of sites showed Cd levels (31 and 84%), Hg (54 and 62%) and Pb (54 and 46%) that may occasionally be associated with adverse biological effects (≥ TEL and < PEL) and that could occur occasionally (≥ ERL and < ERM), respectively. In addition, 61% of the sites presented Cd concentrations that are frequently associated with ecotoxicological effects (≥ PEL).
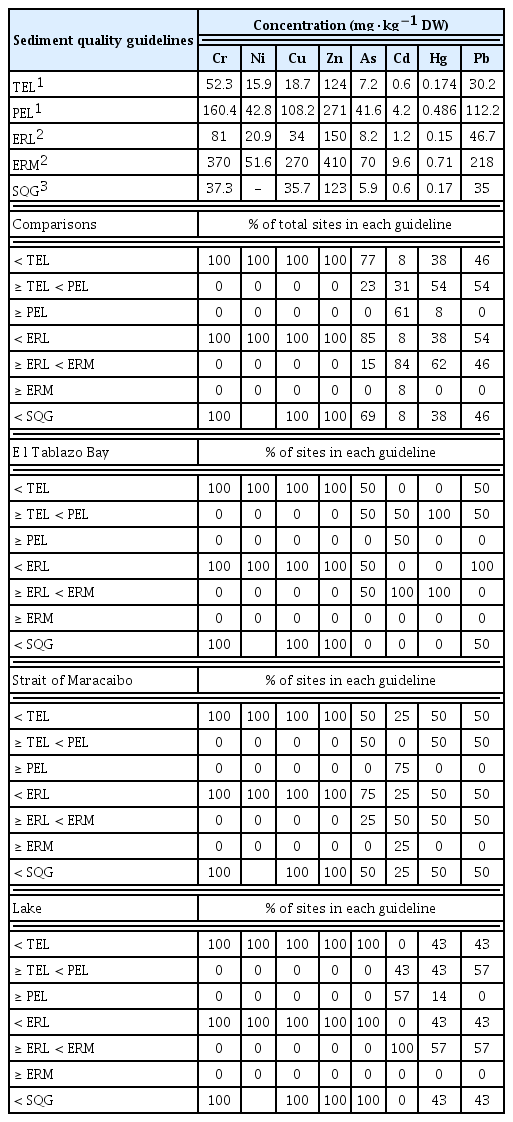
Comparison Between Elemental Concentrations in Surface Sediments of Lake Maracaibo and Sediment Quality Guidelines with Percentage of Samples in Each One
In El Tablazo Bay, the levels of As, Cd, Hg and Pb in 50 (SC), 50 (PR), 100 (SC and PR) and 50% (SC) of the sampling sites may occasionally be associated with toxic effects on biota (≥ TEL and < PEL), which may occasionally occur in 50 (SC), 100 (SC and PR), 100 (SC and PR) and 0% of the sites (≥ ERL and < ERM), respectively. 50% of the sites (SC) presented a Cd concentration (≥ PEL) that is frequently associated with adverse effects (Table 2). In the Strait of Maracaibo the values of As, Cd, Hg and Pb in 50 (D-2 and D-4), 0,50 (D-2 and D-5A) and 50% (D-2 and D-4) of the sites may occasionally be associated with toxic effects on biota (≥ TEL and < PEL), while in 25 (D-2), 50 (D-4 and NO-2), 50 (D-2 and D-5A) and 50% (D-2 and D-4) could occasionally occur (≥ ERL and < ERM), respectively. In 75 (D-2, D-4 and NO-2) and 25% (D-2) of the sites Cd concentrations are frequently associated with adverse biological effects (≥ PEL) and can occur frequently (≥ ERM), respectively. In the lake area, Cd, Hg and Pb in 43 (C-9, C-11 and CA-2), 43 (C-1, C-9 and C-11) and 57% (O-20, C-9, C-11 and D-33) of the sites may occasionally be associated with ecotoxicological effects (≥ TEL and < PEL), and in 100 (O-13, O-20, C-1, C-9, C-11, CA-2 and D-33), 57 (C-1, C-9, C-11 and CA-2) and 57% (O-20, C-9, C-11 and D-33) these effects may occasionally occur (≥ ERL and < ERM). The Cd concentrations in 57% of the sites (O-13, O-20, C-1 and D-33) are frequently associated with toxic effects on biota (≥ PEL).
On the other hand, none of the study sites in Lake Maracaibo exceeded the SQGs for Cr, Cu and Zn (Table 2). Regarding As, Pb and Hg concentrations 69, 46 and 38% of the sites exhibited values lower than the corresponding guideline [48], while 92% of the Cd concentrations exceeded the SQG. El Tablazo Bay was characterized by high As, Cd and Hg levels, where all sites exceeded the respective SQGs, as well as 50% for Pb (SC). In the Strait of Maracaibo, As, Cd, Hg and Pb exceeded the SQGs in 50 (D-2 and D-4), 75 (D-2, D-4 and NO-2), 50 (D-2 and D-5A) and 50% (D-2 and D-4) of the sites, respectively. In the lake area, 57% of the sites presented concentrations of Hg (C1, C-9, C-11 and CA-2) and Pb (O-20, C-9, C-11 and D-33) that exceed the corresponding SQGs.
The implications of PTE levels in Lake Maracaibo sediments exceeding established ecotoxicological guidelines (Table 2) are diverse and can affect entire communities. Thus, the Cd concentrations in numerous sampling sites were ≥ PEL, being frequently associated with ecotoxicological effects that can occur frequently (> ERM), since they exceed the SQG that establishes concentrations of PTE for the protection of aquatic life [48]. Hg and Pb were also found at levels that may occasionally be associated with adverse effects (≥ TEL and < PEL), which may occasionally occur (≥ ERL and < ERM), due to the fact that they exceed the SQG for the protection of aquatic life. In the El Tablazo Bay area, Hg showed potential risk on aquatic biota, in accordance with that reported by de Bautista et al. [19], while in the Strait of Maracaibo and the lake area it corresponded to Cd.
The m-ERM-Q values for PTE in surface sediments of Lake Maracaibo were between 0.05 (D-5A) and 0.27 (D-2); the maximum magnitudes were found in D-2 (0.27), D-33 (0.22), O-20 (0.18) and CA-2 (0.18), mainly influenced by the Ci/ERMi ratios of Cd (1.04)–Hg (0.40), Cd (0.55)–Pb (0.50), Cd (0.48)–Pb (0.39) and Hg (0.73)–Cd (0.40), respectively. In El Tablazo Bay, the m-ERM-Q value was 0.19 due to the majority contribution of Cd = Hg. In the Strait of Maracaibo was 0.15 resulting of the main contribution of Cd, and in the lake of 0.16 by the Cd and Hg levels (Table S1). In general, the elemental contribution to the m-ERM-Q guideline was Cd > Hg > Pb > Ni > Zn > As > Cr > Cu.
According to the sediment classes for m-ERM-Q (Table S2), 92.3% of the sites sampled in Lake Maracaibo are class 2 probability of low-medium toxicity (21%) for the biota and 7.7% (D-5A) class 1 low probability (9%) [4, 51], with the following proportion: El Tablazo Bay > lake > Strait of Maracaibo, which would establish a general level of probability low-medium (21%) toxicity for the biota of Lake Maracaibo. Thus, the greatest potential for ecological risk was for Cd, Hg and Pb, which corresponds with the results of TEL/PEL [49], ERL/ERM [50] and SQGs [48] biotoxic sediment guidelines. Tokatli [61] reported m-ERM-Q values from 0.078 to 0.406 for sediments from Gala Lake (Turkey) including As, Cr, Cu, Pb, Zn, Cd and Ni (higher contribution of Cr, Ni and Zn), while Fuentes-Hernández et al. [62] presented levels between 0.13 and 0.30 with Zn, Cd, Cr, Cu, Ni and Pb (higher contribution of Cd and Ni) for sediments from the Gulf of Cariaco (Venezuela). These data are comparable to those found in Lake Maracaibo (greater contribution of Cd, Hg and Pb (Table S1), establishing a probability of multielemental toxicity of 21%, with low-medium repercussions on the biological communities of this water body.
In Fig. 6, RACs calculated for PTE in sediments from Lake Maracaibo are presented, which showed the following behaviors: i) El Tablazo Bay: low risk (RAC values 1–10) for As, Pb, V and Hg, representing 80.0% of studied elements, and very high risk (RAC values > 50) for Se (20.0%). The values were Se > As > Hg > Pb > V; ii) Strait of Maracaibo: low risk (RAC values 1–10) for Pb, V and Hg (60.0%), and medium risk (RAC values 11–30) for Se and As (40.0%). The values were As > Se > Pb > Hg > V; and iii) lake: no risk (RAC values < 1) for Hg and V (40.0%), low risk (RAC values 1–10) for Pb (20.0%), and medium risk (RAC values 11–30) for As and Se (40.0%). The values were As > Se > Pb > V > Hg. The RAC levels for Se differed significantly (P < 0.01) between these three areas of due to their concentrations in the sediment’s exchangeable fraction. In general, the potential for mobility and bioavailability of PTE in sediments [53] was: Se >As > Pb > Hg > V > Sn. Thus, the risk factor for these magnitudes is medium for Se and As, low for Pb, Hg and V, and without risk for Sn.

Risk assessment code (RAC) of potentially toxic elements in surface sediments of Lake Maracaibo. The horizontal segmented lines represent the RAC values of 11, 31 y > 50% (medium, high y very high risks of mobility and effect on biota, respectively). The Sn concentrations were not detected in exchangeable, carbonate and soluble fractions (detection limit: 0.025 mg·kg−1 DW).
The RACs found the surface sediments of Lake Maracaibo represent a very high risk level of mobility and effect on the biota (Fig. 6), specifically of Se in PR (El Tablazo Bay) and of As in D-5A (Strait of Maracaibo), as a consequence of the high proportion of these elements in the exchangeable fraction in relation to the total concentration (Fig. 2), whose origin may be related to specific sources of contamination and biogeochemical processes in the surface sediments [2, 58]. Point and diffuse sources of contamination that can be identified at the sampling sites include: i) El Tablazo Bay (SC and PR): transportation of mineral coal, exploitation of minerals, oil transportation and discharge of tributary rivers; ii) Strait of Maracaibo (D-2, D-4, D-5A and NO-2): discharge of untreated domestic and industrial wastewaters, oil transportation, dredging of the navigation channel and activities of the petrochemical complex; and iii) lake area (O-13, O-20, C-1, C-11, C-9, CA-2 and D-33): exploitation, production and transportation of oil, discharge of tributary rivers and surface runoff from agricultural fields. The RAC values are much higher than those reported by Delgado et al. [64] for the Guadiana estuary, Spain (Table S1), and correspond to observed with the SQG, where 50% of concentrations in sampling sites of the strait (Table 2) exceeded the maximum value established for protection of aquatic life [48], while 50 and 25% of these concentrations may occasionally be associated with adverse effects (≥ TEL and < PEL), and could occasionally occur (≥ ERL and < ERM), respectively. Furthermore, As and Se were identified as elements with a high degree of anthropogenic enrichment (EF) and a considerable level of contamination (CD and Igeo).
Finally, the methodology applied in this work allowed to explain the potential ecological risks associated with PTE in surface sediments of three areas of Lake Maracaibo and its possible impact on the native biota. However, the estimation of anthropogenic elemental enrichment levels revealed the need to have accurate data on the background concentrations in the study area, strategic location of sampling sites, homogeneity of samples, descriptive information on point sources of contamination, reference concentrations for PTEs, among other aspects. Likewise, the use of Fe as a normalizing element showed a possible overestimation of these levels associated with the type and composition of the sediment in some sampling sites.
4. Conclusions
The multi-guidelines approach allowed estimating the enrichment level and ecological risk of PTE in surface sediments of the Lake Maracaibo, identifying the possible sources of origin and interactions between these elements. Five PTE were recognized as those with the highest potential ecological risk into lake: As, Cd, Pb, Hg and Se, standing out as the most critical As, Se and Hg in the El Tablazo Bay, Cd and As in the Strait of Maracaibo, and Pb, Cd and As in the lake area. A very high-risk level of mobility and effect on aquatic biota was detected, specifically Se in the bay area, while Se and As showed a medium risk in the strait and the lake area. All this represents a latent toxicity hazard for native biological communities and a possible biomagnification route of these elements to human being, through consumption of contaminated aquatic species. Indications were also observed about the influence of type and sediment composition in the calculations of the elemental enrichment factor, revealing itself as a possible point of overestimation of the enrichment values associated with the use of Fe as a normalizing element.
Supplementary Information
Acknowledgments
The authors wish to express our thanks to Dr. Adelso Yánez (University of Otago, NZ) and Dr. María Carolina Pire (Universidad Centroccidental Lisandro Alvarado, Venezuela) for their revisions of the English grammar.
Notes
Authors Contributions
J.M. (Professor) drafted and wrote the manuscript, interpreted and evaluated the results. M.C. (Professor) performed the PTE analysis, reported the results and contributed to the draft initial preparation of this paper. H.L. (Professor) conducted statistical analysis and contributed to the draft initial preparation of this paper. P.H.E.G. (Professor) contributed to the draft initial preparation of this paper.