Contribution of low impact development practices-bioretention systems towards urban flood resilience: case study of Novi Sad, Serbia
Article information

Abstract
Bioretention systems are globally the most accepted Low Impact Development (LID) practices. In this study, we simulated bioretention performances for four locations in the city of Novi Sad, with RECARGA modelling software. The primary objective of the research was to evaluate potential of bioretention systems for runoff reduction. The second research objective was to suggest RECARGA model as a support for future decision-making processes. Analysis of the sensitivity of bioretention design parameters on bioretention performances, involved variations related to different sizes of bioretention systems, application of an underdrain, the difference in soil texture and changes in the depth of each individual bioretention layer. The total average volume of retained runoff by bioretention systems ranged from 43.33 to 93.84%, while some single simulation results were 100%. Among all tested design parameters, bioretention size and the native soil hydraulic conductivity have shown the greatest influence on the runoff reduction rate. This study provides information about the developing a site-specific bioretention solutions needed to prevent urban flooding in the area of research where this systems are still not sufficiently applied in practice. The obtained methodology can be applied for other locations and also it can be extended to other cities with similar urban flooding problems.
1. Introduction
Due to climate change and increased urbanization, urban areas are facing many environmental problems like flooding and pollution. Compared to non-urban areas, annual flooding exposure is estimated to be up to three times higher in urbanized places [1]. Low Impact Development (LID) is a sustainable approach in stormwater management and urban planning that aims to mitigate the negative effects of increasing urbanization and impervious surfaces [2]. LID refers to practices and principles focusing on specific sustainable water conservation goals that include runoff reduction (peak and volume), groundwater recharge, stream protection, increasing infiltration and water quality assessment [3, 4]. LID designs attempt to replicate pre-development hydrologic conditions as closely as possible, in order to achieve a site’s balance of pre-development runoff, infiltration, and evapotranspiration volumes [5, 6]. One of the widely accepted LID control measures are bioretention systems, i.e. rain gardens or bioretention swales [7]. Bioretention systems are showing high quality performances in managing stormwater runoff, through many laboratory and field analysis, like to retain large volumes of runoff and pollutants on site, improvement of the quality of surface water, reduction in concentrations of certain pollutants and improvement in biodiversity [2, 7–9]. Bioretention systems involve retention, filtration and infiltration of stormwater, use chemical, biological and physical properties of plants and soil, depending on the natural cleansing processes that exist in the soil/mulch/plant community [10]. These systems are designed as shallow areas planted with vegetation on in situ or an engineered soil mix, to collect, store, filter, and treat runoff from impermeable surfaces [5, 11].
According to Burciaga [12], climate change indicators can be divided into environmental, economic, social and cultural. Among these factors, the construction sector is also responsible for environmental problems such as water and air pollution. The current environmental indicators in the city of Novi Sad, Serbia, can be described by an increase in population, increase in density of construction and reduction of green spaces. During recent decades, hydrographic and climatic conditions have been changed significantly. Short-term rains of strong intensity are becoming more frequent while the total annual rainfall intensity reached its maximum of over 1,000 mm of precipitation per year, which is almost double from the multi-year average [13]. In addition to indicating urban growth and development, the city is dealing with urban flooding and pollution. During precipitation of higher intensity, water outflows from storm drains over the road surface, as well as entering of the buildings’ basements and basement apartments. This problem is present within all city’s catchment areas. The negative consequences of the flooding reflect as material damage, but above all in the reduced safety for pedestrians and traffic.
In the past few years, with growing concerns about the problems stated above, considerable attention is pointing on alternative ways for sustainable management of stormwater runoff in Serbia. Bioretention systems are increasingly being investigated and often discussed in research papers as a desirable model for urban flood resilience. Previous research studies conducted by the authors have been focused on the analysis of existing pollutants in soil, stormwater and wastewater in the city of Novi Sad [14–17]. Most analyses were performed at sites that were previously determined as most vulnerable to urban flooding, such as roads [17]. These studies highlighted the need for appropriate solutions for sustainable management of wastewater and stormwater in the city of Novi Sad, like bioretention systems. However, the issue of sustainable management of stormwater in Serbia is generally underdeveloped in practice. Since bioretention systems are a relatively new technology, there is a lack of practical examples of bioretention that can serve as a guideline for bioretention systems design and implementation, adjusting to site-specific local conditions. There are many issues relating to limitations and advantages of hydrological performances of bioretention systems like: How to proper size and design bioretention facilities to meet specific performance objectives, such as reducing runoff volume or increasing recharge for the area of research? How will infiltration capacity be affected by local soil conditions? Could bioretention systems be designed and implemented based on previous modelling results of hydrological performances? How will design parameters variations influence on overall bioretention systems performances?
While other studies [14–17] have considered the negative impacts of stormwater and wastewater in the city of Novi Sad, this paper deals with the above mentioned issues. The primary objective of this research is to evaluate the efficiency of bioretention practices and develop site-specific bioretention models for locations taken as case studies. The goal is to determine the proper bioretention design for peak flow control and water quality treatment. For area where this systems are still not sufficiently applied in practice, designing future bioretention facilities is very important. Some of the main considerations for the potential bioretention design and implementation like the current soil and climate conditions of the tested area will also be discussed.
The secondary objective of the study is to introduce RECARGA as an approach for future planning and design decisions, on a range of different bioretention scales for the stormwater management in Serbia. Modelling tools like RECARGA have been developed to help with design and understand the behaviour of different LID practices [18]. RECARGA is a model developed to simulate the performance of bioretention facilities, infiltration basins and rain gardens and it has been updated several times since the original version of the software [19]. We selected RECARGA model primarily because of its conceptual simplicity and the possibility to choose the desired design of bioretention systems like surface area, ponding depth, soil types, application of underdrains etc. RECARGA is a biretention/rain garden sizing program that helps users to select the best available models under user-specified precipitation and evaporation conditions. Results of simulations in RECARGA are summarized trough values about plant survivability terms and water balance terms that address the reduction of runoff volume and also indirectly indicating the improvement of the water quality [19].
This article is organized as follows: Section 1 provides a brief overview information on the current environmental problems in the area of research while the materials and methods are described in section 2. This section covers the basis of the applied methodological procedure and primary inputs for modelling with RECARGA for the area of research. Results of evaluation and comparison of the simulated hydrological performances of different bioretention scenarios are presented trough section 3. Section 4 discusses the obtained results of simulation and finally, section 5 gives a summary and conclusion of this paper.
2. Materials and Methods
2.1. Study Area
For evaluating performances of potential bioretention applications, we selected 4 study locations within the territory of the city of Novi Sad, Serbia (Fig. 1). This locations represent the city’s primary traffic network streets (location 1 and 4) and parking lots (locations 2 and 3). The city of Novi Sad which is located in the eastern part of Europe, in the Pannonian Plain in Serbia at latitude 45. 251, 67 and longitude 19. 836, 94, covers an area of 69,914 ha [20]. The current land use according to the city Master plan of Novi Sad for the 2021 year are public areas, individual and collective housing, agricultural, forestry and nature-related uses. Family housing occupies the predominant part of residential use in the amount of 62.4%. This is followed by general residential areas (approximately 19.5%) and multi-family housing with about 15% [20]. Due to the different forms of relief on the territory of the city, there are also differences in microclimatic characteristics. In general, Novi Sad has a temperate continental climate, characterised by high-temperature extremes during the year (cold winters and warm summers) and abrupt transitions between the colder and warmer half of the year [13].
A map with analysed locations.
2.1.1. Data about precipitation and current stormwater management
Available data about precipitation (Fig. S1) indicates that the highest values of average precipitation for the region of the city of Novi Sad are recorded in June, while the average monthly precipitation amounts are the highest for the month of May [13]. Data from previous years indicate that the maximum annual amount of precipitation at several major meteorological stations in Serbia has been exceeded, including the Novi Sad meteorological station. According to the annual bulletin of the Republic Hydrometeorological Institute of Serbia for 2013 year [13], the amount of precipitation was in the interval of 739.7 mm. Percentage of precipitation in relation to the normal (relative to 1961–1990) year was increased by 128 mm. The 2014 year can be also taken as an example of extremely heavy precipitation. The rainiest months were May with 108.8 mm of precipitation and September with 107.8 mm. This precipitation exceeded the average daily maximum amount of precipitation for May and September. These extreme intensity rainfall events were responsible for surface water flooding on the territory of Novi Sad.
On the territory of the city of Novi Sad, the drainage of stormwater takes place through a combined sewage network, that serves to drain wastewater from household, industry and stormwater. The catchment is divided into two city subcatchments, southern city subcatchment – the subcatchment of the pump station GC1 and northern city subcatchment – the subcatchment of the pump station GC2. The maximum capacity of the pump stations is 10.5 m3/s each [21]. The sewer system of the city was developed during the 1950s. It was designed for the drainage of wastewater and stormwater with 2-year storms [21]. The recipient of wastewater and stormwater is the river Danube, which represents the natural resource of the city. It is important to emphasize that all wastewater discharges into the Danube River without any prior treatment. Pollution of the Danube River in the city of Novi Sad could influence on chemical and ecotoxicological status in the downstream part of the Danube in Serbia, Romania and Bulgaria [14]. Analysis of measured parameters of wastewater samples from one of the most burdened wastewater collector, GC2 in the city of Novi Sad, that have the highest impact on the urban environment pollution during the period of 2013–2014 year have shown that some parameters exceeded required emission limit values 3 to 16 times: 5-d Biochemical oxygen demand (BOD5), Chemical Oxygen Demand (COD), Total Suspended Solids (TSS), Total Phosphorus (TP) and Total nitrogen (TN) [14]. According to the study conducted by Greksa et al. [16] some locations of the area of research are also detected with high concentration of heavy metals in soil. The metal with the highest concentration in the soil was zinc, while lead concentration was the highest in the city centre. Results from the study taken by Greksa et al [15] pointed out that in stormwater runoff samples taken from urban roads in the city of Novi Sad, the heavy metal with the highest measured concentration was zinc. The mean value of 0.58 mg/L for zinc concentrations exceeded the limit of quantification (LOQ). Zinc in stormwater can cause the quality of receiving water bodies, harm fish and other aquatic organisms [11, 22].
2.2. RECARGA Model Description and Capabilities
RECARGA v. 2.3 software is one of the computational quantity models that are commonly used to help on development, evaluation and selection of optimal LID tools, like infiltration and bioretention practices. This hydrologic model evaluates the efficiency of a single stormwater management practices and develops site-specific model with hydrologic criteria with primary design elements of bioretention systems like surface area, total ponding time and the number of overflows [18, 19]. In RECARGA, different layers of soil represent a single bioretention system. The upper layer (root zone), the middle layer (the storage zone) i.e. high conductivity layer that transmits infiltrated water rapidly and provides water storage; and the lower layer that represents the urban subsoil [24]. The RECARGA model uses a graphical user interface to allow users to easily change design values without modifying the actual code contained within the program [23].
RECARGA continuously simulates the movement of water throughout the facility (ponding zone, soil layers and underdrains), records the soil moisture and volume of water in each water budget term (infiltration, recharge, overflow, underdrain flow, evapotranspiration, etc.) at each time step and summarizes the results [19]. This software uses the Green-Ampt infiltration model for initial infiltration into the soil surface and the Van Genuchten relationship for drainage between soil layers, while the surface inflow to the facility from impervious surfaces is calculated using a simple initial abstraction. For pervious surfaces, surface inflow is calculated using the SCS TR-55 methodology, based on user-supplied curve numbers. Underdrain flow is calculated using the orifice equation [19].
Modelling of bioretention systems with RECARGA includes the following inputs of primary bioretention system design components before running the simulations: bioretention area, ponding zone, root zone and storage zone thickness, hydraulic conductivity of limiting layer (native soil layer), underdrain flow rate, tributary area, curve number for contributing pervious area, and percentage of contributing area that is impervious. Parameters for modelling also include data about evapotranspiration, rainfall depths and native soil texture. Some of the input parameters for modelling in RECARGA are pre-defined. These inputs refer to the soil texture of the rooting zone and storage zone (the default values are loamy sand and sand). RECARGA also determines the necessary underdrain flow and the required diameter of the underdrain for bioretention models that include underdrain system. RECARGA gives a possibility to choose three simulation types: continuous, runoff simulation that is used to simulate a continuous precipitation/evaporation input file using the model’s tributary runoff methods (SCS curve number method for pervious areas and initial abstraction for impervious areas); single-event, the simulation used to calculate the runoff from a single storm event or user input, option that may be used to bypass the model’s runoff calculation with a user input file of hourly runon (depth) to the facility obtained from another model [23].
2.3. Input Data of Bioretention Modelling for the Analysed Locations
Before running the simulations, we collected data about meteorological and hydrological factors that impair the relationship between rainfall and runoff like rainfall frequency and intensity, current soil type, average evapotranspiration and land use with a runoff curve number (CN) for four study locations. We also analysed data about flow values of the Danube river from one of the hydrological stations, Bezdan, for the period of 2012–2019 year [13]. The flow data from this station most closely correspond to the Novi Sad city hydrograph (Fig. S2). To compute the ratio of pervious and impervious surfaces for individual location, we assume the data from Google maps and available urban plans of Novi Sad. The first criteria for their selection was that they belong to the parts of the city of Novi Sad with high percentages of impervious surfaces and that they are having a problem with urban floods after heavy rains.
The importance of estimation of extreme flood probabilities is highlighted within many scientific papers [26, 27]. Flood episodes are usually thoroughly characterized by flood peak discharge flow, volume and duration series and there is a strong positive correlation between peak and runoff volume [26]. In order to evaluate the runoff reduction under a heavy precipitation event, we performed simulations for the “single event” option which involves entering the 24-h rainfall depth for the simulation. Rains lasting up to 24-h are considered to be the main cause of catastrophic floods in natural river basins as well as in urban areas [27]. We singled out one of the highest recorded 24-h storm events from the period of the 1967–2019 year (122 mm), obtained from the nearest Hydrometeorological station, Rimski Sancevi [13]. We also investigated data about 24-h rainfall depths associated with three different return period ie. flood frequency. Respectively, 24-h rainfall depth for the 2-year return period, 24-h rainfall depth for the 10-year return period and 24-h rainfall depth for the 100-year storm for the territory of Novi Sad given by Prohaska et al. [27]. The providen precipitation data show that 17 recorded 24-h storm events are higher than 40 mm/d [13]. The intensity of rainfall for the 2-year return period is 40.33 mm, for the 10-year return period 69.80 mm, while the intensity of rainfall for the 100-year storm is 106.7 mm [27]. For the purpose of modelling in RECARGA, all rainfall depths are converted from mm to cm. Data about precipitation and some of the highest recorded 24-h rainfall are presented in Fig. S1.
Monthly and annual evapotranspiration reports for the city of Novi Sad, point out that the average evapotranspiration is considerably higher in May relative to other months [13]. According to this reports, we calculated the required average hourly evapotranspiration in RECARGA (113.8 mm/31/24 h = 0.01529569 cm/h).
How simulation in RECARGA requires the entering of native soil texture, the soil samples were taken from analysed locations. The ratio of the particle size distribution (percentage of sand, silt and clay) was determined according to the USDA soil textural triangle classification [28]. Based on this analysis, the native soil texture belonging to the analysed locations are determined as loam (soil sample from location 1 had 48% clay, 21% sand and 31% silt, while soil sample from location 3 had 53% clay, 8% sand and 39% silt) and sandy loam (soil sample from location 2 had 18% clay, 69% sand and 13% silt, while soil sample from location 4 had 16% clay, 71% sand and 13% silt). By entering the native soil texture, RECARGA automatically estimates the saturated hydraulic conductivity (Ksat) for every single bioretention layer. Detailed view of all input parameters for modelling is given in Table 1.
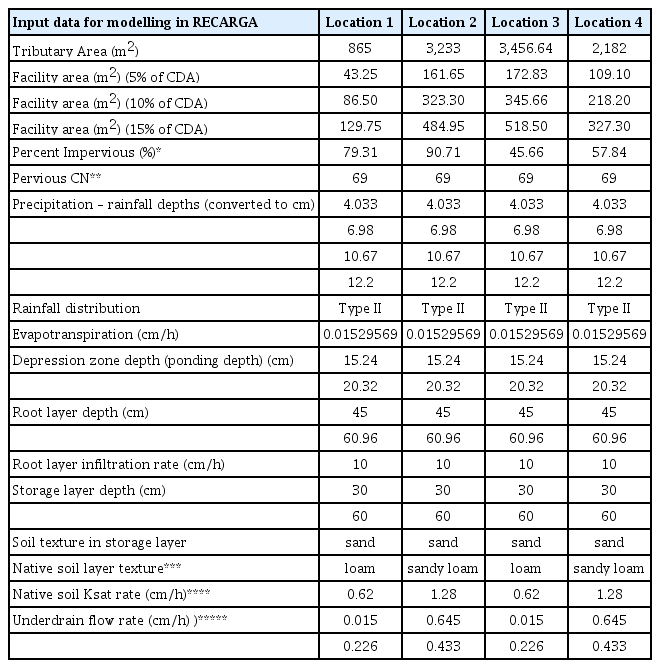
Parameters Inputs for Hydrological Modelling of Bioretention Systems in RECARGA
2.3.1. Modelling scenarios and tested design parameters
Although bioretention design may vary, some of the primary design components of bioretention systems, include a shallow depression containing plants, root zone, a native soil layer with a high infiltration capacity and some additional components like storage zone and underdrain [5, 11]. In terms of that, the design typology of bioretention systems includes bioinfiltration and biofiltration practices with the differences reflected in the application of underdrain system [11]. Reduction of runoff trough bioinfiltration systems occurs primarily through infiltration process, which allows stormwater to naturally infiltrate into the native soil. On the other hand, biofiltration systems, include an underdrain system for partial infiltration that will collect some of the infiltrated water and drain it through the drainage system [11].
Relevant studies that investigated hydrological performances of bioretention trough RECARGA modelling, documented the impact of the bioretention size, native soil texture and the application of an underdrain as design parameters on the overall hydrological performances [29–31] but the sensitivity of single bioretention media layer depths have not been evaluated yet. Herein, simulations are done for a variety of bioretention parameters, including bioretention size, drainage area, soil layer depths and soil texture. In terms of that, key parameter(s) that were tested are: a) soil texture and hydraulic conductivity of native soils; b) bioretention facility area; c) thickness of ponding zone; d) thickness of root zone; e) application of an underdrain; and f) thickness and the application of the storage zone. The aim of this analysis was to investigate the influence of the variability of these parameters on the overall hydrological performance of bioretention systems.
Modelling of bioretention performances for each location included a total of 8 different scenarios, that is, eight different bioretention design schemes for two bioretention models: scenarios SC1–SC4 for bioretention model 1 (type without an underdrain) and scenarios SC5–SC8 for bioretention model 2 (enhanced bioretention model, i.e. model with an underdrain and a storage sand layer). Variations of simulations for both models included changes in RECARGA inputs for root zone thickness (RZ), changes in ponding zone depth (PZ) and changes in storage zone that is, sand layer depth below the root zone (SL). The sizes of bioretention systems, ie. the area of the bioretention system was determined relative to the total contributing drainage area (further in the text CDA) by values of 5%, 10% and 15%. For bioretention model 1, scenario 4 (SC4) included a sand layer of 30 cm below the root zone, while scenarios SC1–SC3 included only variations of ponding zone depth and root zone depth. In RECARGA, the default and recommended thickness of the root zone is 60.96 cm. We used this value for enhanced model, while for the thickness of the root zone for scenario 1, we reduced this value to 45 cm.
Ponding area provides surface storage of stormwater runoff before it filters through the soil bed and allows for evaporation of ponded water as well as for settling of sediment in the runoff [23]. Concern in determining depth of ponding zone is related to safety, aesthetics, drain times and plant survival. Current recommendations about ponding depth suggest that the ponding depth should range between 15.24 cm to 30.48 cm [32]. In this analysis, we used the ponding depth of 15.24 cm and 20.32 cm.
Model 2 simulation parameters also included an underdrain and the varying depth of storage zone in the amount of 30 cm and 60 cm. According to Prince George’s County [10] the addition of sand improves the overall performance of those systems since sand is known as a material with a very high hydraulic capacity. Adding sand in bioretention design also provides excellent stormwater treatment by filtering pollutants.
All obtained simulation results were then analysed and compared. Fig. 2 illustrates different variations of simulated scenarios for analysed locations.

Scheme of design components of bioretention systems with variations in simulated scenarios. (a) Bioretention model 1 (bioinfiltration type without an underdrain), characterized by a depression zone (ponding zone), a loamy sand root zone and a native soil layer with loam or sandy loam texture. Scenario 4 also includes the addition of a storage zone (sand layer). The total depth of the bioretention system ranges from 60.24 cm to 111 cm; (b) Bioretention model 2– enhanced bioretention model with an underdrain characterized by a depression zone (ponding zone), a loamy sand root zone, a storage zone (sand layer), an underdrain and a native soil layer with loam or sandy loam texture. The total depth of the bioretention media ranges from 90.24 cm to 141 cm. Not in scale.
3. Results of Runned Simulations
Results of simulations in RECARGA are summarized in Tables S1–S4 and they vary per different 24-h storm event, per location and according to the size of bioretenion systems and simulated scenarios. We estimated the following results taking in consideration relevant terms that contribute to the water volume reduction in bioretention systems like groundwater recharge, ponding time, stay-on values, evapotranspiration and the overflow ratio. All results are reported in terms of percentage (%). (Fig. 3)
Average values of water balance and plant survivability results per location and per rainfall depth for all simulated scenarios.
3.1. Simulated Results about Water Balance Terms (stay-on, groundwater recharge, ET)
Stay-on volume represents the volume of water that is captured by a bioretention system and the volume of precipitation that is retained on the developed site tributary to the bioretention system [23]. The lowest average stay-on values for different 24-h rainfall events are obtained for the location marked as 2, while the highest average stay-on value is obtained for location marked as 4. These results refer to single simulations per different 24-h storm events as well as overall average results about water balance terms. Also, 100% of runoff captured by bioretention system is calculated for location marked as 4, for a 24-h, 2-year storm event for different bioretention models and sizes. Simulated hydrological performances for other 24-h rainfall events are also in a range of high, respectively results for a 24-h, 10-year storm event and a 24-h, 100-year storm event for larger bioretention models point out that the highest calculated runoff reduction amounts 96.61% and 100%. Location marked as 3, also shows significantly higher average stay-on results for larger sized bioretention systems. For models sized as 10% and 15% of the CDA, RECARGA gives a 100% of the total depth of water retained on the site for a 24-h, 2-year storm and a 24 h, 10-year storm event. It can be also noted that although in some locations, average runoff reduction results are low, some individual high performances of bioretention can be singled out. For an example, average results of stay-on values for all runned simulations per location 1, range from 44.83 to 74.56%. On the contrary, percentage of stay-on from a 24-h, 2-year storm, amounts 100% for models sized as 10% and 15% of the CDA. Still, the results for this location indicate the lowest overall hydrological performances according to other locations.
The average groundwater recharge ratio for all simulated scenarios ranges from 25.34 to 80.13%. The highest recharge values per location are calculated for location 4 (for some scenarios they are > 100%) whereas the recharge values for locations 1 and 3 indicate a lower recharge percentage. As can be noted, high results of groundwater recharge are in a correlation with high stay-on volumes and vice versa. Improvement of recharge ratio increases with the increasment of bioretention size, while higher 24-h rainfall depths relate to decreased groundwater recharge amounts.
The average evapotranspiration (ET) results vary between 0.02% and 0.05% for all simulated scenarios. The rate of ET is shown to be mostly dependent on rainfall depths, respectively, higher 24-h rainfall depths result in a higher percentage of runoff volume reduction through ET processes. The highest ET rates are calculated for a 24-h, 2-year storm event, whereas the 12.2 cm rainfall depth point out to decreased values of ET. The size of bioretention also had an influence on simulated ET rates. For larger sized models, the range of ET values significantly increased. On average, the highest values of ET are calculated for location 4.
3.2. Simulated Results about Plant Survivability Terms (ponding time, overflows)
Results about the maximum and total ponding time, respectively, the time required to drain the surface of the bioretention system after different 24 h storm event, is in the range from 0 h to 52 h. Maximum ponding duration in the amount of 52 h is calculated for location 1, during the rainfall event depth of 12.2 cm. The highest average ponding duration is also calculated for location 1, opposite to location 4, which indicate the shortest time of ponding. For this location, RECARGA assumes that there will be no ponding or overflows for a 24-h, 2-year storm event for both runned bioretention models and for bioretention system sized as 10% and 15% of the CDA. Therefore, simulations indicate good infiltration potential of bioretention system application, meaning that all the runoff from the impervious area from a 24-h, 2-year storm event will infiltrate into the bioretention system for less than 24 h (stay-on simulation parameter is equal 100%).
An underdrain is a perforated pipe below the root zone that drains water when the facility becomes saturated [23]. For scenarios with an underdrain, simulation in RECARGA show decreased ponding time relative to bioretention systems without an underdrain. Average values of ponding time reduction with underdrains relative to models without an underdrain is amounting 2.5 h to 6.95 h. Underdrains increase the volume of water that can be captured and filtered through the root zone of bioretention facility, reduce the retention (or stay-on) and recharge capacity of the facility [23]. On average, location 3 is defined by the highest changes in ponding time for different runned simulations.
The number of times during the simulations at which the bioretention facilities overflowed are mostly affected by the rainfall depth and vary under different simulated scenarios. Overflow represents the volume of runoff that is not treated, respectively the runoff that bypasses the bioretention systems [4]. Location marked as 1, shows 1 overflow during every simulated scenario. For other locations, frequency of overflows is linked with higher rainfall depths, i.e. with a 24-h, 10-year storm event and a 24-h, 100-year storm event. For 12.2 cm rainfall depth, all simulations indicate 1 overflow for location marked as 4 only when the size of bioretention is 5% of the CDA, while for larger sized bioretention systems RECARGA don’t indicate overflows during any simulated scenario. A sum of total calculated overflows gives a number of 71 overflows for location marked as 1, 25 overflows for location marked as 2 and a total of 53 overflows for location marked as 3, while this number for location 4 amounts only 5.
3.3. The Influence of the Variability of Bioretention Design Parameters on the Hydrological Performance Results
Simulation results demonstrated significant variations within tested design parameters.
The first variation in design parameter of bioretention systems was the difference in thickness of the root zone. For simulations that were performed for scenarios SC2–SC4 and SC6–SC8 with the depth of the root zone of 60.96 cm, results have shown improved performances in terms of stay-on results relative to scenarios with a reduced root zone of 45 cm depth (SC1 and SC5) for all locations. Nevertheless, compared to other tested variations within bioretention design parameters, the increasment of root zone depth don’t show significant results of overall percent of stay-on, recharge and ET.
An increase of ponding depth for scenarios SC3, SC4 and SC8 increased the percentage of stay-on volume in bioretention systems and also increased the drainage time simulation results. Unlike simulation for scenarios with 15.24 cm ponding depth (SC1, SC2, SC5 and SC7) indicated shorter ponding time duration. For example, for location marked as 3, ponding time decreased for 8.25 h relative to model with smaller ponding depth. These results refer to simulations for bioretention model 1, that is bioinfiltration model sized as 5% of the CDA. For other locations reductions in ponding times are in a range from only 0.25 h to 4.5 h.
Considerably high bioretention performances are obtained for all scenarios with an added sand storage layer. Including this zone in the bioretention model without an underdrain (in scenario SC4) points out the best hydrologic performances results relative to other scenarios (SC1–SC3) per single location and per every 24-h storm event. Relative to the native soil saturated hydraulic conductivity (Ksat) on analysed locations, adding this layer also implies a higher duration of ponding time. Exceptions are obtained for locations with sandy loam native soil layer (locations 2 and 4). All scenarios for simulations of bioretention model 2 (with an underdrain), included the sand storage layer of 30 cm (SC4–SC8). Variations in simulations are reflected in the extended thickness of the layer (60 cm relative to 30 cm). Adding some additional thickness to this zone (60 cm relative to 30 cm) in scenarios SC7 and SC8 improved the overall performances of bioretention. In a scenario where this zone is combined with increased ponding depth (SC8), the duration of ponding time also increased. Comparation between hydrological performances results for simulated scenarios (stay on, recharge, ET and ponding time) is presented in Fig. 4.

Comparation between hydrological performances results (stay on, recharge, ET and ponding time) for (a) SC1 and SC2, (b) SC3 and SC4, (c) SC5 and SC6 and (d) SC7 and SC8.
3.3.1. The impact of different bioreteniton size and an underdrain on hydrological performances results
The area (size) of bioretention has shown to have a great impact on the total storage volume in the facility and the volume of infiltration and evapotranspiration. Larger bioretention models (15% of the CDA) showed better hydrological performances like decrease of ponding time depth and high stay-on, ET and recharge values for all scenarios, relative to smaller sized models. For example, the average increase of recharge volumes for all scenarios and bioretention systems sized as 15% of the CDA relative to 5%, amounts from 112.53% for location marked as 3, 140.14% for location marked as 1 and 134.34% for location marked as 2. The average increase of stay-on values are also higher for bioretention systems sized as 15% of the CDA relative to 5% of the CDA. This ratio of stay-on increasment is the most noticeable for location marked as 2. For models sized as 15% of the CDA relative to 5% of the CDA, the percentage of stay-on enhances for 79.70% for bioinfiltration models. The highest calculated differences which refer to a larger bioretention systems (15% of the CDA relative to 5% of the CDA) are obtained for ET values. This values are approximately higher than 300% for locations marked as 1 and 3 (Table S5)
The total average percentage of stay-on per location for all simulated scenarios when bioretention system is 5% of CDA is in the following order: L2 (43.44%) < L1 (44.83%) < L3 (70.06%) < L4 (73.85%). Enlargement of bioretention size (10% of CDA) points to higher average stay-on values: L2 (61.39%) < L1 (63.67%) < L3 (80.97%) < L4 (88.14%). For the largest facility, i.e. sized as 15% of CDA these average stay-on results are in ascending order: L1 (74.56%) < L2 (72.50%) < L3 (88.54%) < L4 (93.84%).
Comparation between hydrological performance results (stay on, recharge, ET and ponding time) for bioretention models without an underdrain relative to bioretention models with an underdrain, and the impact of bioretention size on overall simulated results.
4. Discussion
Findings based on simulation results show that bioretention systems reduced runoff at analysed locations. RECARGA gives a total average runoff reduction volume by bioretention systems in the range from 43.33 to 93.84% for all simulated scenarios. Relative to runoff depths, the highest infiltration capacity is obtained for the 2-year, 24-h, storm (4.033 cm) while the lowest is for the rainfall depth of 12.2 cm. In the study conducted by Hunt et al. [9], the peak outflow of the bioretention cell in urban setting for 16 storms with less than 42 mm of rainfall was at least 96.5%. These results indicate better hydrological performances of bioretention systems for rainfall events that are characterised by low rainfall depth. According to Davis et al. [7] bioretention should be used as a source control for small drainage areas, with a maximum recommended drainage area to one bioretention system approximately 0.8 hectares (8,000 m2). As stated by the authors [7], larger CDA can generate higher runoff volumes into a bioretention system. Larger CDA will therefore, require larger bioretention system. For simulated scenarios in the present study, an extended time of ponding and overflows are followed with the native soil layer of low Ksat. This can be noted in the example of location 1, which has the smallest CDA, but shows low hydrological performances due to the texture of limiting layer below a bioretention system. In comparison to the location 1, the total CDA for location 4 is much larger and still simulated results for this location are very high, due to the higher infiltration rate of native soil below. A study conducted by Boancă et al. [30] also pointed that soil texture was one of the main variables that influenced performances of the simulated bioretention cell that is, hydraulic conductivity had a large effect on the duration of flooding. Other studies done by Gao et al. [31] and Roy-Poirier et al. [29] also demonstrated that the saturated infiltration rates of planting soil and native soil were the main factors influencing water balance results. The Ksat of the limiting layer below a bioretention facility is, therefore, an important factor affecting feasibility, design, and performance of bioretention.
Rawls et al. [33] provided a table of saturated hydraulic conductivity of soil based on soil texture. According to the saturated hydraulic conductivity (Ksat) for soil textures belonging to the analysed locations 1 and 3 (loam), this data provided by Rawls et al. [33] recommend the application of an underdrain as one of the design components of bioretention systems. In terms of that, in situ soil infiltration as the primary mechanism of volume control for locations 1 and 3 is not suggested for potential implementation. On the contrary, for locations 2 and 4 according to the soil texture, basic bioretention can be implemented i.e. models for infiltration and without an underdrain. Both locations are defined by soil texture of sandy loam, with high Ksat values (1.28 cm/h). By individual location, the location marked as 4 shows the best potential for implementing an infiltration-based bioretention system. According to the results of simulation, the risk of overflowing and clogging of bioretention system for this location only relates to the, 12.2, 24-h rainfall depth and the 5% sized bioretention system.
The duration of ponding time should be less than 24 hs after a storm event has ended, to ensure plant survival for maintaining the infiltration capacity [23]. Prolonged water retention time can lead to plant rot and erosion, and thus poor hydrological and aesthetic performance of the bioretention system [23]. If compared with the results of ponding time duration in the present study, analysed locations can be divided on locations with low level risk of bioretention failure and plant root degradation for locations 2 and 4 and high variability level risk of bioretention failure (locations 1 and 3).
Bioretention guidelines state that the size of bioretention area is dependant on the stormwater goals [3, 4, 10, 34]. From the water quality perspective, bioretention needs to be sized to capture and treat 90% of the average annual stormwater volume [3]. Likewise, bioretention practices are also sized to accommodate a specified design storm volume and treat the runoff from the “first flush”, respectively 25 mm of rainfall [4, 10]. Regarding to this statement, it can be concluded that the bioretention systems implemented in the area of research could accomplish the “first flush” stormwater requirements.
The addition of a sand storage layer improved the overall performances of simulated bioretention systems. Sand is known as a material that can exhibit very high hydraulic capacity [10]. Field investigation analysis pointed out that including sand in bioretenton media provides improved permeability and excellent treatment of stormwater by filtering particulate pollutants [35]. Although design specification standards about bioretention soil medium vary, recommendations are that they should be composed of a sandy soil mix. Soils with high percentage of clay or silt are not considered suitable for bioretention [10].
Evapotranspiration (ET) is the process by which water transpires from the leaves of plants and evaporates from the surface of plants and the soil [36]. After stormwater runoff enters the bioretention system, the ET is one of the water balance components associated with the reduction of stormwater in bioretention through the plants [37]. RECARGA simulations about ET refer to the depth of water evaporated from the bioretention system surface and through root [23]. As stated by Wadzuk et al. [37], many factors can impact on the percentage of ET, such as the presence and characteristics of underdrains, internal water storage (IWS) or previous soil moisture. This study shows that some of the highest recorded ET values relate to the bioretention models that included additional thickness of the root zone and sand layer in their design. However, evapotransporation is typically not considered as significant in overall water budget comparable to infiltration [11]. Erickson et al. [11] states that ET will likely account for an insignificant (< 5%) portion of the total water budget in bioretention systems. Also, ET is presented as the process that is under influence of many meteorological conditions, so the prediction of ET values in bioretention systems can be a challenge [36].
5. Conclusions
The aim of this study was to evaluate the hydrological performances of bioretention systems through simulations in RECARGA modelling software, in order to suggest the best bioretention solutions for existing urban locations in the city of Novi Sad. Modelling of bioretention performances for each location included a total of 8 different scenarios, that is, eight different bioretention design schemes for two bioretention models: model 1 (type without an underdrain) and bioretention model 2 (enhanced bioretention model, i.e. model with an underdrain and a storage sand layer). Sensitivity of the bioretention design parameters were tested by variations in bioretention size, thickness of root zone and ponding zone and also a sand storage layer, under different native soil and rainfall conditions. Overall obtained results demonstrated a significant contribution of runoff reduction through stay-on values, evapotranspiration and groundwater recharge, with the variations per single location and rainfall depth. The results showed that for some scenarios, infiltration into the native soil for models without an underdrain are very high, approximately 100%. This result indicate good potential of native soils on the area of research for bioretention implementation to meet a specified objective, such as infiltration or maintaining recharge volumes. The average ratio of total runoff reduction for all simulated scenarios is in the range from 43.33 to 93.84%, respectively 100% per some single scenarios.
Design parameters of bioretention systems affecting their water balance terms are shown to be the size of the system, the depth of the ponding zone and a storage zone layer, while rainfall intensity and native soil implies the duration of ponding and number of overflows. In terms of future design of bioretention systems for meeting specific performance objectives at analysed locations, it can be concluded that bioretention systems need to be sized and designed properly, to accommodate to a site specific characteristics. Also, the results point out that the bioretention systems will show better hydrological performance for smaller rainfall events. Therefore, bioretention systems design must consider issues such as safety if the bioretention systems are designed to manage runoff from extremely high storm events. For higher rainfall depths, multiple bioretention systems per contributing area could be also considered. This would increase the volume of runoff captured by bioretention systems. Other LID control measures like green roofs, or rain harvesting could also decrease the volume of runoff before it enters into a bioretention system.
RECARGA as a modelling tool can be used to support the future choice of the optimal design of bioretention systems and to provide information about their hydrological performances. Although, RECARGA is limited in modelling snowmelt processes and the number of soil layers. Obtained results about performance analysis in our study enhanced the existing documented results about the opportunities of bioretention modelling in RECARGA. Nevertheless, we recommend rigorous field analysis for further studies and LID model development, that are not based solely on simulated hydrological performance results.
Based on the study results, key conclusions which can be singled out are:
On the area of research, bioretention systems show great potential for runoff quantity control and the improvement of the water quality
The saturated hydraulic conductivity of the limiting layer below a bioretention facility has the greatest influence on the overall bioretention performances, especially for the bioretention systems in which the infiltration is the main process. The analysed locations showed great potential for implementing infiltration- based bioretention models
Larger ponding depths are correlated with the longer ponding time duration. This information can be usefull especially for urban locations, in terms of security, aesthetics, and plant survivability
Overflows can occur during larger rain events, so it is important to establish the protection of the bioretention system. The application of underdrains is recommended for locations where the infiltration soil properties are low, and also for runoff volume control that is based on the extreme design storms, like 50-year or 100-year storm events
This paper provides a good basis for the implementation of bioretention systems as one of the fundamental solutions for the problem of the existing urban floods on analysed locations. The obtained methodology can be applied for other locations and also it can be extended to another cities with similar urban flooding problems. This is especially important bearing in mind the climate changes that are reflected through long time intervals with intense precipitation and urban floods in cities with a continental climate. In order to support flood risk management, flood prevention and mitigation encouraged by bioretention systems, it is important to recognize their efficiency. However, future planning and implementation of LID strategies and approaches for the studied area would have to be carefully conducted in order to control flooding, protect and enhance interactions between urban water bodies and the wider environment.
Floods caused by rainfall and snow-melt are one of the most responsible for surface water flooding in Serbia. In terms of that, priorities in developing the bioretention design for the territory of Novi Sad and Serbia should go in the direction of overcoming the challenges that follow the implementation of bioretention systems like climate change, limited knowledge and the lack of practices together with the lack of policies and standards about LID strategies.
Supplementary Information
Notes
Author Contributions
A.G. (Ph.D. candidate) conceptualized the research, performed the modelling analysis, and wrote the first draft of the paper. J.G. (Associate Professor) and B.B. (Assistant Professor) provided feedback on the research and obtained results, and reviewed the first draft of the paper. All authors revised the paper and agreed on the final version of the paper.