Technical evaluation and optimization of biological aerated filter (BAF) treating micro-polluted source water at low temperature
Article information

Abstract
In this study, polyethylene and zeolite, as media in two-stage biological aerated filters (BAF), were evaluated for simultaneous removal of ammonia nitrogen and organics in micro-polluted water under low temperature conditions. For specific source water, the contaminants removal characteristics are evaluated by single-factor experiment to determine the suitable pH, air-water ratio (AWR) and hydraulic load ratio (HLR). Ammonia nitrogen and permanganate index in BAFs were promoted effectively with pH = 7~8, AWR = 1.0:1.0~2.0:1.0, HLR = 1~4 m3/(m2·h), low pollution loads and a temperature of 10°C. Based on the response surface analysis, the optimum parameters were as follows: pH of 7.94, AWR of 1.41:1.0 and HLR of 1.39 m3/(m2·h), for simultaneous removal of ammonia nitrogen and permanganate index, their removal rates were respectively 59.76% and 18.16%. BAF has a great advantage in emergency treatment of low temperature micro-polluted water, and response surface analysis can be used to optimize operating parameters.
1. Introduction
In northern China, there is a 3–5 month freezing period with low temperature water every year [1]. The low nitrogen and organic content of micro-polluted water results in low purification efficiency. This has been a challenge for China and other countries, it is difficult to ensure the stability of the effluent water quality to meet the standards by the conventional treatment process.
Biological aerated filter (BAF) is a new type of biofilm reactor, which integrates the interception of suspended solids and biological oxidation [2–7]. The existing research shows that BAF is used to deal with micro-polluted water treatment with high efficiency, small occupation of land, little investment and low operating cost [8–10]. Meanwhile, a lot of research show that conventional biological aerated filter and new biological aerated filter can degrade organic matter in wastewater and remove ammonia nitrogen [11]. Temperature is one of the important factors affecting BAF [12, 13]. BAF has been widely used in the emergency treatment of micro-polluted source water in normal temperature water [14], but there is still a lack of practical research and operational management experience for low temperature water.
In this paper, the treatment characteristics of ammonia nitrogen and organics in micro-polluted water in the different conditions were examined. The parameters of BAF were optimized and the regression model was analyzed by response surface method, in order to discuss the emergency applicability of BAF at low temperature, and the optimization of the operation parameters for design and operational management use.
2. Materials and Methods
2.1. Equipment
A lab-scale BAF made of a polymethyl methacrylate, with a wall thickness of 5 mm, a height of 1.8 m and internal diameter of 150 mm was used in this study (Fig. 1). The working volume of the reactor was 30 L, in which about 10 L was filled with natural zeolite in the upper layer and 10 L polyethylene in the lower layer as the biomass carriers. Water was fed to the reactor using a peristaltic pump with continuous feeding, fully mixing with the air in the bottom. The reactor was controlled with a cryogenic thermostat to control the temperature of the liquid flowed between 10 ± 1°C. The air was pumped to BAF by an air blower with gas flow. The upper and lower parts of the reaction column shall be provided with a sampling port to facilitate water sample collection.
Schematic diagram of BAF device.
2.2. Water Characteristics
According to the condition of micro-pollution, the water used in this study comes from a river in northern China. The parameters of water sample are shown in Table 1. In the pH single factor experiment, the phosphate buffer solution was used to adjust the pH.
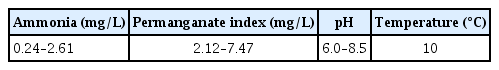
Characteristics of Water
2.3. Experimental Set-up
The seed sludge was obtained from an aeration unit of biological process in our laboratory. Firstly, the BAF was inoculated with seed sludge and aerated for 3 d to grow biofilm. Afterwards, ammonia and permanganate index should be reduced gradually and the flow rate should be increased gradually with high concentration of pollutants, until the average concentration of 2 mg/LNH4+-N, permanganate index was of 5–8 mg/L. Finally the operation should be continued until the reactor operation was stable. Samples were taken to measure ammonia and permanganate index of the effluent at the same time everyday during the start-up process. When the removal rate of ammonia reached more than 60%, the reactor was considered successful. The entire start-up phase lasted about 30 d.
2.4. Analytical Methods
Ammonium was analyzed by Nessler’s reagent spectrophotometer method, permanganate index according to Chinese standard examination of water and wastewater [15]. DO and temperature were measured using a digital DO meters (JPSJ-605, Shanghai Leici Co., Ltd, China), and pH was tested by pH meter (PHS-3C, INESA Scientific Instrument Co. Ltd, China). The results were the mean of three tests per day (a total of three parallel trials).
3. Results and Discussion
3.1. Effect of pH on Pollutants Removal
The influence of pH on the pollutant removal was investigated under the conditions of influent flow of 10 L/h, AWR of 1.0:1.0 and hydraulic load of 2 m3/(m2·h). Fig. 2 shows the removal rates for pollutants at different pH.

Effect of pH on the pollutants removal.
With the pH changed from 6.0 to 7.5, the removal rate of NH4+-N gradually increased as it became closer to the optimal pH for the growth of nitrifying bacteria. Nitrite bacteria are suitable to live in neutral or weakly alkaline environment. When the environmental pH is less than 6, the metabolism of nitrite bacteria will be seriously affected and even threatened to stagnate. Otherwise, ambient pH is greater than 9.6, the bacteria will also be unable to survive and play biological activities due to the alkaline condition [16]. As nitrifying bacteria are suitable for living in weakly alkaline environment, the ammonia nitrogen purification effect of the reactor is excellent in the pH range of 7.1–8.0. Although nitrification was affected to a certain extent due to the increase of pH in the range of 8.1–8.5, it still showed adaptability to pH.
With the pH changed from 6.0 to 7.5, the removal rate of permanganate index gradually increased, too. But in the process of pH changing, the purification effect of BAF on the permanganate index changed little, fluctuating around 15%, which indicated that the foreign bacteria removing permanganate index had strong adaptability to pH. Peak purification of permanganate index occurred between pH 7.0 to 8.0. The weakly alkaline environment was suitable for the survival of corresponding heterotrophic microorganisms.
3.2. Effect of Air Gas Ratio (AWR) on Pollutants Removal
The influence of AWR on the pollutants removal was investigated under the conditions of influent flow of 10 L/h, pH of 8 and HLR of 2 m3/(m2·h). These results suggest that AWR impacts the ammonia and permanganate index removal. DO in the water increases as AWR increases, BAF should maintain a certain concentration of DO to facilitate bacterial grow for water purification, otherwise, the rate of biochemical reactions will be affected by the limitations. Therefore, it is very important to choose the appropriate air-water ratio for the stable operation of the biological aerated filter. Fig. 3 shows the removal rates for two pollutants at different AWR from 0.5:1.0–2.0:1.0.
Effect of AWR on pollutants removal.
For the removal of ammonia, when AWR increased from 0.5:1.0 to 1.0:1.0, removal rate showed a leap forward growth. AWR was mainly consumed by heterotrophic bacteria in the outer layer of microbial membrane with low AWR (0.5:1.0), and this condition limited the growth of nitrifying bacteria in the inner layer of microbial membrane [17, 18]. This indicated that low DO can only oxidize part of ammonia nitrogen to nitrite nitrogen, and limited the further transformation of nitrite nitrogen to nitrate nitrogen [19]. When AWR increased from 1.0:1.0–2.0:1.0, ammonia removal did not change very much.
In particular, when AWR increased from 0.5:1.0 to 1.0:1.0, removal rate of permanganate index also showed a leap forward growth. Meanwhile as AWR continued to increase, the removal rate slowed down. This condition can be possibly attributed to that AWR increased, thereby promoting the organic degradation by aerobic heterotrophic bacteria [20, 21]. Heterotrophic bacteria in the outer layer of microbial biofilm can be easily separated from carriers. However, excessive AWR will produce strong air shear force, which will disturb the microbial biofilm and lose the biomass of the biofilm. Ultimately, the thickness of the microbial film will decrease. Therefore, 1.0:1.0–2.0:1.0 is an optimum AWR to achieve high pollutant removal rates for both pollutants.
3.3. Effect of Hydraulic Load Ratio (HLR) on Pollutants Removal
The influence of HLR on the pollutant removal was investigated under the conditions of influent flow of 10 L/h, pH of 8 and DO of 4 mg/L. The effects of HLR on the ammonia nitrogen concentration and permanganate index in the BAF reactor are shown in Fig. 4. HLR is a process parameter directly related to hydraulic retention time (HRT).
Effect of HLR on pollutants removal.
For ammonia nitrogen, an addition in HLR means a reduction in HRT which will lead to higher loads. High load has a certain effect on nitrifying bacteria in BAF, thus affecting the purification effect. The removal efficiency of ammonia nitrogen was approximately 62.32% with HLR was 1–2 m3/(m2·h). Increasing the HLR from 3 to 6 m3/(m2·h), removal efficiency dropped to 38.8%. Due to long HRT, bacteria had sufficient time to degrade and remove pollutants, and BAF showed good purification efficiency for NH4+-N. When HLR increased, although HRT is relatively reduced, the erosion ability and activity of the biofilm was enhanced due to the doubling of the HLR. With the HLR further increasing, the contact time between NH3-N and nitrifying bacteria in the biofilm decreases and the water flow has a certain hydraulic shear effect on the biofilm, leading to a significant decrease in the removal rate of NH4+-N.
Additionally, the removal efficiency of permanganate index was stable and reached its peak, approximately 19.2%, with HLR was 2–4m3/(m2·h). Further increase in HLR, reactor purification effect of permanganate index continued to decline, this was because the high HLR, with staying time was too short, insoluble organic matter degradation was directly discharge, and high filtration speed lead to biofilm washed, the biofilm thickness was beyond the scope purification effect, worsen water quality.
3.4. Response Surface Test Results and Model Analysis
On the basis of the above single-factor tests, pH(X1), AWR (X2) and HLR(X3) were taken as independent variables, and the removal rate of NH4+-N (Y1) and removal rate of permanganate index (Y2) were taken as response values. Response surface Box-Behnken central combination test (using response surface software Design Expert 8.0.5) was used to optimize the BAF. Table 2 shows the factors, horizontal combinations, and response values of the test. Multiple regression analysis was shown in Eq. (1) and Eq. (2) which were the equations of removal rate of NH4+-N and removal rate of permanganate index. The correlation coefficients R2 of the equations were 0.9902 and 0.9934, indicating that the regression model had a good fit with the actual situation and could be used in the optimization test of operational conditions of BAF. Meanwhile, the models (Y1 and Y2) have a high significance (P < 0.0001).
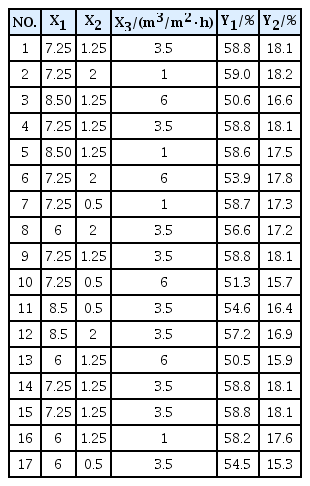
Factors and Levels Test and Response Values
According to the quadratic regression equation and regression model variance analysis results, the response surface diagram of pH, AWR, HLR, the removal rate of NH4+-N and the removal rate of permanganate index was made, and the results were shown in Fig. 5.
Response analysis of pH, AWR and HLR to removal rate of pollutants.
It can be seen from Fig. 5(a) that, when AWR was fixed, the removal rate of NH4+-N increased first and then decreased with the increasing of pH. However, from the contour line, the interaction between pH and AWR was not obvious. According to Fig. 5(b), HLR was fixed, the removal rate of NH4+-N increased first and then decreased with the increasing of PH, and the interaction was not obvious. From Fig. 5(c), HLR was constant, the removal rate of NH4+-N increased first and then tended to be stable with the increase of AWR, and there was an interaction.
From Fig. 5(d), AWR was fixed the removal rate of permanganate index first increased and then decreased with the increasing of pH, and the interaction was obvious. According to Fig. 5(e), when HLR was constant, the removal rate of permanganate index increased first and then decreased with the increasing of PH, and the interaction was not obvious. From Fig. 5(f), when HLR was constant, the removal rate of permanganate index increased and tends to be flat with the increasing of AWR, and the interaction was obvious.
The above changes were consistent with the relevant conclusions in the single-factor test. According to the parameter optimization analysis of the established mathematical model, the optimization conditions of the model were obtained as follows :pH is 7.94, AWR is 1.41:1.0, HLR is 1.39m3/(m2•h) at this time, the removal rate of NH4+-N and permanganate index reached 59.76%, and 18.16%.
Table 3 shows the test results before and after response surface optimization. No. 1 and 2 are the parallel tests after optimization, and No.3 and 4 are the parallel tests before optimization, and the mean values of the two groups of parallel tests are compared. It shows the treatment effect simultaneous ammonia nitrogen and organics removal can be guaranteed on the basis of cost saving and land reduction, and the test result was close to the theoretical value. The reaction conditions of BAF at low temperature (10°C) optimized by response surface analysis method were accurate and reliable, and had practical value. According to the conclusions of this study, BAF was applied as an emergency treatment device for micro-polluted water in a water treatment plant in a city in northern China, the effluent NH4+-N and permanganate index can achieve long-term stability and meet the class water quality standard III in “Environmental Quality Standard for Surface Water” as city water source.

Test Results Before and After Response Surface Methodology Optimization
4. Conclusions
The BAF can be used as an emergency treatment process for micro-polluted of low-temperature source water. Through experimental verification, the effluent water quality can meet the source water quality standard stably.
For specific source water, the optimal value of main operation management control parameters of BAF can be determined by numerical simulation and using a certain amount of process operation effect data. It has been proved that the response surface test results and the model analysis method fit well with the actual operation effect, and can be used to guide the design and engineering application of BAF.
A river in northern China as water source is selected as the experimental object, under the premise of considering the removal rate of pollutants and saving costs, the optimized model combination conditions are as follows: pH of 7.94, AWR of 1.41:1.0, HLR of 1.39m3/(m2·h), under these conditions, the removal rate of NH4+-N is 59.2%, permanganate index is 17.8%.
Using response surface analysis method can achieve the purpose of parameter optimization on the basis of a small amount of experimental data, thus reducing the difficult problems such as long commissioning period and many control variables of water treatment system.
Acknowledgments
The work is financially supported by national science and technology major project for water pollution control and treatment (2017ZX07501002).
Notes
Authors Contributions
D.L. (Professor) is funding provider, revise the manuscript. X.W. (Ph.D) completed part of the experiment and write the manuscript. X.L. (M.D.) completed part of the experiment. A.W. (Ph.D) revised the manuscript. All authors read and approved the final manuscript.