The change of metal pollution in the water and sediment of the Bartın River in rainy and dry seasons
Article information

Abstract
In this study, it was aimed to determine the heavy metal pollution and the factors causing this pollution in the water and sediment of the Bartın River during rainy and dry periods. Concentrations of Co, Cr, Cu, Fe, Mn, Ni, Pb, Zn, As and some other metals in water and sediment samples collected from 4 different points during rainy and dry periods were investigated. It has been determined that both natural sources (soil erosion) and anthropogenic sources (runoff in urban and agricultural areas) affect metal concentrations in water and sediment during the rainy period. Heavy metal accumulation was less at the point with the least water depth (≈ 2 m). Higher concentrations were determined at the point where soil transport was highest during the rainy period. Since EF values of As, Pb, Zn and Li were greater than two in both periods, it was determined that they were affected by anthropogenic sources (wastewater discharges, agricultural and urban activities). EF values less than one showed that Co, Cr, Ba, Ni, Mn were related to lithogenic actions and riverbank runoff. Non-carcinogenic effects caused by metals did not pose a risk to adults and children.
1. Introduction
The permanence and environmental toxicities of heavy metals have been reported as the most important reasons for their investigation in aquatic environments [1, 2]. Industrial and domestic wastewater discharges, uncontrolled and overuse of heavy metal containing pesticides and fertilizers [3], atmospheric deposition, surface runoff, dissolution from sediment [4] are known as the most important anthropogenic sources of heavy metal pollution in river water. Metals in water structures are found in colloid, particulate and dissolved form or adsorbed to the sediment [5]. The transport of metals in aquatic environments depends on dissolution, precipitation and sorption processes [6], which affect their bioavailability [7]. After a certain period of time, heavy metals mixed with the river precipitate to sediment by various mechanisms (sedimentation, complexation and adsorption of clay particles) and accumulate there then, they reach high concentration in the food chain [8]. This results in a higher concentration of heavy metals in the sediment than in the water column. Furthermore, these metals deposited in the sediment can be re-mixed into the water column by resuspansion, desorption, oxidation or reduction processes and can be more hazardous for aquatic organisms, animals and humans [9, 10]. Therefore, sediment is suitable for monitoring heavy metal pollution in aquatic environments [11]. When these metals reach high concentrations, they pose a serious danger to the ecosystem and humans [12, 13]. Therefore, heavy metal concentrations determined in water and sediment can be used to evaluate the anthropogenic and industrial impacts and risks caused by wastewater discharges in the rivers [14].
Existing studies indicates that heavy metal pollution in surface waters is generally investigated in areas where the industry is developed and the population is very high [15–18]. On the contrary Bartın River is located in a place where industry and population are not developed. Although the domestic wastewater treatment plant is being operated since February 2017, wastewater discharge is still present at some points due to the lack of collection system. In addition, as the river is located in a rainy region, stormwater runoff from the mountains especially in winter causes an increase in the water level and flow in the river. Also stormwater runoff causes changes in the physical properties of the river water like color, turbidity, suspended solids etc. For this reason, in this study, it was aimed to 1) investigate the effect of stormwater runoff on the concentration and distribution of metals in river water and sediment. 2) determine the effect of wastewater discharges on heavy metal concentration and diversity 3) evaluate the heavy metal pollution in river water and sediment by calculating the pollution index methods defined in the literature. Within the scope of the study, water, sediment and soil samples were taken from the river and basin in both periods and heavy metal analyzes were made.
2. Experimental
2.1. Description of the Study Area
Bartin River is located within Bartin Province in Turkey. It has a water collection basin of 2,059.35 km2. This area consists of 8 sub-basins. The average rainfall is 69.3 mm and 111.3 mm for the summer and winter seasons. Sampling points were selected by estimating the places where the complete mixing is occurred after wastewater discharge and their locations are shown in (Fig. S1). SP1, SP2 (water dept ≈ 2 m) and SP3 sampling points are located in the area of the river passing through the city center. SP4 sampling point is on a different tributary of the river which is connected to the sea. At this point, water depth and bed width are higher (> 5 m) than other points.
2.2. Sample Collection and Analysis
Water and sediment samples were taken from 4 different locations in July 2018 and December 2018. The month of July represents the dry period with increasing water temperatures whereas december represents the rainy season with decreasing water temperatures. Samples in the rainy period were collected after heavy rainfall. Sediment samples were taken from the surface with a sediment bucket (Van Veen) at a depth of approximately 0–5 cm (Fig. S2). Sediment samples were transported to the laboratory in glass jars and stored at 4°C [19]. Heavy metal analyzes of sediment and soil samples were performed according to EPA Method 3050B [19]. About 10 g of dried sediment sample was digested. For the digestion of samples for analysis by ICP-MS, 10 mL of 1:1 HNO3 was added. The slurry was mixed, and covered with a watch glass or vapor recovery device. The sample heated to 95°C ± 5°C and refluxed for 10 to 15 min without boiling. The sample was allowed to cool, 5 mL of concentrated HNO3 was added, replaced the cover, and refluxed for 30 min. After cooling, 2 mL of water and 3 mL of 30% H2O was added. The acid-peroxide digestate is continuously heated until its volume is reduced to approximately 5 mL. After cooling, dilute to 100 mL with water. Water samples were collected in high density polyethylene containers. Containers were washed within a solution of 10% nitric acid followed by repeated rinsing with distilate water and finally rinsing with ultrapure water prior to sampling. Heavy metal analyzes of water samples were performed according to the EPA Method 200.7 [20]. All water samples were acidified with HNO3− (1+1) and adjusted to pH < 2 for preservation. 100 mL water samples were taken in to polypropylene centrifuge tube. 0.4 mL of HNO3 (1% V/V) was added to 100 mL of aliquot of sample to adjust the acid concentration. Then the tube was closed and mixed. 100 mL aliquot transferred to 250 mL griffin beaker. 2 mL of nitric acid (1+1) and 1 mL of hydrochloric acid (1+1) were added to the bottle and placed in the heater (85ºC) to evaporate the solution. Sample volume reduced to approximately 20 mL. To prevent further evaporation the beaker was closed and reflux slowly for 30 min. After cooling the beaker it was transferred to 50 mL volume flask and mixed. Chemical analysis for water samples were made by using ICP-AES. Suspended solid matter analysis was performed by gravimetric method. Turbidity was measured by Hach 2100 Q portable turbidimeter. Statistical analysis were made by statistical package program SPSS 15 (SPSS USA) and Microsoft Excel 2010.
2.3. Assessment of Metals in Water
2.3.1. Heavy metal pollution index (HPI)
The heavy metal pollution index evaluates the quality of water and its suitability as drinking water in terms of metals [21]. It is based on the weighted arithmetic quality method [22] and is calculated according to (Eq. (1)).
Wi (weight unit) was calculated as 1/Si where Si is the recommended standard of the concerned metal, n is the number of estimated metals and Qi is the individual quality rating of ith metal. Ci is the measured value of the ith metals in μg/L. Usually, the critical pollution index score for drinking water is accepted as 100 [21].
2.4. Asessment Methods of Metals in Sediment
Heavy metal pollution of sediment is evaluated by various methods using average shale values and earth’s crust values as reference [23, 24]. Enricment factor, geoaccumulation index, pollution load index, modified degree of contamination (mCd) and Nemerow pollution index (PN) have been used by many researchers [1, 17, 25]. Metals are often found in combination in environmental environments and their negative effects often occur when they are together [17, 26]. The single metal indexes cannot adequately reflect the synergistic effect [27]. Therefore multi-element indices such as modified pollution degree (mCd) and nemerow pollution index (PN) [17, 27, 28] can be used to determine the this synergistic effect. Detailed information about these indexes is shown in Table 1.

Indexes Used to Evaluate Sediment Pollution
3. Results and Discussion
3.1. Variation of Heavy Metal and Other Metal Concentrations in River Water according to Rainy and Dry Periods
The results of heavy metal concentrations in surface waters of the Bartın River are shown in Table 2. Ni, Cr, Fe, Mn and Al concentrations were found higher during the rainy season while Cu, was found to be higher in dry season. For this reason, it is thought that the non-point sources such as soil erosion and desorption of metals from sediment to the water coloumn can cause an increase in the concentration of these metals during the rainy period. The high concentration of Fe, Mn, Ni, Cu determined in soil samples collected from the river bank in this study support this idea (Table 3). In addition, the concentration of suspended solids in the rainy period was 3 times the dry period (Table S1). Similar results have been reported in many studies in the literature. For example, in a study conducted in the Kali River, the higher concentrations of Fe, Mn, Co and Cu during the monsoon period were explained by the increased amount of precipitation [39]. In another study [14], it was reported that the concentrations of some metals (Cd, Co, Cr, Fe, Ni, Pb, Zn) increased in surface waters due to melting snow and increased precipitation in summer. On the other hand, the higher Cu concentration in the dry period can be explained by domestic wastewater discharges in this study. Increasing concentration of anthropogenic origin metals at the SP2 point in the dry season supported this idea. In previous studies, many researchers [1, 40, 41] explained the increasing Cu concentration in dry period with domestic wastewater discharges. Another notable result in this study is that Co, Pb, Zn, As, concentrations did not show any significant difference between both periods (Table 2). For this reason, wastewater discharges [42], leakages from irregular solid waste landfill and fertilizers and pesticides used in agricultural fields (non-point sources) can be considered to be the most important anthropogenic sources of As, Cd, Hg, Ni, Pb and Zn in Bartın River. The concentration of Fe and Mn decreased in sediment during the rainy period but increased in water. This situation can be explained by the transition of metals from the sediment to the water column due to the increasing flow velocity. The results showed that the point sources (wastewater discharges) were effective in the dry period, while non-point sources (soil erosion, agriculture, urban surface runoff) were effective during the rainy period. The concentration order for cations was the same for both periods, and it was determined as Ca > Na > Mg > K > Li. They are generally originated from natural sources. The most important sources of Ca are the dissolution of carbonate minerals (e.g., calcite, dolomite, aragonite) [43]. Dolomite in sedimentary rocks and ferromagnesian minerals in metamorphic rocks are known to be important sources of magnesium in nature [44]. Consequently, it was determined that cation concentrations are related to lithogenic activities in dry period. In addition, the decreasing concentrations of Ba, Li, Ca, Mg, K and Na during the rainy period can be explained by the dilution effect of precipitation [1, 4, 45–47]. When the average concentrations were compared with the national and international water quality standard values, metal concentrations did not exceed the limit values in both rainy and dry periods. The average concentration for Ca alone was found to be very close to the limit value in the dry period. In addition, HPI values were calculated according to the standard values [48, 49] reported for drinking water to evaluate heavy metal pollution in river water and are shown in Table 2. HPI values at all sampling points were lower than the critical index value for metals (HPI = 100) [21]. For this reason, heavy metals detected at the sampling points did not pose a danger to the aquatic environment. HPI was determined higher in dry period, especially in points where wastewater discharges were effective. In the rainy period, the HPI value were higher at the SP4 where soil erosion was effective. Compared to the other studies in the literature, metal concentrations in the Bartın River were considerably lower than in rivers from which industrial and domestic wastewater was heavily discharged [1, 16, 48, 49].

Heavy Metal Concentration (μg/L) in Water Sample of Bartin River of the Present Study
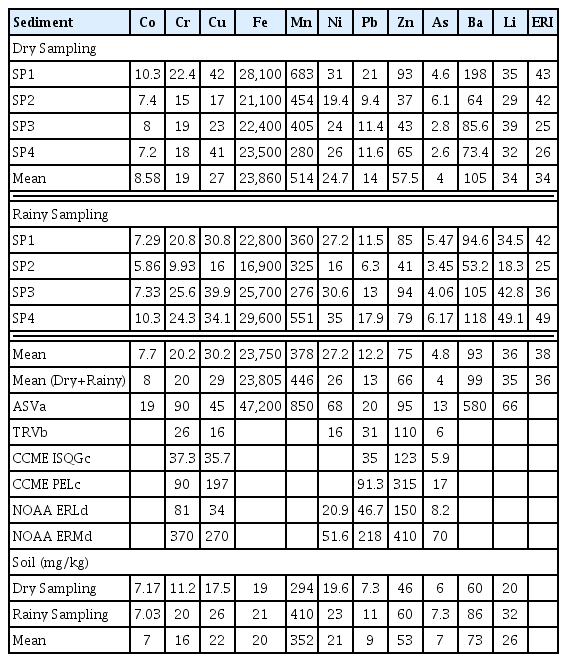
Selected Metal Concentration (mg/kg) in Sediment Sample of Bartın River of the Present Study
3.2. Determination of Heavy Metal Concentrations in the Sediment
The results of heavy metal concentrations in sediment of the Bartın River are shown in Table 3. The concentration order for heavy metals in sediment has been determined as Fe > Mn > Zn > Cu > Cr > Pb > Co. The mean concentration of metals in sediment was higher in the dry period (metal = 24,668 mg/kg) compared to the rainy period (metal = 24,434 mg/kg). However, no significant difference was found between the two periods. Co, Fe, Mn, Pb, Ba concentrations were found to be higher in the dry period while Cr, Cu, Ni, Zn, As, Li were found to be higher in the rainy period. As it is known, metals accumulate in sediment by precipitation and sorption processes [50, 51] and return to the water column with dissolution and desorption processes and negatively affect the water quality [50]. In this study, it was thought that some metals pass into the water phase due to the increased flow rate during the rainy period. For example, in rainy period, iron and manganese decreased in the sediment unlike water phase. In addition, it is thought that some metals (Pb, Co) especially of anthropogenic origin, accumulate more due to the decreased flow rate during the dry period [52]. The higher sediment concentration of Cr, Cu, Ni, Zn, Li and As during the rainy period can be explained by the river bank runoff and surface runoff from agricultural and urban areas. The fertilizers used in agricultural activities contain significant amounts of As, Cd, Hg, Ni, Pb and Zn [53]. In addition, fertilizers and pesticides used in agricultural areas are the most important non-point sources of As [54]. Domestic construction, motor vehicles related sources and untreated waste waters reported as the main sources of Zn [55]. Batteries and irregular landfills cause significant Li and Co discharges in surface waters [56]. In this study, it was also determined that the water depth and surrounding land affect the metal concentration in the sediment. Metal concentrations were less at the point where the water depth was lowest in the rainy period. Increasing flow rate during the rainy season caused the transport of metals from the sediment. On the other hand, metals precipitated better due to the reduced flow rate during the dry period. In addition, the lowest concentrations between the sampling points were determined at the point (SP2) where the water depth is lowest (≈2 m) (Table 3). It has been reported that heavy metals accumulate more in sediment with a water depth of more than 5 m [57]. On the other hand, in the sampling point where river bank runoff was effective (SP4), concentrations were determined to be higher in the rainy period (Table 3). In this study, metal concentrations in sediment were found lower than in rivers where anthropogenic sources were effective such as Tigris (Turkey) [58], Krotoa River (Bangladesh) [1], Karnaphuli (Bangladesh) [46], Nil (Egypt) [59] Cam (Vietnam) [60]. However, concentrations reported for Okimeshi River (Nigeria) [61] lower than the results of this study.
3.3. Estimation of Heavy Metal Sources
3.3.1. Enrichment factor index
Enrichment factors (EF) were calculated and shown in (Fig. 1) to determine the effect of anthropogenic sources and geochemical tendency in sediment pollution. When calculating EF values, metal concentrations are usually normalized to the concentrations of Al and Fe [64, 65]. In this study, Fe was used as a reference element for geochemical normalization [25]. Many criteria have been reported [31, 66, 67] for the evaluation of EFs. For example, EF values close to 1 indicate that metals are related to the earth’s crust, EF < 1 indicates that metals are mobilized or depleted, and EF > 1 indicates that metals are of anthropogenic origin [66]. Another researcher [67] reported that the metals with EF = 0.5–1.5 are related to the earth crust and natural weathering processes, while those with an EF > 1.5 are of anthropogenic origin. EF values showed a similar tendency during the dry and rainy periods in this study. Severe, moderate and minor enrichment was detected for As (EF = 5.78), Li (EF = 4.1), Pb (EF = 2.42) and Zn (EF = 2.27), respectively. EF values for other elements were found to be less than one. EF values showed that the As, Li, Pb, Zn, Cu were related to the anthropogenic activities such as wastewater discharges, agricultural and urban activities [68, 69] while Co, Cr, Ba, Ni, Mn related to the riverbank erosion or natural weathering processes [67]. In addition, EF values of Zn, As, Li were calculated to be higher during rainy period. Therefore, surface runoff from agricultural and urban areas may be effective for these metals. The higher EF value of Pb in the dry period indicated that point sources such as wastewater discharges were effective for this metal. Anthropogenic pollution was determined for As, Li, Pb, and Zn since EF > 2 were reported to be pollution indicator by [57]. As explained earlier, anthropogenic pollution is thought to be related to point (domestic sewage discharge) and non-point (agricultural, urban surface runoff) anthropogenic activities. Other elements did not cause pollution in the sediment because EF values less than 2.
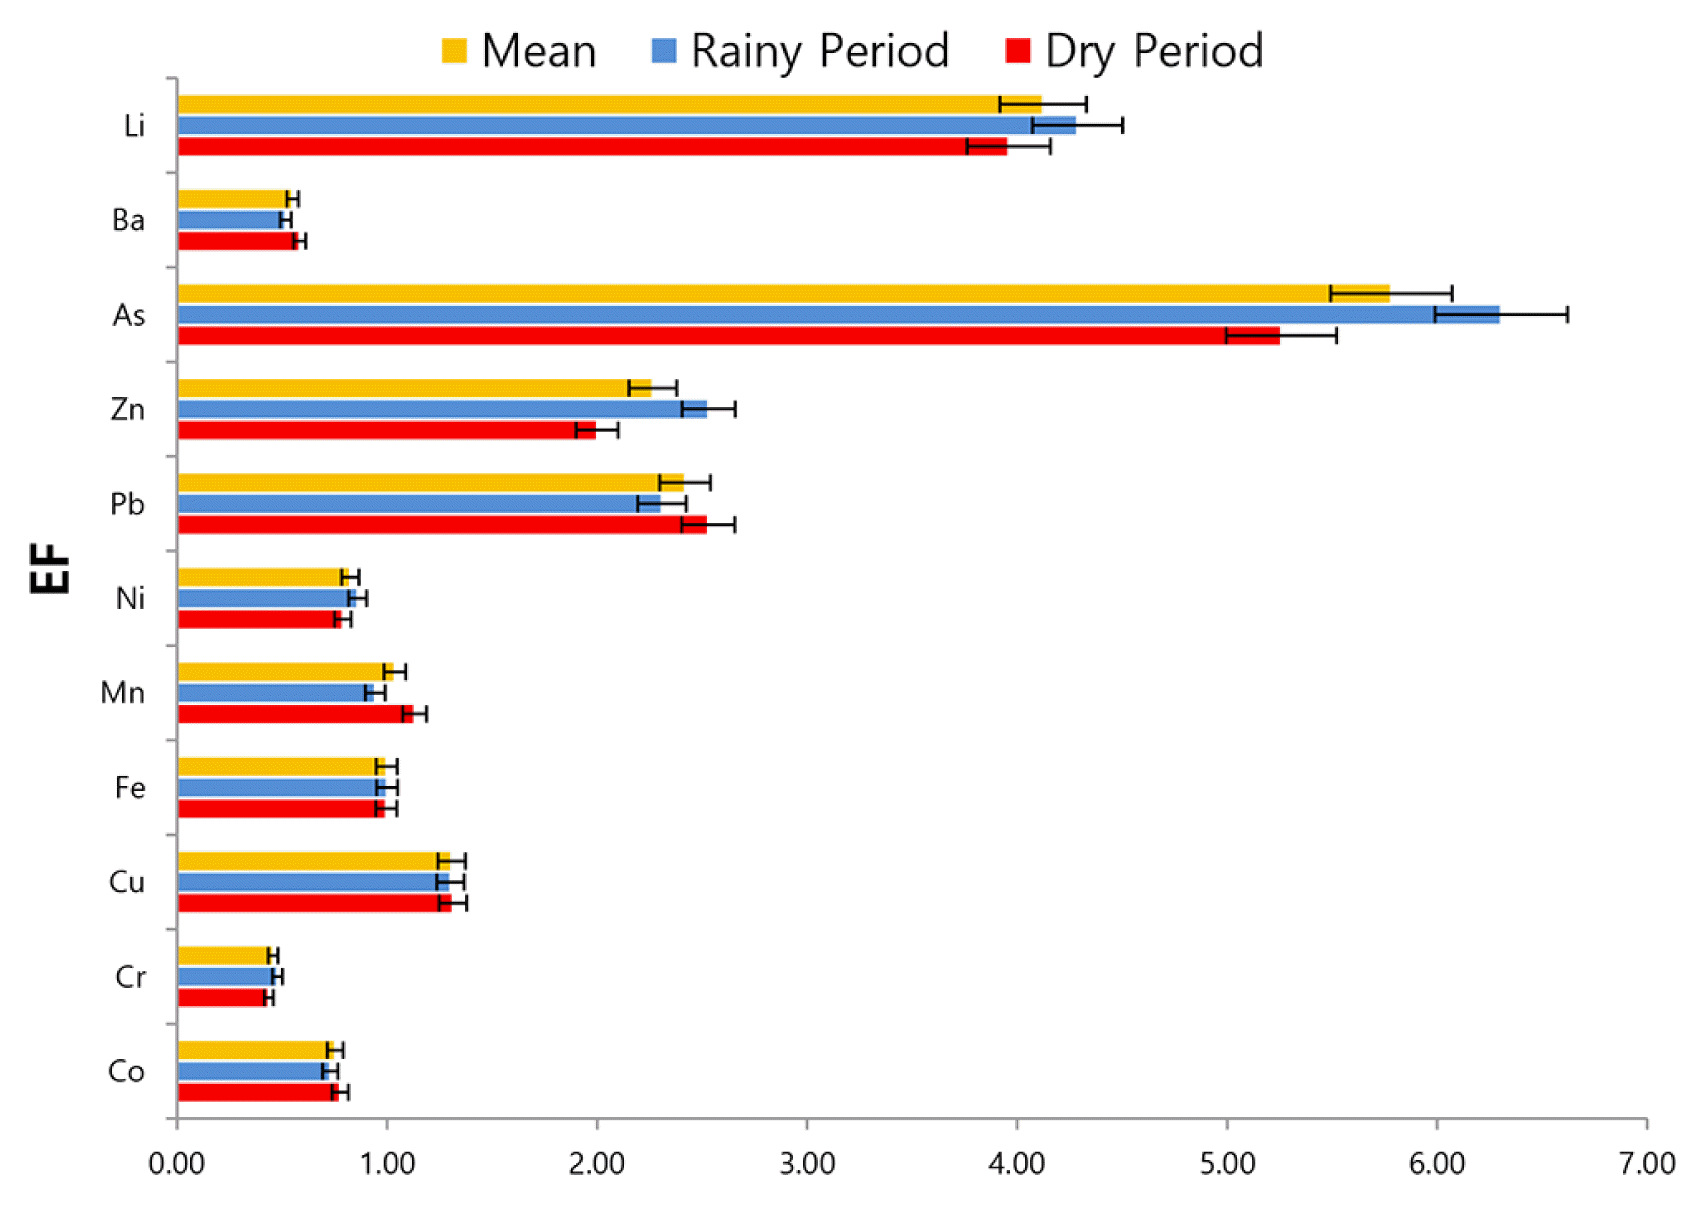
Variation in EFc values of selected metals in surface sediment of Bartın River.
3.3.2. Correlation matrix
Correlation matrix is widely used to determine the relationship between heavy metals and estimated their sources [65]. The correlation matrix was calculated for the metals determined in the sediment and shown in Table 4. High positive correlation was determined between Fe and all metals. For this reason, it is thought that the behaviour of these metals in sediment was similar and they were of lithogenic origin [58]. As it is known, metals occur naturally in various layers and lithological units of the earth’s crust. Depending on the characteristics of the rocks and soils they are in, they interact with water and are transported to aquatic environments through natural processes (dissolution-precipitation, adsorption, etc.). In this study, the high positive correlation determined between Fe and Mn and the majority of other metals showed that carbonate and organic fraction were not effective in metal accumulation [70]. In addition Fe/Mn oxyhydroxides were considered to be effective in the accumulation of metals [70]. Insignificant positive correlations were determined between Mn-Zn, Mn-Cr, Mn-Cu while significant correlations were determined between Cr-Zn, Cr-Cu, Zn-Cu and Zn-Cr only during rainy period. This situation can be explained by the carried of Cr, Cu and Zn by stormwater runoff in the rainy period, and by the migration of the Mn from the sediment to the water coloumn with increasing flow rate. Although Mn is a mobile metal, it may not always be of anthropogenic origin and Mn can be found in carbonate minerals in sediment [71]. In contrast to the exchangeable geological structure of Zn and Mn, Cr is in the amorphous Fe-oxyhydroxide structure and forms the fixed fraction. Similarly, Islam et al. [52] reported that soil particles carried by stormwater runoff in the rainy period were important source of Cr for rivers. Another notable point was that As and Li showed high positive correlation with other metals in rainy period unlike dry period. These results indicated that the As and Li are related to the anthropogenic sources such as wastewater discharge during dry period. As explained in the previous section, non-point sources were effective in the rainy period. Similarly, in another study, it was reported that arsenic was mixed into the Bangladesh River from the Himalayan basin during the rainy season [72].
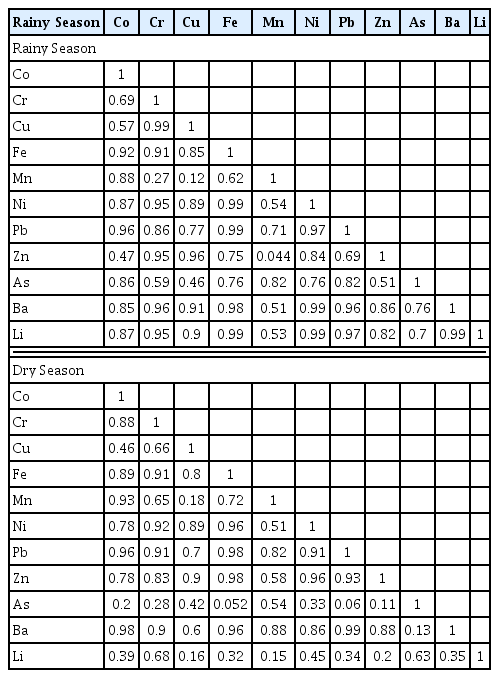
Correlation Matrix among Different Trace Metals in Bartın River in Rainy and Dry Period Sediment Samples
3.4. Assessment of Sediment Pollution
In order to evaluate the pollution level in sediment, the Igeo values of the metals were calculated according to the upper continental crust values [73] for rainy and dry periods and shown in (Fig. 2). In both periods, there was no metal contamination in the sediment as the Igeo values for all metals except Li were less than zero. Igeo value were determined between zero and 1 for only Li at SP3 and SP4. Consequently, according to the Igeo values, there was no pollution in the sediment and this can be explained by bioturbation in the upper sediment layer or dilution with coarse sediments [74].

Variation in Igeo values of selected metals in surface sediment of Bartın River, Turkey Boxes represent a range of 25th to 75th percentile, solid lines in boxes are median values, error bars represent 5th and 95th percentile.
The PLI index provides information about the pollution status of sediment and soil [75]. PLI values for sampling points are shown in the (Fig. S3). PLI values calculated as less than one for all sampling points showed that there was no metal contamination in the sediment. Moderate degree pollution (CF > 1) was determined for As and Li during the dry and rainy periods (Fig. S4). Pollution did not detect for other elements due to the CF < 1. This result was compatible with the results of EF and Igeo indexes. In this study, also modified degree of contamination (mCd) and nemerow pollution index (PN) values were calculated to evaluate the synergistic effect [27] of metals usually coexisting in environmental matrix [17, 26]. The order of PN values according to the sampling points during the rainy period was determined to be SP4 > SP1 > SP3 > SP2. PN values were determined to be in the range of 1 < PN < 2.5 at all sampling points (Fig. 3). This result showed that the sampling points were slightly contaminated. The water depth at the SP2 point was much lower than the other points. It was thought that the increased flow rate during the rainy period caused the transport of pollutants from the sediment. The SP4 point is also far from the city center, but it is a point where the river bank runoff is much more effective on water quality, especially during the rainy period. In fact, the opposite tendency detected at SP2 and SP4 during the dry period supported this idea. According to the mCd index values, no pollution was determined at all sampling points for both periods due to mCd < 1.5 (Class 0) (Fig. 3). mCd values are also compatible with PN values. As a result, mCd an PN values showed that the metals did not cause significant synergistic effect in river sediment. According to the contamination factors (CF), As (CF = 2.44), Li (CF = 1.74) and Pb (CF = 1.02) were the metals that contributed the most to metal pollution (Fig. S4). Other than pollution index methods, another method used to evaluate sediment pollution is the comparison of determined concentrations with reference standard values [27, 76, 77]. The metal concentrations determined in this study were compared with the sediment standard values reported by the Canadian Council of Ministers of the Environment (CCME) [62] and the National Oceanic and Atmospheric Administration (NOAA) [63]. The average concentrations determined for Ni alone were higher than the effects range-low (ERL) value reported by NOAA [63]. In addition, concentrations of Ni and Cu were higher than the toxicity reference values of theirs.

Variation in PN and mCd values of different sampling sites of Bartın River in rainy and dry season.
3.5. Ecological Risk Assessment
The effect of heavy metal pollution on Bartin River ecosystem was evaluated by potential ecological risk index (RI) method (Table 2). The order of ecological risk factors (Efi) for sediment were determined to be As (Efi = 24) > Pb (Efi = 5.1) > Cu (Efi = 2.8) > Ni (Efi = 1.7) > Zn(Efi = 1) > Cr and Mn (Efi = 0.4). The highest value was determined for As while the lowest value was determined for Cr and Mn (Efi = 0.4). Cr, Cu, Mn, Ni, Pb, Zn, and As did not pose a threat to the ecosystem as their Efi values were less than 40. The values of RI were less than 150 for all sampling points (Table 3). Therefore heavy metals did not pose a danger to the river ecosystem. Consistent with other multi metal indexes (mCd and PN), RI values was found to be higher at SP4 and SP1 during the rainy and dry periods, respectively (Table 3).
3.6. Risk Assessment on Human Health
The effects of pollutants on human health are estimated by performing carcinogenic and noncarcinogenic risk analysis [78]. Slope factor (SF) and reference dose (RfD) are toxicity risk factors used for carcinogenic and noncarcinogenic risk characterization [79]. In order to calculate the carcinogenic and noncarcinogenic risks, the daily dose exposed by ingestion and dermal absorption should be calculated firstly. Daily doses can be calculated by Eq. (2) and Eq. (3) [78, 80].
Where, EDderm is exposure dose through dermal absorption, EDing = exposure dose through ingestion of water (mg kg−1 d−1); C is the mean concentration (mg/L) of heavy metal or metalloid, IR is the water intake rate, 3.49 and 2.14 L d−1 for adults and children, respectively EF is exposure frequency (d year−1, 365); ED is exposure duration (years, 70 for adults and 6 for children); BW is average body weight (kg, 70 for adults and 15 for children); AT is averaging time (d, 25,550 for adults and 2,190 for children); SA is the exposed skin area (cm2, 18,000 for adults and 6,600 for children); ET is exposure time (h/d, 0.58 for adults and 1 for children); CF is unit conversion factor (L cm−3, 0.001); and Kp is dermal permeability coefficient (cm h−1), 0.001 for Cd, Cu, Fe, Li, Sr, and Mn; 0.002 for Cr; 0.004 for Co, Pb, and Ni; and 0.0006 for Zn [78, 80–83]. The non-carcinogenic risk was calculated as the hazard quotient (HQ) and calculated according to Eq. (4) [78].
Where, HQing/derm is hazard quotient via ingestion or dermal contact (unitless), RfDing/derm is oral/dermal reference dose (mg kg−1d−1), EDing/derm is exposure dose (mg kg−1d−1). To calculate the risk caused by a large number of metals, it is necessary to sum the HQ values determined for each metal (Eq. (5)). If the value of HQ or hazard index (HI) is less than 1, it is unlikely to produce adverse health effects for the exposed populations. If the HQ or HI value exceeds 1, it is not within the acceptable range, and the greater the value, the higher the likelihood of adverse health effects.
Non-carcinogenic risk was calculated for rainy and dry periods considering both ingestion and dermal exposure. Noncarcinogenic health risk assessment summary for the selected metals in the water for adults and children via ingestion and dermal routes is given in Table 5. For adults via ingestion route, the mean HQing levels were found in the order of Mn > Cr > Fe > Ni > Al > Cu > Zn and Mn > Fe > Cu > Al > Zn in rainy and dry, respectively. The mean HQderm levels were found in the order of Cr > Mn > Ni >> Fe > Al > Cu > Zn and Mn > Fe > Cu = Al > Zn in rainy and dry, respectively. For adults, exposure via ingestion and dermal was higher during the rainy season. Because the average HQing/derm values were less than one, heavy metals have little or no adverse effect on adults in both periods. Non-carcinogenic health risks were also calculated for children. HQ values also children were higher during the rainy season. The mean HQing levels were found in the order of Mn > Cr > Fe > Ni > Al > Cu > Zn and Mn > Fe > Cu > Zn > Al in rainy and dry, respectively. By means of dermal route, the HQderm levels were found in the order of Cr > Mn > Ni > Fe > Al > Cu > Zn and Mn > Fe > Al > Cu > Zn in rainy and dry, respectively. Since HI values for all metals were less than 1, noncarcinogenic effects did not pose a risk to those living in the sampling area (Table 5). HI was calculated to be HI < 1 for rainy and dry periods. However, HI value was higher for the rainy period than the dry period. HI values (dermal+ingestion) were calculated as 1.69 × 10⁻¹ and 6.26 × 10⁻¹, for adults and children, respectively. Exposure with ingestion route was more important than dermal exposure during both periods.

Non Carcinogenic Risk (HQ/HI) of Heavy Metals for Adults and Children on Rainy and Dry Periods
4. Conclusions
Metal concentrations and types found in Bartın River water and sediment changed during rainy and dry periods. According to the EF and correlation matrix calculated to determine the metal sources, both natural sources (soil erosion or riverbank runoff, geological interaction) and anthropogenic sources (surface runoff from agricultural and urban areas) were effective on metals in the rainy period. Wastewater discharges and natural weathering processes have been found to be effective in the dry season. Water depth and riverbank characteristics affected the metal concentrations. Metal accumulation was lower at the point with the least water depth (≈ 2 m). Riverbank transport was the most important source during the rainy season. As, Li, Pb and Zn have been affected by anthropogenic sources while Co, Cr Ba, Ni and Mn affected by the earth’s crust and natural weathering processes. According to HPI values, metals in Bartın River water did not pose a danger to the ecosystem. According to the RI, mCd and PN values, metals did not show a hazardous and synergistic effect for the ecosystem. Igeo and PLI values calculated to evaluate metal pollution in sediment, metals did not significant pollution in sediment. All metals except nickel were lower than the limit values reported by CCME [62] and NOAA [63] also mean concentrations determined for nickel and copper slightly exceed the TRV values. According to the calculated HQ and HI values, metals did not pose a risk on human health. However, risk was higher for children due to lower body weight and exposed skin area than adults.
Supplementary Information
Acknowledgments
This study was supported by Bartın University Scientific Research Coordinator (Project number: 2018-FEN-A-018). I also thank to Dear Mr. Ali OZCAN, Director of Bartın Provincial Directorate of Environment and Urbanization for providing sediment bucket.
Notes
Author Contributions
G.G. (Ph.D.) conducted all the sampling, analysis and wrote the manuscript.