Investigation of flow dynamic characteristics of inverse fluidized bed biofilm reactor for degrading pharmaceutical based biomedical wastewater
Article information

Abstract
The paper investigates the flow dynamic behaviour of inverse fluidized bed biofilm reactor (IFBBR) for the treatment of pharmaceutical based biomedical wastewater. The residence time distribution (RTD) study has been employed as a tool to investigate the flow dynamic behaviour of wastewater within the reactor. The biofilm reactor is operated using Pseudomonas fluorescens for various ratios of settled bed volume to reactor working volume (Vb/Vr) with different superficial air velocities and examined their impact on flow dynamics. The outcomes of this study demonstrate the presence of dead volume and short circuiting in the reactor were reduced for the optimized (Vb/Vr) ratio of 0.20 and optimum superficial air velocity (Ug)m of 0.220 m/s. The potential of IFBBR was experimentally validated by analysing the chemical oxygen demand (COD) removal efficiency, total dissolved solids (TDS) and total suspended solids (TSS) emanating from the wastewater. Findings of this study reveals that maximum COD reduction of about 92% was achieved when the reactor was operated with (Vb/Vr)m of 0.20 with superficial air velocity, Ugm of 0.220 m/s showing the optimal operating parameters for IFBBR which has good mixing and less back mixing condition inside the reactor.
1. Introduction
Biomedical waste is the one which are generated in hospitals and health care facilities during diagnosis and treatment of either human beings or animals. These wastes may be either in the form of solid or liquid. The liquid waste generated from a health care facility is usually of type: infectious waste containing blood and body fluids, laboratory wastes, etc.; chemically hazardous waste such as formaldehyde, mercury, solvents, radioactive isotopes, etc.; pharmaceutical liquid waste of discarded/unused/expiry date medicines; photographic chemicals, etc [1]. Of these liquid waste, pharmaceutical liquid wastes account for the largest volume of waste produced by hospitals [2]. The pharmaceutical based liquid biomedical wastewater contains organic or inorganic solids and microbial contaminants which can be measured by the BOD and COD tests [3]. Most of the hospitals have effluent treatment plant facility which involves primary, secondary and tertiary treatment processes. Most of the existing systems and technologies being used in handling liquid biomedical waste are failing to address the problem of effective management of liquid waste. Treatment of biomedical pharmaceutical wastewater by inverse fluidized biofilm reactors is one of the promising technologies where it overcomes all the limitations of all other conventional reactors [4].
Inverse bio-fluidization is a technique which utilizes low density bio-particles. Fluidization can take place either by upward co-current flow of both gas and liquid phase or by downward movement of liquid and upward countercurrent movement of gas phase. In the first case, fluidization is done by the upward flow of gas which makes the bed of particles to expand downwards and in the second case, fluidization is achieved by downward flow of liquid phase. When the liquid flow is not sufficient to fluidize the particles, inverse fluidization can also be achieved by upward flow of gas [5]. Inverse fluidized bed biofilm reactor (IFBBR) can easily maintain the thickness of biofilm inside the reactor by particle-particle collision and particle-wall collision than conventional fluidized bed biofilm reactor (FBBR) [6]. IFBBR has greater contact between gas-liquid phases, lesser mass transfer resistance, larger surface area for bioparticles, rapid formation of biofilm over support particles and hence have higher biodegradation efficiency for the waste-water treatment processes [7]. Hence, IFBBR can effectively be used in the bio-treatment of pharmaceutical biomedical wastewater due to its high energy performance, low pressure drop, high gas hold up and high heat and mass transfer rates. Many researchers have studied the hydrodynamic characteristics of fluid flow in inverse fluidized bed reactor and studied the optimal operational parameters with respect to air velocity, gas hold up, bed volume, aspect ratio, etc [8–12]. Still studies are very limited in comparing the flow dynamics and biodegradation effects of pharmaceutical biomedical wastewater in IFBBR. Analyzing the mixing characteristics of the fluid in the treatment system plays a vital role as it affects both the efficiency of the treatment process and the hydrodynamic behavior of the reactor [13]. Studying the hydrodynamic behavior of the liquid flow helps to determine the residence time and distribution of fluid flow inside the reactor [14]. Good mixing promotes the degradation rate making the reactor system to approach ideal state [15]. In order to achieve a good fluidized reactor design, it is important to study the flow characteristics of the fluid inside the reactor. To overcome the limitation occurred in the real reactors, it is essential to design a reactor with less non-ideal effects such as short-circuiting, dead zones, etc. These non-ideal defects lower the performance of the reactor in either pilot plant or industrial scale [16]. All these defects in the flow dynamics can be identified by evaluating the residence time distribution and there by the degree of dispersion of the flow elements inside the inverse fluidized bed reactor [17].
In this research work, IFBBR performance was evaluated for treating liquid biomedical pharmaceutical wastewater by studying the flow dynamics of the fluid during the biodegradation process. The flow characterization inside the reactor was done by performing residence time distribution studies with various volume ratios of settled bed height to reactor working volume (Vb/Vr) and different superficial velocities (Ug) such as: for (i) Vb/Vr = 0.10, Ug = 0.089 m/s, 0.095 m/s and 0.099 m/s (ii) Vb/Vr = 0.20, Ug = 0.216 m/s, 0.220 m/s and 0.224 m/s (iii) Vb/Vr = 0.30, Ug = 0.274 m/s, 0.278 m/s and 0.281 m/s. The study revealed that the flow behaviour of IFBBR approached plug flow condition for (Vb/Vr) ratio of 0.20 with Ug of 0.220 m/s showing higher plug flow index and lower dispersion value compared to all others. The results were validated by carrying out degradation experiments in IFBBR using with same ratios of (Vb/Vr) and superficial velocities and reported the reductions in COD, TDS, TSS during the process of wastewater treatment. Thus, present study has been attempted to investigate the flow dynamic behavior of IFBBR and to compare with the experimental validation for the treatment of liquid biomedical pharmaceutical wastewater in the reactor. This is the novel approach which were not tried by any other researchers as per our knowledge and based on our literature studies.
2. Experimental Section
2.1. Experimental Set Up
IFBBR was designed with aspect ratio (H:D) of 10:1, working volume of 5 litres and operated under batch recirculation condition (Fig. 1) [18]. The support particles were low density polystyrene beads (non-porous) with 3.5 mm as diameter, 863 kg/m3 as density and 1.714 x 10³ m−1 as surface area to volume ratio of particles.

Schematic representation of Inverse Fluidized Bed Biofilm Reactor set up. (a) IFBBR (b) draft tube (c) conical insert (d) mesh (3.8 mm dia) (e) air pump (for fluidization) (f) air pump (to prevent settling of bioparticles) (g) peristaltic pump (h) flow control valve (i) recycle stream.
2.2 Pharmaceutical Biomedical Wastewater
Liquid biomedical pharmaceutical based wastewater was collected from a hospital effluent treatment plant unit in Madurai, India. The standard parameters of the wastewater is determined using APHA Standard Methods [19] and are presented in Table 1.

Characteristics of Pharmaceutical Based Liquid Biomedical Wastewater
2.3. Microorganism
The microorganism P.fluorescens was chosen for the degradation of pharmaceutical wastewater since it has the potential to degrade all organics using it as the sole carbon and energy source. Primary culture was prepared by transferring microorganisms into feed medium containing mineral salt medium [20] and pharmaceutical biomedical wastewater which were then kept in incubator to attain steady state growth. Secondary culture was then developed from primary and was used as inoculum for the formation of biofilm onto polystyrene support particles in IFFBR [21].
2.4. Experimental Procedure
2.4.1. RTD experiment
All RTD experiments were carried in IFBBR out with water as an electrolyte and HCl acting as a tracer in room temperature condition. At various ratios of settled bed volume to reactor working volume (Vb/Vr) such as 0.10, 0.20, 0.30 flowing at different superficial air velocities, water was allowed to pass into the reactor. In the pulse input mode, 5 mL of HCl was injected into the reactor entrance in continuous operation. The time and conductivity of the water was noted at regular intervals of time (30 s) at the reactor outlet. The experiment was about to end when the conductivity reduced to the level of normal water. The experimental value of exit age distribution E(t) was determined to optimize the flow characterization and performance of the reactor.
2.4.2. Pharmaceutical biomedical wastewater degradation studies in IFBBR
The bio-treatment of pharmaceutical based biomedical wastewater was carried out with 5 litre of effluent having initial COD in the range of 1,630-1,638 mg/L. Before the start of treatment process, the reactor was incubated with secondary culture of P.fluorescens for 2 days to encourage biofilm formation onto the support particles. The biomedical wastewater was then treated in IFBBR by varying the ratios of settled bed volume to reactor working volume with different superficial air velocities. The reactor was operated at room temperature with non-sterile condition. The treatment process was carried out until there was sufficient biodegradation of COD takes place inside the reactor. All the experiments were conducted in triplicate for each experimental condition to get the mean concordant value. Statistical analysis were done to find mean, variance standard deviation, standard error, etc. and incorporated in the figures of results and discussion section.
2.5. RTD Profiles and Its Design Parameters
The experimental determination of RTD was done by using the method of tracer response. curve is obtained by dividing the concentration of the tracer to its integral at time t. Using the following equation, E(t) curve can be evaluated [22]:
The characteristic RTD design parameters of fluid flow characteristics inside the reactor system can be determined from the below relations:
For the closed vessel configuration, the dispersion number
where σ2 is the variance in min2; tm is the mean residence time in min; D is the diffusion coefficient in (m2/s); u is the fluid flow velocity in m/s; L is the length of the reactor in m; Vr is the reactor volume in L; and Q is the volumetric flow rate of the fluid in (L/h).
To analyze the relationships between various RTD design parameters such as peak time (tp), hydraulic total residence time (τ) and mean residence time (tm), the following relations were used [13, 17]:
2.6. Measurement and Analysis for Degradation Experiments
During the bio-treatment of biomedical wastewater in IFBBR, samples were collected at regular intervals of time to determine COD, pH, oxygen transfer rate (OTR), volumetric mass transfer coefficient (kLa), biofim thickness, biofilm dry density and pH. All the determinations were done according to standard procedures and methods [19] whereas the biofilm thickness and dry density of biofilm were estimated from the net weight of the bioparticles [24–26]. The low-density support particles form a packed bed appearance at the top of the reactor once they were fed to the reactor column. By supplying the superficial air velocity, the bottom layer of the packed bed starts to fluidize. Then upon increasing the air flow velocity (minimum fluidization velocity) the bed started first to fluidize downwards with uneven distribution in the reactor. Upon further increase in air velocity (critical fluidization velocity), the bed fluidize completely with uniform concentration of bio-particles throughout the reactor [27–29]. All the experimental runs were carried out with superficial air velocity (Ug) which are equal to or greater than the critical fluidization velocity in IFBBR by varying the ratios of (Vb/Vr) with different Ug. The average gas hold up can be calculated by using the relation [30]:
where Vs, Vr are volume of solid particles and working volume of the reactor respectively; Zf, Zi are the aerated liquid level in the reactor column after fluidization and the initial liquid level before aeration, respectively.
3. Results and Discussion
The residence time distribution (RTD) studies were performed to study the effects of (Vb/Vr) ratio and superficial air velocities on fluid flow characteristics of the fluid inside the IFBBR. The performance of IFBBR was experimentally validated by investigating the biodegradation of pharmaceutical biomedical wastewater by varying the ratio of settled bed height to reactor volume (Vb/Vr) in the range of 0.10, 0.20 and 0.30 for various superficial air velocities Ug for each (Vb/Vr) ratio. To optimize the ratio (Vb/Vr) and superficial air velocity Ug with greater accuracy, experiments were performed for various ratios of (Vb/Vr) with three different superficial gas velocities Ug (i.e., for (i) Vb/Vr = 0.10, Ug = 0.089 m/s, 0.095 m/s and 0.099 m/s (ii) Vb/Vr = 0.20, Ug = 0.216 m/s, 0.220 m/s and 0.224 m/s (iii) Vb/Vr = 0.30, Ug = 0.274 m/s, 0.278 m/s and 0.281 m/s). All the experimental data were analyzed in triplicate and the removal efficiency of COD for different experimental runs was studied by conducting biodegradation experiments in IFBBR.
3.1. Effect of Superficial Air Flow Rates on Flow Dynamics
The effect of fluid flow characteristics in IFBBR was analyzed by evaluating various superficial air flow velocities (Ug) for different (Vb/Vr) ratios such as 0.1, 0.2 and 0.3. The effect of flow velocities was found to be significant on the obtained RTDs and on the fluid flow behavior in the IFBBR. Fig. 2 shows the exit age distribution curve for various air flow velocities. The non-symmetrical curve shows the presence of short circuiting or bypassing along the reactor [31]. From Fig. 2, it was found that the peak points in E(t) curve reached the highest value of 0.85 for the superficial air velocity (Ug) of 0.220 m/s for the (Vb/Vr) ratio of 0.2 which has good mixing condition and lack of short circuiting characteristics. Thus, the flow behavior for the air flow rate of 0.220 m/s have sufficient dispersion takes place between air and liquid phases with no dead zone and less short circuiting when compared to all other flow rates. The curve also approached near symmetrical for 0.220 m/s depicting much less short circuiting condition along the reactor length and thus the flow in IFBBR tends to act ideal under this condition.
Exit age distribution E(t) curve for various (Vb/Vr) ratio and different air flow velocities.
Table 2 shows the various design parameters evaluated using the data of RTD experiments obtained for different superficial air flow velocity in IFBBR. It shows that upon increasing the flow rate, there is a decrease in the time spent by the fluid elements inside the reactor, and on further increase in the flow rate above 0.262 m/s it should have a minimal effect on the total residence time. Table 2 depicts the value of plug flow index upon increasing the flow rate of the effluent; it approached a higher value of 0.333 for the superficial air flow velocity of 0.220 m/s. This shows that the liquid flow behavior of IFBBR approaches to plug flow condition with sufficient dispersion takes place between air and liquid phases inside the reactor. The calculation depicts the occurrence of a dead or stagnant zone was found to be less and the effect of short circuiting is removed at air flow velocity of 0.220 m/s. The dispersion number shown in Table 2 also supports the results.
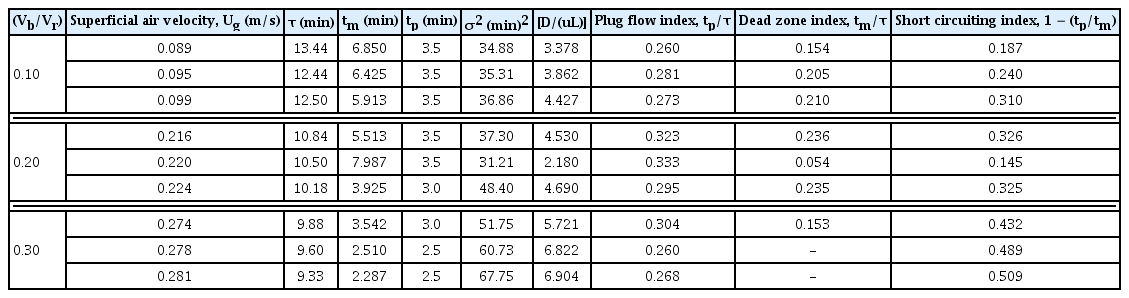
Parameters Obtained Using the Data of RTD Experiments
The variance (σ2) and dispersion (D) influence on the efficiency of the reactor to degrade the effluent. RTD data discussed above have been compared with the experimental results of the treatment studies of pharmaceutical based liquid biomedical wastewater, carried out with same set superficial air velocities and (Vb/Vr) ratio. The plug flow behavior for the optimized air flow velocity at 0.220 m/s with (Vb/Vr) of 0.20 from the RTD analysis matches well with the experimental degradation studies in IFBBR producing higher percentage of COD removal and are discussed in Sections 3.2 and 3.3.
3.2. Effect of Superficial Air Flow Velocity and (Vb/Vr) Ratio on COD Removal
Experiments were carried out for various ratios of (Vb/Vr) with different superficial air velocities (Ug) to treat pharmaceutical biomedical wastewater. The applied superficial air velocity (Ug) were equal to or greater than the critical fluidization velocity below which the fluidization of bio-particles were not uniform throughout the reactor [29]. Experiments were carried for the (Vb/Vr) ratios of 0.10, 0.20 and 0.30 with its respective superficial air velocity, Ug.
It can be seen from the Fig. 3 that COD reduction was found to be more for less (Vb/Vr) ratio. There found to be an optimal superficial air velocity at which the COD reduction attained high (92%) compared to all other air velocity. Table 3 shows optimal superficial air velocity, Ugm with respect to COD reduction in IFBBR.
Variation of COD values with time for various ratios of (Vb/Vr) and superficial air velocities, Ug.
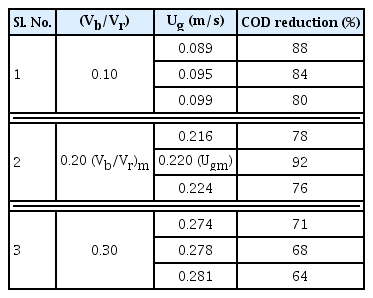
Optimum Superficial Air Velocity (Ugm) with Respect to COD Reduction
It can be noticed from Fig. 3 and Table 3 that largest COD removal of 92% was attained when (Vb/Vr) = 0.20 at its optimal superficial velocity, Ugm = 0.220 m/s. An increase in COD removal with an increase in (Vb/Vr) from 0.10 to 0.20 can be attributed to the fact that for the increasing (Vb/Vr) there will be more biomass grown on large volume of particles resulting in higher degradation of biomedical wastewater. But with further increase in (Vb/Vr) from 0.2 to 0.3, larger volume of the reactor was occupied by support particles leading to higher solid hold up which worsen the phase mixing characteristics of the reactor resulting in decrease in treatment efficiency [32–34]. (Vb/Vr) ratio of 0.3 was found to be the critical value above which the fluidization of bio-particles was not possible and the particles would settle as a bed at the top of the reactor. Thus, (Vb/Vr)m = 0.20, Ugm = 0.220 m/s were found to be the optimal hydrodynamic operating parameters at which the COD reduction were found to reduced from 1,630 to 130 mg/L at a maximum with 92% removal efficiency. The results were well supported by the mass transfer studies in section 3.3
3.3. Effect of Superficial Air Velocity on Mass Transfer Coefficient (kLa), Oxygen Transfer Rate (OTR) and Biofilm Characteristics for Various Ratios of (Vb/Vr)
Table 4 shows the effect of superficial air velocity on mean values of volumetric mass transfer coefficient (kLa), OTR and biofilm characteristics for various (Vb/Vr) ratios. From the Table, it is evident that for the optimal superficial air velocity (Ugm) there will be higher COD reduction in the treatment process due to higher volumetric mass transfer coefficient kLa and oxygen transfer rate (OTR).
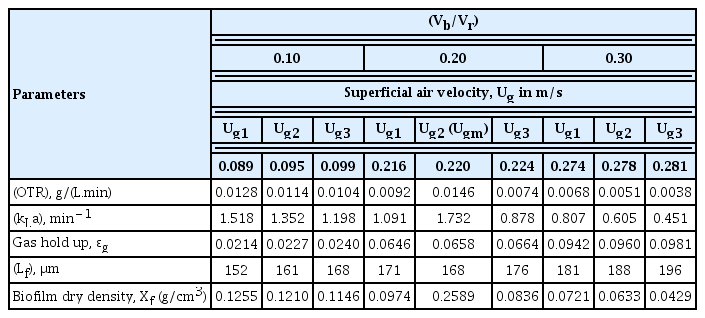
Effect of Superficial Air Velocity on kLa, OTR and Biofilm Characteristics
In IFBBR, the gas hold up (ɛg) and bubble size (db) increases with increase in Ug. ɛg and db play a vital role in increasing the interfacial area (a), thereby the OTR and mass transfer coefficient (kLa). If these parameters, have the relation of a = 6ɛg/db, the increase in ɛg produces higher a, but the increase of bubble size db decreases a. When the increase rate of ɛg dominates over that of db, the kLa increases. Because of these two competing effects, the increasing trend of kLa becomes insignificant with increasing Ug [24]. Thus at the optimal condition of Ug, ɛg dominates over the bubble size db and have a significant effect in increasing the mass transfer rate and thereby the COD removal efficiency. At the optimum superficial velocity (Ugm), it was found that a compact and stable biofilm structure was developed on the bioparticle. The bioparticle with compact and stable biofilm (Lf at Ugm) had highly dense biofilm with higher biofilm dry density, Xf (0.2545 g/cm3) due to extra biomass growth in the base biofilm [35]. Above Ugm, the biofilm thickness was found to be more having less biofilm dry density and the thickness could not be controlled by the detachment force anymore thereby decreasing the performance of the biomass inside the reactor.
3.4. Physiochemical Analysis of Treated Pharmaceutical Based Biomedical Wastewater
The pharmaceutical biomedical wastewater was initially characterized for its physiochemical parameters as per APHA standard methods [19] and it was then treated with IFBBR [36, 37]. Table 5 shows the physiochemical characteristics of the treated pharmaceutical biomedical wastewater. The pH of treated wastewater was found to be 8.3 which showed that the treatment had changed acidic nature of wastewater to above neutral. The chemical oxygen demand (COD), total dissolved solids (TDS) of dissolved organic matter and suspended solids (TSS) in the wastewater were measured and percentage of removal was found to be 92%, 90% and 96% respectively and were found to be well below the prescribed standard limits of biomedical waste reuse system [1, 2].

Physiochemical Characteristics of Pharmaceutical Based Liquid Biomedical Wastewater before and after Treatment in IFBBR
4. Conclusion
The research work investigated the flow dynamic characteristics of IFBBR for the treatment of liquid biomedical wastewater.
The RTD method was used to understand the flow dynamic behaviour of the reactor and the results showed that the plug flow index approached a higher value of 0.333 for the superficial air flow velocity of 0.220 m/s and (Vb/Vr) of 0.2. Under this optimal condition, there exist sufficient dispersion between air and liquid phases inside the reactor with less occurrence of dead zone.
The optimal plug flow behaviour from RTD analysis matches well with the experimental biomedical wastewater treatment studies in IFBBR producing higher percentage of removal of COD (92%), TDS (90%) and TSS (96%).
Mass transfer effects were also evaluated at the optimal operating conditions of IFBBR. For the optimal superficial air velocity (Ugm) there will be higher COD reduction in the treatment process due to higher kLa (1.732 min−1) and OTR (0.0146 g/(L.min)).
Nomenclature
a
gas-liquid interfacial area, m2/m3
COD
chemical oxygen demand, mg/L
db
bubble size, m
kLa
volumetric mass transfer coefficient, min−1
Lf
biofilm thickness, μm
OTR
oxygen transfer rate, g/(L.min)
t
operation time, h
Ug
superficial air (gas) velocity, m/s
Ugcr
critical fluidization velocity, m/s
Ugm
optimized superficial gas velocity, m/s
Vb
volume of settled bed height, m3
Vr
volume of reactor (working volume), m3
Zf
aerated liquid level in column after fluidization, m
Zi
initial liquid level in column before aeration, m
ɛg
gas hold up
ɛs
solid hold up
ɛl
liquid hold up
Acknowledgments
The authors extend their appreciation to the Deanship of Scientific Research at Majmaah University for funding this work under Project Number. RGP-2019-33.
Notes
Author Contributions
S.B.S. (Professor) and M.Y.S. (Associate Professor) collected the data and conducted all the experiments, P.N.B (Associate Professor) and M.B (Associate Professor) organized the flow of this research and worked in drafting this article, ABA (Engineer) and NMSA (Manager) carried out the statistical analysis and conclusions.