Time series analysis for determining ecologically acceptable Cu concentration from species sensitivity distribution with biotic ligand models in soil pore water
Article information

Abstract
A site-specific, ecologically acceptable concentration of Cu in soil pore water was determined with four trophic levels of soil-residing organisms. Specifically, soil pore water was periodically collected from a site contaminated with heavy metals using in-situ samplers. Dissolved Cu concentration, Ca2+, Mg2+, Na+, K+, Cl−, SO42−, NO3−, dissolved organic carbon, pH, and temperature were analyzed to derive a half-maximal effective concentration of Cu (EC50[Cu]T) using a biotic ligand model (BLM). The BLM parameters, such as binding constants (logKXBL) and the fraction of biotic ligand sites occupied by Cu ions (f), were adapted from previous studies. The EC50{Cu2+} values were used to construct a species sensitivity distribution (SSD) curve from which the hazardous concentration, protecting 95% of the soil-residing organisms (HC5), was determined. Using ten BLM-based acceptable concentrations of Cu obtained by combining BLM and SSD, time series analysis was conducted with the fixed monitoring benchmark method to obtain maximum Cu concentration as an endpoint exhibiting no-adverse-effect which was found to be 0.084 mg/L of Cu in soil pore water at the test site. This study provides a systematic tool for determining an ecologically acceptable concentration of Cu in the soil by incorporating soil pore water chemistry and time series analysis.
1. Introduction
It is well established that the total concentrations of heavy metals in the environmental media do not always represent their adverse effects on living organisms. This is because they can exist in various chemical forms (i.e., dissolved, labile, less labile, or residual forms), and thus, exhibit different bioavailability. To quantify the toxic fractions of heavy metals in the aquatic system, the biotic ligand model (BLM) was introduced [1]. The model originated from the gill surface interaction model [2], which investigates the toxic effects of trace metals to fish caused by the metal complexation on fish gill, pH, and cation (i.e., Ca2+, Mg2+) concentrations. Instead of fish gill, the BLM extends its concept to be applicable to other living organisms. Biotic ligands (BL) exist in the cell membrane of an organism, and heavy metals compete for the ligand sites with cations (and possibly anions) and dissolved organic carbon. Only the heavy metals bound to the ligand sites exhibit toxicity to the organism [1, 3–6].
The terrestrial BLM (TBLM) [6], developed to extend the concept and application of BLM to the terrestrial environment, predicts the toxic effects of heavy metal on the soil-residing organisms. Given that the toxicity of soil solution or soil pore water is highly correlated to the soil toxicity [7, 8], soil pore water toxicity can be a good proxy for soil toxicity from heavy metals contamination. The BLM concept can be applied to derive pore water toxicity without an extensive set of toxicity tests, which are time-consuming and expensive when using soil-residing organisms such as plants and earthworms. Using the TBLM, Thakali et al. [6] demonstrate that it is a better indicator for Cu and Ni ecotoxicity in soil than the total metal model or the free ion activity model and thus predicts a reasonable, effective concentration for soil biota.
However, the characteristics of soil pore water could change depending on the environmental conditions. Moreover, differently measured characteristics, within each sampling time (including from the same sampling location), inevitably alters the BLM predictions (e.g., the predicted half-maximal concentration (EC50) values). For example, water characteristics (e.g., pH, DOC, Ca2+, Mg2+, Na+, SO42−, HCO3−, and Cl−) of the Dommel tributary of the Meuse River in the Netherlands were measured for 42 months [9] and pH and DOC varied the most in the ranges of 6.8–7.4 and 7–13 mg/L, respectively. Such variations resulted in different BLM-predicted EC50 values as the model takes into account the effects of water characteristics on heavy metal speciation and its toxicity.
Furthermore, the BLM targets one species and predicts toxic effects on it. Commonly used fish species include the rainbow trout and fathead minnow or Daphnia magna as the water flea. The BLM predicts the possible toxic effects of heavy metal on the target species, and therefore its prediction is species-specific. To provide the BLM prediction as an ecologically acceptable concentration in the designated area, it is critical to consider the toxic effects on multiple species.
To overcome such limitations and derive a representative site-specific value, a probability-based method using an array of BLM-predicted EC50 values was proposed [10]. The fixed monitoring benchmark (FMB) method incorporates time variability of changing environmental factors, which influence the speciation of Cu and its toxicity, into BLM prediction to yield a single monitoring benchmark that is site-specific. The methodology assesses whether the current dissolved Cu concentrations exceed the BLM predictions more frequently than the target exceedance frequency, which is once in three years. The FMB is an allowable maximum Cu concentration that is possible to attain while being compliant with the BLM predictions. Ryan et al. [11] applied the FMB approach to 61 different sites from the United States geological survey monitoring stations with at least two years of data. The calculated FMB values in each station varied considerably, i.e., from 1.65 to 152 μg/L, depending on spatiotemporal differences in water characteristics.
This study constructed species sensitivity distribution (SSD) for Cu with terrestrial BLM predictions (i.e., EC50 values) of ten soil-residing organisms based on the physicochemical properties of soil pore water. These properties were collected for five months near an abandoned smelter site in South Korea. Moreover, time-series, with biological endpoints (i.e., hazardous concentrations such as HC5), was conducted to derive a site-specific ecological benchmark representing pore water quality using FMB methodology. For the first time, this study introduced the concept of FMB to determine the ecologically acceptable Cu concentration in soil pore water. In the soil, the pore water is likely to exist as non-equilibrium status depending on the amount of precipitation, runoff, or antecedent dry days. Therefore, it is necessary to acquire time-series data of pore water characteristics and consider its impact in determining the ecologically acceptable Cu concentration in the region.
Furthermore, the methodology introduced in this study derives the Cu concentration that is valid to multiple soil-residing species. This is achieved by incorporating the concept of SSD to overcome the limitation of the site-specific BLM method. The Cu concentration derived using soil pore water characteristics, in this study, would be used as a good indicator for soil toxicity and can replace the previous bioassay test that was commonly performed in the soil.
2. Material and Methods
2.1. Mathematical Description of BLM
The BLM assumes that free metal ions bind to active binding sites, known as biotic ligand(BLs), at the organism-water interface and cause toxicity. Cations, such as H+, Ca2+, and Mg2+, compete with the free metal ions for the BL sites and alleviate metal toxicity by inhibiting their binding to the BLs. Therefore, the total BL site concentration, [TBL] (mol/L), is given by Eq. (1):
Where: [BL−] is the unoccupied BL concentration (mol/L), and [XiBLn+] is the concentration of cations or metal-BL complexes (mol/L).
Using the equilibrium relationship,
Where: {Xi} is the chemical activity of cations or metals (mol/L), and KXBL is the conditional binding constant for metals or cations bound to BL sites (L/mol).
Eq. (1) can be re-written as follows:
The fraction of BL sites occupied by toxic metals (f) is expressed as follows:
Finally, the EC50, expressed as Cu2+ activity can be calculated using Eq. (5), derived by re-arranging Eq. (4).
Where: f50 is the BL required to be occupied by free metal ions to exhibit a 50% toxic effect. The conditional binding constant, KXBL, differs for different species because the available BL differs.
2.2. BLM Parameters for Various Species
The logKXBL and fCuBL50% are two major BLM parameters that are distinct for each species and used to determine EC50{Cu2+}. LogKXBL refers to a log of the conditional equilibrium constant that indicates a binding interaction between free ions and the biotic ligand in the cell membrane of the target organism, while the fCuBL50% is a fraction of the BL sites occupied by Cu2+ and present 50% toxic effects to the organism. Different logKXBL and fCuBL50% values collected for ten various soil organisms, from previous studies, are listed in Table 1. The logKCuBL, logKCaBL, logKMgBL, logKNaBL, logKHBL and fCuBL50% were in the following ranges in 10 soil-residing organisms: 2.98 to 7.41, 2.12 to 3.38, 2.58 to 3.34, 2.97, 4.17 to 7.5, and 0.0046 to 0.436, respectively (see Table 1). The BLM parameters obtained from different species with different toxicity test procedures, which followed standardized methods, were subjected to the BLM (Eq. (5)) to derive EC50{Cu2+} values.

Various BLM Parameters for Ten Different Soil Organisms
2.3. Soil Pore Water Sampling
Soil pore water samples were obtained from a closed smelter site in South Korea. The site is contaminated with heavy metals due to the presence of a long-term refinement activity. The soil pore water samplers (SICS20, UMS, Germany) were placed under ten cm-deep soil for two weeks. A motor was used to adjust the pressure inside the sampler to below −0.5 bar. Nine samplers were placed at the site from June to November 2017, and 10 pore water samples were collected during the monitoring period.
2.4. Pore Water Analysis
The collected pore water was extracted from the sampler with a syringe and moved to a laboratory in 50-mL conical tubes. The cation concentrations (i.e., Mg2+, Ca2+, Na+, and K+) and dissolved Cu concentrations of 10 pore water samples were analyzed by inductively coupled plasma optical emission spectroscopy (iCAP 7400 ICP-OES, Thermo Fisher Scientific, USA). In contrast, the anion concentrations (Cl−, PO43−, SO42−, and NO3−) were determined by ion chromatography (ICS-3000, Dionex, USA), while dissolved organic carbon (DOC) was measured using a total organic carbon analyzer (Sievers 5310 C, GE, USA).
2.5. Converting Ion Concentrations and Activities
The obtained ion concentrations from soil pore water were converted to activities using the Visual MINTEQ 3.1 [12] speciation model, using the environmental factors of the sampling site as input variables, such as pH, DOC, and ion concentrations. The model simulated the environment of the site based on the measured concentrations of the factors, suggested the possible speciation of each ion under the given condition, and calculated their activities.
The values of the converted activities were inserted into Eq. (5) to calculate the effective concentration with 50% toxic effects (EC50), expressed in activity form. When the site-specific EC50 is calculated using the BLM equation, it needs to be converted back to concentration to make it readily applied to the site. To convert the calculated EC50 in the form of activity to concentration, Visual MINTEQ 3.1 was used and to calculate the Cu concentration with the same ion activity as EC50{Cu2+}. The model used the same input variables and estimated the Cu concentration repeatedly until it reached the target EC50{Cu2+} within a 5% margin of error. CO2 is at equilibrium between the water and air, and the CO2 pressure (PCO2) is set at 0.00038 atm.
2.6. Establishment of Species Sensitivity Distribution for Cu
Generally, laboratory bioassays for toxicity tests are conducted with one species and provide species-specific results. However, numerous species exist in natural systems and react differently when they are exposed to certain toxic chemicals. Therefore, additional data for toxicity tests are required to evaluate the toxic effects of the chemicals and reduce the model errors caused by the different responses of multiple species.
Species sensitivity distribution (SSD) is a cumulative distribution function that indicates the toxic effects of individual or multiple contaminants on a species population. Typically, the left tail of the distribution is cut at 5%, and the concentration that protects 95% of the population is determined (i.e., 5% hazardous concentration, HC5). Van Straalen and Denneman [13] suggest a method to determine HC5 by performing extrapolation on bioassay data independently. The method is useful as there is a limited number of species available for laboratory toxicity tests.
In this study, EC50{Cu2+} values for ten different species in each soil pore water sample were obtained using the BLM over the monitoring period. The species include six plants (i.e., Vitis vinifera, Triticum aestivum, Lycopersicon esculentum, Lactuca sativa, Hordeum vulgare, and Funaria hygrometrica), one soil organism (i.e., Folsomia candida), two invertebrates (i.e., Eisenia fetida and Aporrectodea caliginosa), and soil microbes tested with glucose-induced respiration. From the EC50 values of each species, a cumulative density function (CDF) was generated for ten soil pore water samples using ETX 2.0 [14]. Using the CDF, the concentration influencing 5% of the species population is found to be within the safety range protecting the remaining 95% (i.e.,
2.7. Fixed Monitoring Benchmark Methodology
The HC5s for each soil pore water sample were obtained from the SSD based on the BLM predictions, which considered pH, DOC, or ion concentrations as significant parameters. However, these parameters change over time resulting in different predictions for both EC50s and HC5s, along with the dissolved Cu concentration. HydroQual [10] suggests a new method to establish a monitoring benchmark for copper at a specific site when the BLM-based instantaneous water quality criteria (IWQC) change. The method incorporates temporal variability into the IWQC and dissolved Cu concentrations in the stream water. This approach yields a single number as the Cu monitoring benchmark, denoted as the fixed monitoring benchmark (FMB), which is obtained from the following procedure developed by HydroQual [10]. The toxic unit (TU) is defined as:
where TUi is the TU value for a single sample collected at time i, Cui is the Cu2+ concentration in the site water for a specific sample, and IWQCi is the BLM-predicted safe concentration of Cu. The TU values from each sample form a distribution to determine the new Cu2+ concentrations that comply with the IWQC (i.e., Cui,comp). This Cui,comp concentration may be higher or lower than the initial Cu2+ concentrations in site water (Cui) depending on the target exceedance frequency (EF). In this study, the EF is once every three years, which was recommended by the published water quality criteria guidance document [15] because it takes approximately three years for a natural system to recover after an exceedance event. Therefore, the EF is one day out of 1095, yielding 0.000913 as the frequency, indicating that the distribution of TU should not have values higher than more frequently than 0.0913% of the time. In other words, TUi should be kept below one 99.9%, and the TU value at the specified EF can be calculated as follows:
where ZEF is the number of standard deviations of standard normal distribution, sTU is the standard deviation of the log-transformed TU values, and TUMedian is the median value of TU. ZEF is 3.117, based on the standard normal distribution with the probability of 0.000913. Depending on the calculated TUEF value (i.e., higher or less than 1), the TU distribution can be adjusted to TUEF = 1 by multiplying the inverse of the TUEF as described in Eq. (8) as an adjustment factor (AF). Then, it is possible to estimate the new distribution of Cu2+ concentrations, Cui, comp, which is a concentration adjusted from the Cu concentration of the site water and multiplied by an adjustment factor (AF) (Eq. (9)) and satisfies TUEF = 1.
The compliant TU distribution is composed of Cu2+ concentrations in compliance with IWQC:
The acute FMB is a value from the revised Cu2+ distribution (Cui, comp) at the specified EF of 99.9%:
where CuMedian,comp is the median value of the compliant Cu2+ distribution, and sCu is the log-transformed standard deviation of the original Cu distribution.
In this study, the HC5s from the SSD were used as IWQC and compared with the dissolved Cu concentrations measured in soil pore water samples.
3. Results and Discussion
3.1. Acquisition of Field Monitoring Data
Environmental factors that affect the speciation of Cu in soil pore water, i.e., pH, dissolved organic carbon (DOC), and major ion concentrations, were analyzed (see Table 2). Overall ranges were from 6.21 to 7.54 in pH, 4.25 to 12.9 mg/L in DOC, 63.0 to 108.0 mg/L in Ca2+, 1.10 to 6.71 mg/L in K+, 29.2 to 42.1 mg/L in Mg2+, 59.9 to 121.5 mg/L in Na+, 11.6 to 150.0 mg/L in Cl−, 22.8 to 353.1 mg/L in SO42−, 1.2 to 15.0 mg/L in NO3−, and 0.01 to 0.77 mg/L in Zn2+. Dissolved Ni and Cd concentrations were also detected, but they were insignificant when compared to other ion concentrations, which varied from 0.002 to 0.030 and from 0.007 to 0.015 mg/L, respectively. Concentrations of Pb and As were also analyzed, but they were below the limit of detection, which was 0.03 μg/L. The concentration of dissolved Cu in the pore water originating from the contaminated soil was in a range between 0.01 and 0.10 mg/L. Although Zn, Ni, and Cd exist in pore water, the BLM is designed to predict the ecotoxicity of the target heavy metal, which is, in this study, Cu. The model quantified the fraction of free Cu2+ ion bound to the BL as it is a measure of ecotoxicity. Other heavy metals are improbable to influence the formation of free Cu2+ ion, and thus their contribution to Cu toxicity in organisms is insignificant. When compared with the minimum and the maximum values of the measured concentrations of the environmental factors, the factors differed by 3, 1.7, 6.1, 1.4, 2, 12.9, 15.5, 12.5, 9.9, 97.9, 16.7, and 2.1 times in DOC, Ca2+, K+, Mg2+, Na+, Cl−, SO42−, NO3−, Cu2+, Zn2+, Ni2+, and Cd2+, respectively, over the monitoring period. In contrast, the difference was only 1.2 times in pH. Such differences led to the change of the Cu speciation as the factors form organic and inorganic complexes, which influence the binding status of free Cu2+ ion to the BL. The change of available free Cu2+ ion resulted in different BLM predictions because the bioavailability of Cu also changed. Therefore, the time variability in the environmental factors, which compose the BLM parameters, is an important factor influencing the BLM predictions. Therefore, it should be considered when determining an acceptable concentration of Cu in the monitoring region.
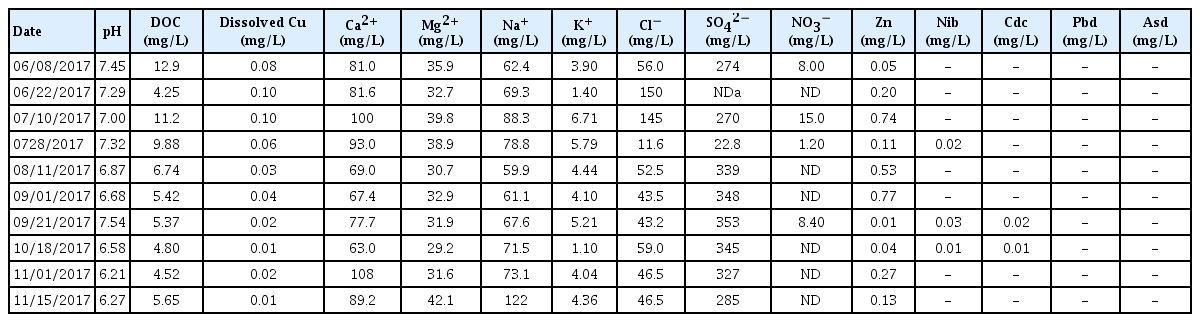
Chemical Composition of Soil Pore Water Collected from Field-installed Samplers
3.2. Derivation of Ecotoxicological Endpoints from Species Sensitivity Distribution
With the in-situ monitoring data and BLM parameters (see Table 2), BLM-based toxicological endpoints for ten soil-residing organisms at each sampling time were calculated using Eq. (5) and the computed EC50{Cu2+} values expressed as Cu activity for each species per each sampling time are listed in Table 3. The EC50{Cu2+} values had the following ranges: 1.57E-06 to 1.77E-06 M for Vitis vinifera, 1.04E-06 to 1.48E-06 M for Triticum aestivum, 1.18E-07 to 1.20E-07 M for Lycopersicon esculentum, 2.36E-08 to 4.81E-08 M for Lactuca sativa, 2.23E-09 to 5.86E-09 M for Hordeum vulgare, 1.18E-06 to 1.31E-06 M for Folsomia candida, 3.05E-05 to 5.10E-05 M for Funaria hygrometrica, 1.70E-08 to 2.48E-08 M for Eisenia fetida, 9.90E-07 to 1.69E-06 M for Aporrectodea caliginosa, and 2.05E-08 to 2.20E-07 M for the microbes with glucose-induced respiration. The extent of the computed EC50{Cu2+} values indicates the sensitivity of the organism to the exposure of free Cu2+ ion. Among the target organisms, Hordeum vulgare is the most sensitive to Cu toxicity, and Funaria hygrometrica is the least sensitive.
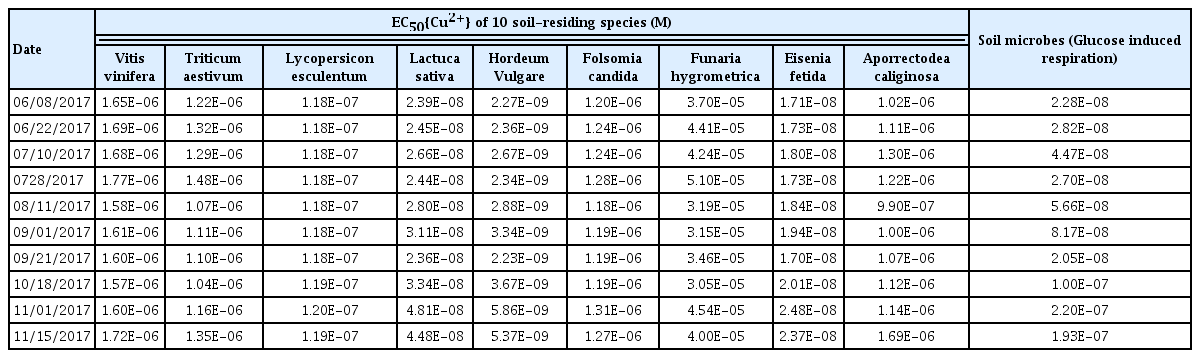
BLM-derived Ecological Endpoints (EC50{Cu2+}), Which is Expressed as Cu2+ Activity Giving 50% Toxic Effects to the Targeted Species, of Each Compositions
The BLM-based toxicological endpoints, which are EC50{Cu2+}, for the ten species at a given sampling date, were used to construct a species sensitivity distribution (SSD). By combining the toxicity results of different target organisms, it yielded the activity of free Cu2+ ion and the fraction of affected organisms based on the statistical model. The level of activity determined here indicated a toxic effect of Cu on multiple soil-residing organisms. This process was repeated with the BLM endpoints obtained from the ten sampling dates, and the results are shown in Fig. 1. The obtained HA5 values using the BLM were converted to HC5 values considering the chemical composition of pore water by using Visual MINTEQ3.1 [12]. The derived HA5 and HC5 from the individual SSD curve at each sampling date are shown in Table 4. During the monitoring period with the ten sampling events, a total of ten HC5 values were obtained from the ten soil-residing species and varied from 0.02 to 0.14 mg/L due to the different compositions of ten pore water samples.
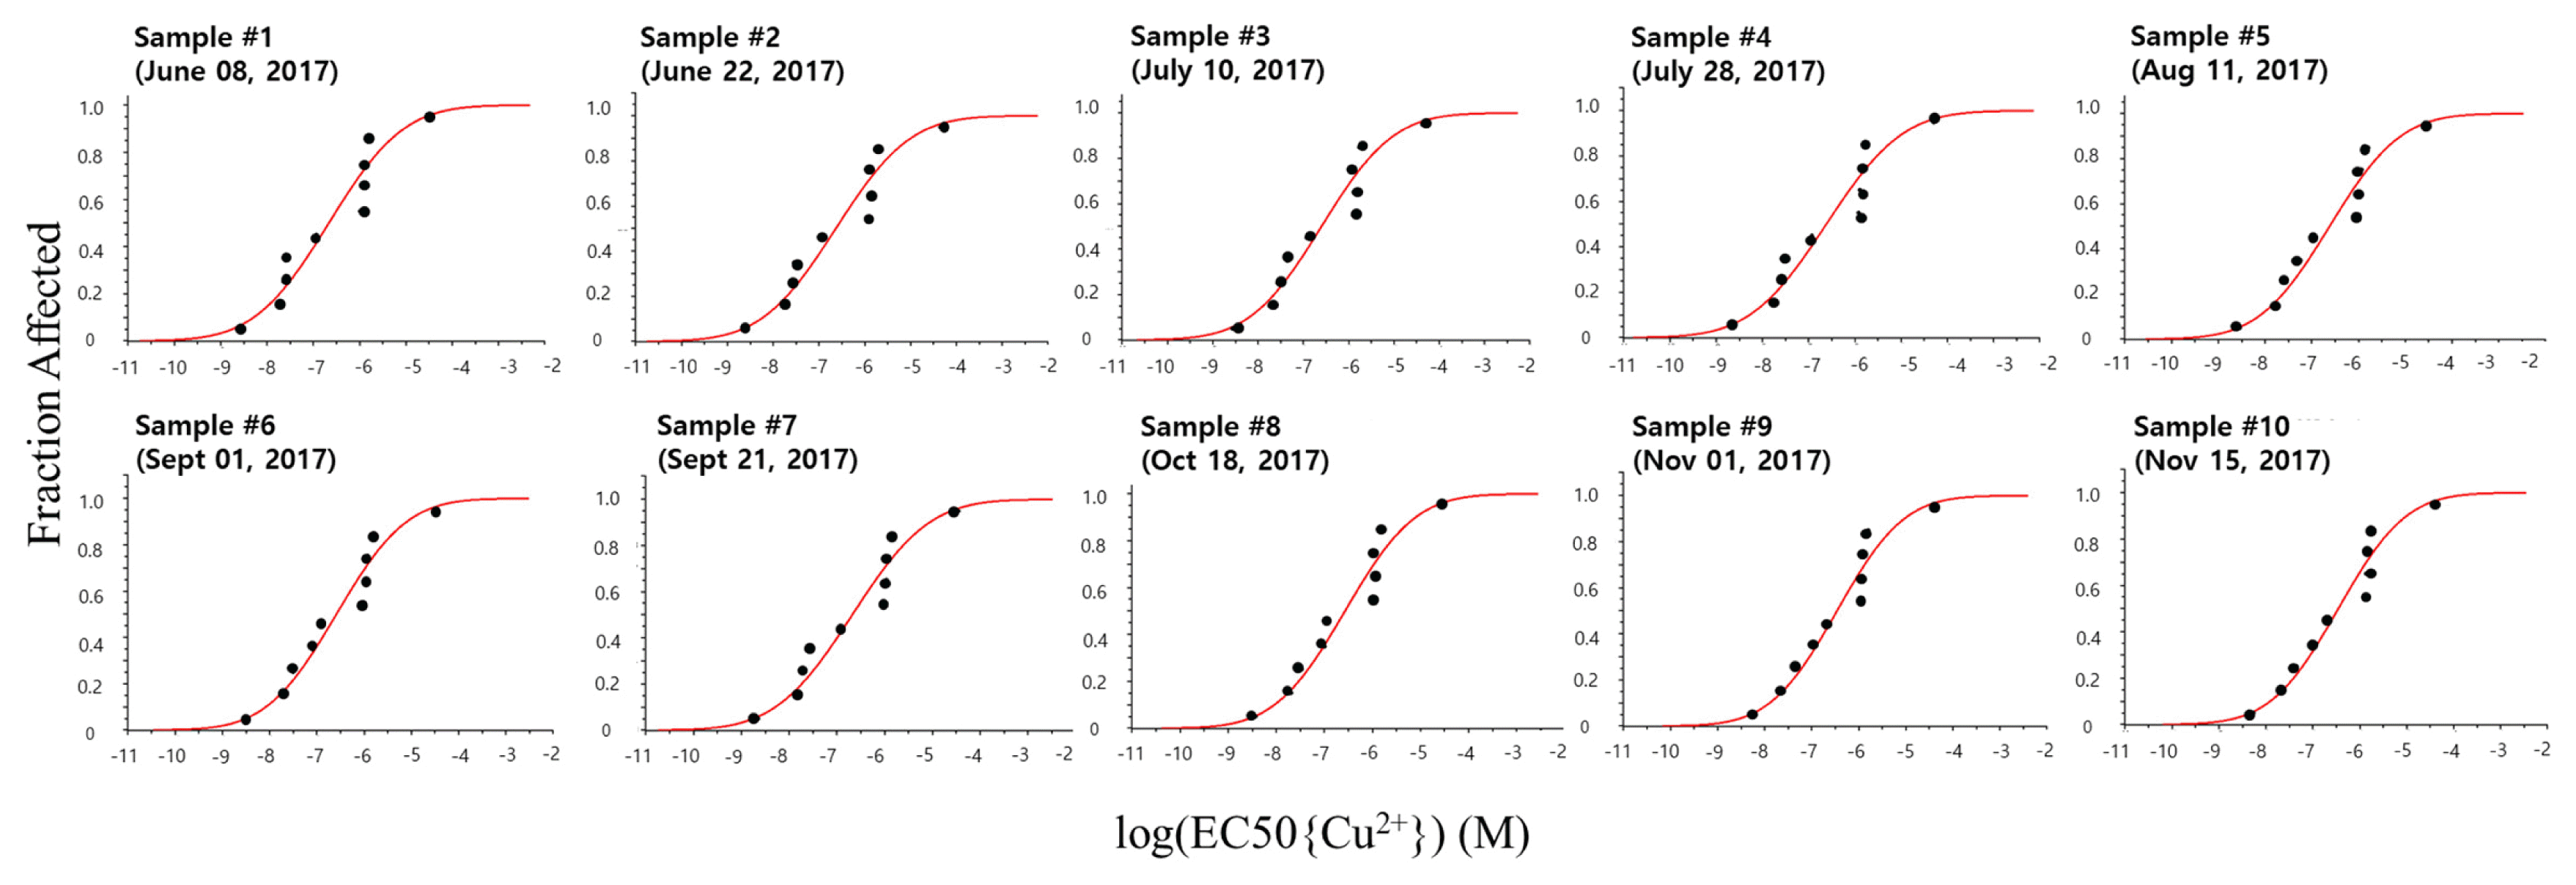
Species sensitivity distributions composed of 50% effective concentration (EC50{Cu2+}) calculated using the biotic ligand model for ten different species in soil. Each distribution is generated from each soil pore water sample. The obtained EC50{Cu2+} values for each species are indicated in Table S2.
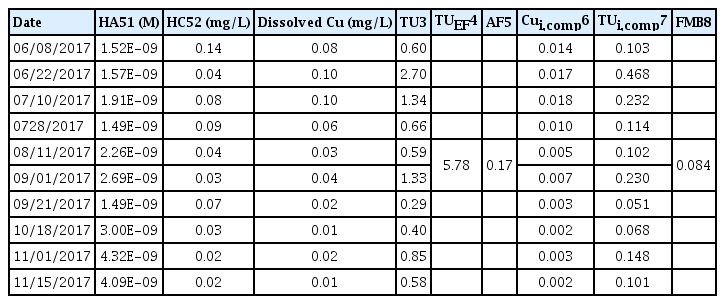
Parameters Needed for a Time-series Analysis of Soil Pore Water Samples to Derive a Fixed Monitoring Benchmark (FMB)
3.3. Time Series Analysis with HC5s Derived from the SSD
When the obtained HC5s vary over time due to changing soil pore water characteristics, there are multiple methods available to choose one fixed value. The average of those time series HC5s is 0.05 mg/L in this site, which may imply that the toxicity is under or overestimated. Selecting a 95% upper confidence limit would be another method for choosing one representative number, and it is widely used for various statistical assessments, including risk assessment. Using ProUCL 5.0 software [16], the 95% UCL of the HC5s was 0.076 mg/L.
The 95% UCL yields a concentration that is selected among the given HC5s, which were calculated based on the BLM. The model only accounts for the effects of cations, which influence the Cu speciation and its toxicity, but does not include dissolved Cu concentration at the site in its calculation. This indicates that the concentration calculated from the 95% UCL is based on predictions, and thus it would be appropriate to suggest a certain level of Cu concentration. However, to assess whether the Cu concentration in the current environmental system complies with the recommended level, the comparison with the dissolved concentration of Cu is needed.
The current study incorporated the concept of time series analysis into the BLM-based HC5s to derive an acceptable Cu concentration as a monitoring guideline tool in the given monitoring region. The changes of Cu concentrations and HC5 values in the soil pore water samples are plotted in a probability distribution from less to greater possibilities of occurrence in Fig. 2(a). The dissolved Cu concentrations in soil pore water varied from 0.01 to 0.1 mg/L, while the HC5 values ranged from 0.02 to 0.14 mg/L. The ratio of Cu concentration to HC5 is defined as a toxic unit (TU), which exceeded 1 in the 2nd, 3rd, and 6th samples, i.e., 2.70, 1.34, and 1.33, respectively. The solid lines are descriptions of linear regression, and the vertical dashed line indicates the specified exceedance frequency (EF) of 99.9%. At this specified EF, the extrapolation of the TU distribution is 5.78, meaning that the Cu concentration is likely to exceed the HC5 5.78 times more frequently than the target EF.
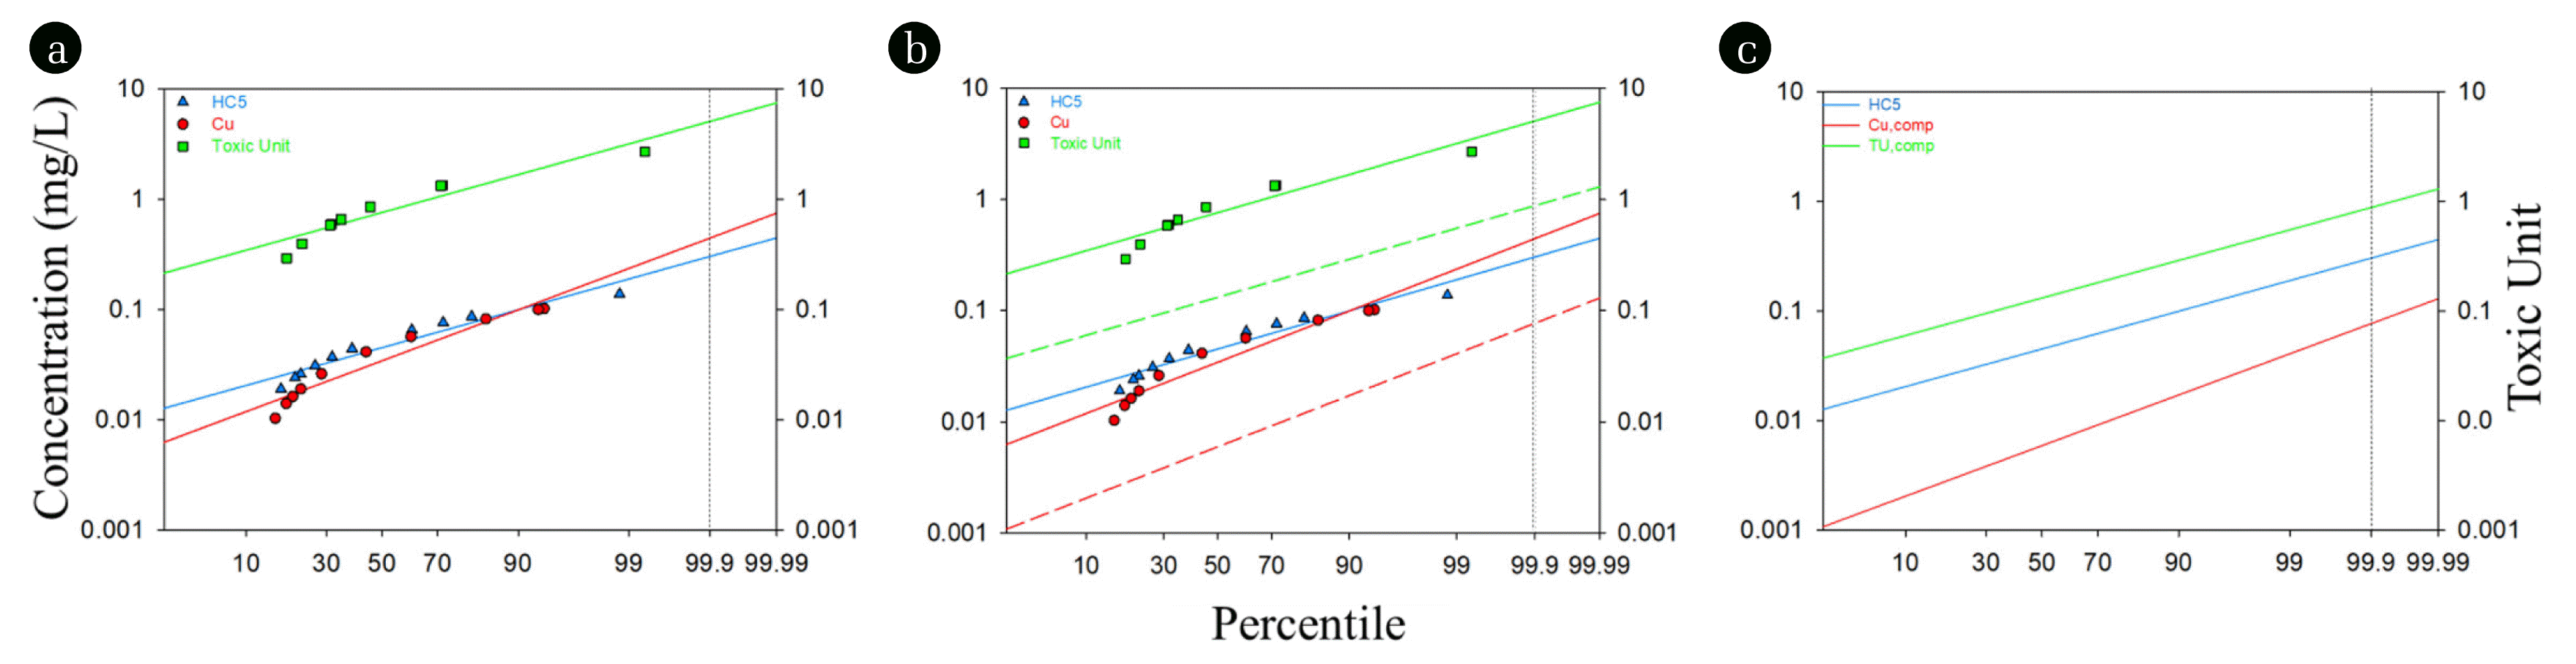
A procedure to derive a FMB of Cu concentration in soil pore water. HC5s are ecotoxicological criteria which are hazardous concentrations considering 95% of soil species in the site, dissolved Cu concentrations are dotted in red and toxic units are ratio of dissolved Cu concentrations to IWQCs. (a) shows data plotted in a probability distribution indicating possibilities occurring from low concentrations to high concentrations. The vertical dashed line is at exceedance frequency of 99.91% which is once in three years and the horizontal dashed line is at where toxic unit being 1. (b) shows a new TU distribution satisfying TUEF = 1 and a corresponding Cu concentration in compliance with that are plotted in dashed lines. In (c), the distribution of new Cu concentration suggests a maximum Cu concentration that is allowable in this site while satisfying TUEF = 1.
To satisfy the TU = 1 as a maximum, where the Cu concentration equals to the HC5 at the target EF, the TU value at the EF needs to decrease by an adjustment factor (AF) of 0.17, which is a multiplicative inverse of 5.78. The shift of the TU distribution by the AF of 0.17 is illustrated as a dashed line in Fig. 2(b), and the distribution of the dissolved Cu concentrations also decrease accordingly by the same scale corresponding to the TU distribution. Table 4 indicates the parameters for various species derived from the SSD and the distributions in Fig. 2 using the equations for a fixed monitoring benchmark method.
The dissolved Cu concentrations from the new distribution at the specified EF adjusted the TU to 1, meaning that the Cu concentration equals to the HC5 at this point, which is the possible maximum Cu concentration in compliance with the HC5. Fig. 2(c) illustrates that these new distributions of the dissolved Cu concentration and the TU satisfying the target EF (i.e., once in three years). Based on this time-series analysis, the maximum Cu concentration in compliance with the specified EF of once in three years is 0.084 mg/L at the study site. This number is called a fixed monitoring benchmark (FMB) or, in other words, it can be considered as an ecologically acceptable endpoint at the study site. When the Cu concentration of the soil pore water is maintained under 0.084 mg/L, it can be concluded that 95% of the soil biota can be protected at the study site. This concentration is adequate when used as a benchmark for given monitoring time as it is based on instantaneous soil pore water characteristics.
4. Conclusions
In this study, the species sensitivity distribution and the fixed monitoring benchmark method were used to compensate for the limitations of the previous BLM by incorporating toxicity of various species at the study site and influence of the time variability to the factors in the BLM. The changing soil pore water characteristics caused time-variable BLM predictions over the monitoring period, which resulted in different HC5 values in each soil pore water sample. As a tool for the time series analysis, the FMB method was employed, and the endpoint protecting the 95% of soil biota from Cu ecotoxicity was determined to be 0.084 mg/L in the study site. This is a concentration found to be adequate to protect the local soil-residing organisms and could be extended as an indicator of soil toxicity. The study provided a new method and logic to derive the ecologically acceptable concentration of Cu in soil pore water. However, a short monitoring period due to time constraints was a limitation in this study. A more precise benchmark is expected with the monitoring data that include seasonal variations or longer temporal frame.
Acknowledgment
This work was financially supported by Mid-Career Researcher Program through National Research Foundation Grant funded by the Ministry of Science and ICT (No. 2016R1A2B2015399) and Korea Environment Industry & Technology Institute(KEITI) through SEM(Subsurface Environment Management) project funded by Korea Ministry of Environment(MOE)(2018002450002).
Notes
Author Contributions
B.J. (Ph.D. student) conducted all the experiments, collected the data, and wrote the manuscript draft. J.A. (Assistant Professor) designed the model and the computational framework. K.N. (Professor) initiated the study and was in charge of overall direction and planning. All authors discussed the results and contributed to the final manuscript.