1. Introduction
Heavy metals (HMs) occur naturally in the environment, however, the concentration of some HMs has increased tremendously since the beginning of the industrial revolution due to many industrial activities. One of these activities is artisanal gold mining. Artisanal gold mining provides an important source of livelihood, especially for developing countries and regions where other sources of revenue are limited. This is true for the inhabitants in Anka in northwestern Nigeria, where gold mining and farming is the only major source of livelihood. Miners recruit men, women and children as part of the labor workforce for mining and processing mineral ore.
The mining practice involves mining the ore, transportation of the ore to a processing site (sometimes in their backyard), crushing and pulverizing with locally fabricated tools and machine, and amalgamation of the mineral ore with mercury. Subsequently, the mine tailings are indiscriminately dumped in residential areas and constitute a major source of lead, mercury and others HMs [1]. Indiscriminate dumping of HMs around residential soils results in easy transfer to humans by ingestion, inhalation, or dermal absorption, and further accumulates in fatty tissues [2]. Regrettably, mining activities have negative impacts on the environment and human health because HMs released during mining are extremely toxic, bio-accumulative, and resistant to bio-chemical degradation and can interface with the normal functioning of the nervous system, endocrine system, immune system, hematopoietic function, normal cellular metabolism [2, 3].
In March 2010 elevated blood lead level (BLL) was discovered in children due to artisanal gold mining in the Anka Local Government Area (LGA) in Zamfara State, in northwestern Nigeria, which led to mass lead poisoning. This resulted in an unprecedented outbreak with over 400 deaths and thousands affected, especially children under the age of 5 years [4, 5]. Furthermore, due to the undulating topography in Anka, mine tailings can be easily washed to farther location such as farmlands, rivers and other water bodies during the rainy season. Additionally, irrigation and wind can also aid the distribution and accumulation of HMs to other locations. A previous study of HMs in Anka indicated that hazard risk ranking of HMs followed the order: Pb > As > Hg > Cd > Mn [6]. Additional, research determined that the concentration of HMs in Zamfara state were also far beyond the recommended guideline threshold [7–9]. For example, the total concentrations of Pb and Cd recorded were reported to be 2,246.6 and 68.7 mg/kg, respectively. These are greater than the threshold values for Pb (300 mg/kg) and Cd (3 mg/kg) [9].
All of these studies based their findings on the concentration of HMs at the sites of contamination. None of these studies attempted to interpolate or extrapolate HMs concentrations to cover a large study area. The application of geographic information system (GIS) has been introduced in the field of environmental risk assessment as an important tool and analysis method [10–13]. These studies indicated that GIS tool using Kriging method can adequately account for spatial heterogeneity of contaminants.
Kriging was originally used by miners and geologists, however, recent applications of Kriging has been used to approximate hurricane wave, soil risk assessment, rainfall and many other fields [14, 15]. Kriging is often more preferred to deterministic methods because it does not only depend on the distance between the measured locations, but also on the spatial autocorrelation among the measured values around the prediction location [16]. Kriging has been successfully applied in mapping soil pollution caused by HMs [17, 18]. The basic principle behind Kriging is closely related to Tobler first law of geography, which states that “everything is related to everything else, but near things are more related than distant things” [19]. Therefore measured samples that are distributed closely in space are more similar to measured samples that are further apart [18–20]. Kriging uses semi-variogram or covariance function to describe the spatial autocorrelation among the data around the prediction location [18]. The semi-variogram or covariance function can be fitted with circular, spherical, exponential, Gaussian, stable, J-Bessel or K-Bessel functions to improve the prediction.
In this work, the main goal was to apply a GIS-based Kriging technique to quantify human environmental risk of HMs pollution in Anka in Nigeria. This will enable a quantification of risk in a large spatial boundary considering the heterogeneity of contaminants’ sources and concentrations.
2. Study Area
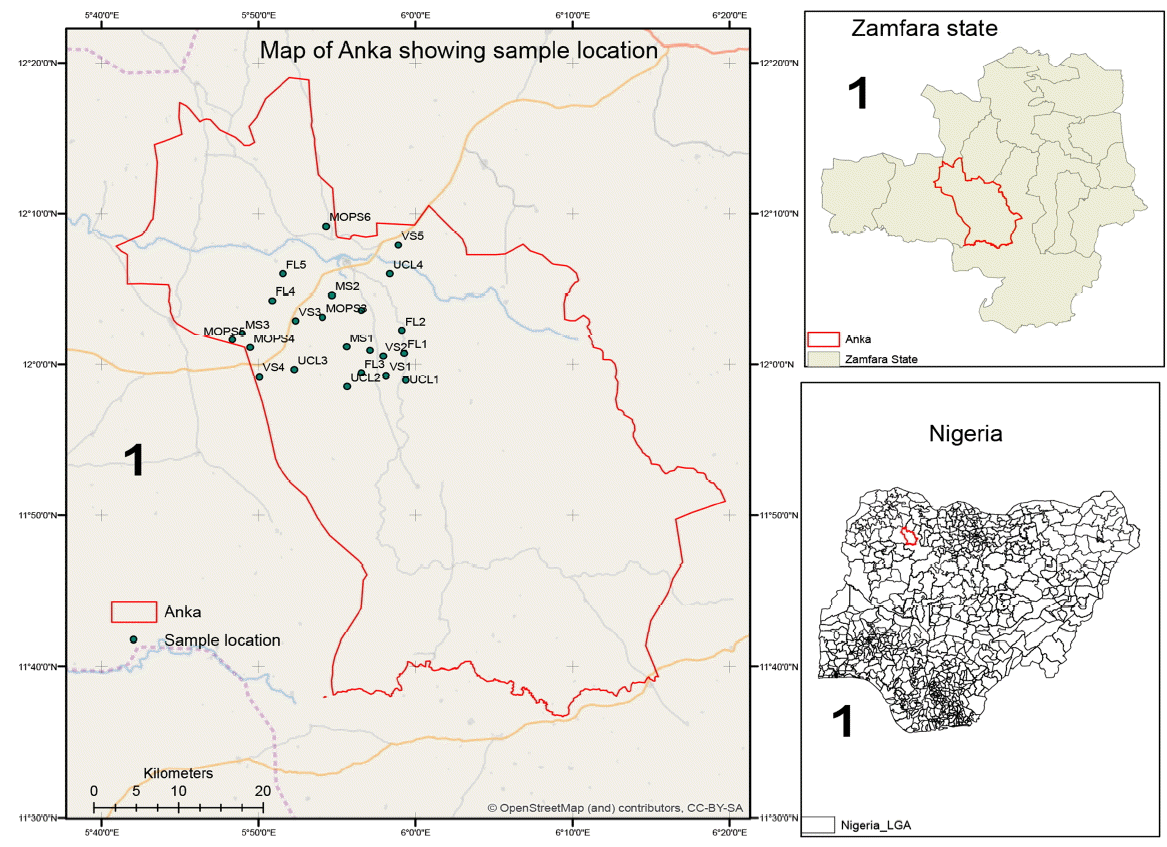
Anka is one of the 14 Local Governments of Zamfara State in Nigeria. It is situated in the northwestern part of Nigeria with a location coordinate of latitudes 11° 40′ 0″ and 12° 20′ 0″ North and longitudes 5° 50′ 0″ and 6° 20′ 0″ East [20]. Anka occupies an area of 2,746 km2 and has a population of 142,280 [21]. Anka has many areas with significant concentrations of HMs in the soil and rocks. Gold mining in Zamfara state has been ongoing for decades, but was not extensive or lucrative, however, a surge in the price of Gold from 2009 to May 2012 led to a revived interest consequently leading to a substantial increase in mining activities [5]. This resulted in a renewed interest in mining in Zamfara state. Anka has two major seasons; rainy season and dry season, food crops produced during these seasons include cowpea, sorghum peanut, millet, lettuce, and cabbage [4]. These food crops may phytoaccumulate HMs in the roots, shoots, leaves, and fruits that could consequently pose a threat to humans.
The concentration of HMs in different locations in Anka has been reported by Uriah et al. [1]. The location of Anka and where the samples were taken for analysis are shown in Fig. 1. For the purpose of clearly displaying the measured location on the maps, the following abbreviations MS, MOPS, VS, FL and UCL will be used to represent mining site, mineral ore processing site, village square, and farmland and uncultivated land, respectively. Table 1 shows a summary of the concentration of HMs in the different locations in the study area. These values were used in this investigation to run the Kriging model and quantify the human health risks.
3. Methodology
3.1. Human Health Risk Assessment Method
To estimate the carcinogenic risk and the non-carcinogenic risk, the method developed by the USEPA for calculation of human health risk assessment was used [22]. Having identified the chemical of potential concern as Pb, Hg, As and Cd, the next step is to determine the pathway of exposure and the level of exposure. The intake is called chronic daily intake (CDI) for non-carcinogenic chemicals, whereas for carcinogenic chemicals, the intake is called lifetime average daily dose (LADD). The three exposure routes, which include soil ingestion, inhalation, and dermal absorption, can be estimated using the Eq. (1) to (3).
where, Csoil is the concentration of the contaminant in the soil (mg/kg.d), IngR is the ingestion rate (mg/day), InhR is the inhalation rate (m3/day), EF is the exposure frequency (day/year), ED is the exposure duration (year), BW is the average body weight (kg), AT is the average time (day), SA is the skin surface area (cm2), AFsoil is the soil adherence factor (mg/cm2), ABS is the dermal absorption factor (unitless), FE is the dermal exposure ratio (unitless), PEF is the particulate emission factor (m3/kg) and CF is the conversion factor [22]. The value for the exposure parameters are given in Table 2.
3.1.1. Non-carcinogenic risk characterization
The linear numerical models used to compute the non-cancer risk assessment was adapted from the USEPA Exposure factors handbooks [22]. The non-carcinogenic risk is typically expressed in terms of hazard quotient (HQ) and hazard index (HI). The HQ for a single contaminant is determined by dividing the estimated daily intake by the reference dose (Rfd) of the contaminant. Several simultaneous exposures to sub-threshold levels could add up to cause adverse effects. Therefore summing the HQ of each HM having adverse effects on the same organ or similar toxic effect can indicate whether the risk is acceptable or not. HI is the integration of HQ’s from all exposure pathways having similar toxic effects. Generally, an HQ of less than 0.2 is considered acceptable while a value of more than 0.2 is considered unacceptable. Similarly, an HI of greater than unity from various pathways is considered unacceptable which means that the exposed population may experience adverse health effect and risk management measures should be implemented while HI of less than unity is considered negligible [23–25]. Mathematically, the HQ and HI can be determined using Eq. (4) and (5) [25].
where the reference dose and cancer slope factor (CSF) for dermal exposure are not available, extrapolation can be found by multiplying the oral reference dose by the gastro-intestinal absorption factor and by multiplying the oral cancer slope by the gastro-intestinal absorption factor according to Eq. (6) [26].
3.1.2. Carcinogenic risk characterization
The carcinogenic risk is estimated as the incremental probability of the occurrence of cancer over a lifetime as a result of exposure to a potential carcinogenic contaminant. Incremental excess lifetime cancer risk (IELCR) is the terminology for characterizing carcinogenic risk and it can be calculated using Eq. (7).
To sum the carcinogenic effect resulting from exposure to two or more carcinogens, the cumulative target risk (CTR) can be calculated from the Eq. (8).
When CTR exceeds 1×10⁻⁴ – 1×10⁻⁶ further chemical-specific assessment is required, however, when CTR fall below 1×10⁻⁴ – 1×10⁻⁶ no action is required from a human health perspective [25]. These thresholds have been adopted because they represent the risk at the exposed population that is likely going to have an adverse health effect or not. The values 1×10⁻⁴ and 1×10⁻⁶ represent the upper and lower limits of human health risk, beyond which there is a statistical significant evidence of adverse health effect [25]. The upper limit value (1×10⁻⁴) has been used in this investigation as a reference CTR.
3.2. Kriging for Geostatistical Analysis
In addition to risk assessment, ArcGIS 10.5.2 was used to show the spatial distribution and variability of the HMs contamination in the soil. This has been done by importing an excel file containing the location and concentration of each HMs from the measured locations in ArcMap and creating a points event layer based on x- and y-coordinates (longitude and latitude in decimal degrees) of the sample location and by setting the Coordinate system to World Geodesic System (WGS1984). Subsequently, the event layer was exported to create a permanent layer containing an attribute table of HM concentrations for each of the measured locations. The created layer containing the attribute table of the HMs enables different analysis to be performed on the dataset on ArcGIS. The use of ArcGIS is important to display an aerial view of the spatial distribution of the contamination of HMs as well as HI and HQ across the study location.
Geostatistical extension in ArcGIS 10.5.2 was used in the implementation of ordinary Kriging for the human health risk assessment prediction map and probability Kriging for the probability map. As well as choosing a different model that best described the spatial autocorrelation for both the prediction map and the probability map to fit the semi-variogram, specific parameters of the semi-variogram differ between maps. The choice of model used was based on the model that gave minimal prediction error when compared to other available models (based on root-mean-square, root-mean-square standardize, average standard error and cross validation).
4. Results
The concentration of HMs at different locations in Anka is presented in Table 1. The concentration of Pb varies greatly from 19.8 ppm to 6,909 ppm. Also, the mining sites and mineral ore processing sites have very high HMs concentrations across all the measured areas. Hg, As and Cd have a relatively low concentration but still high enough to be toxic to human and biological communities in the ecosystem. The concentrations of the HMs are highest in the mineral ore-processing sites except for the concentration of Pb in the Uncultivated Land 1 at 6,909 ppm. Moreover, the average concentration of HMs in the measured locations decrease in the following order: (1) for Pb, Farmlands < Village squares < Uncultivated lands < Mining sites < Mineral ore processing sites; (2) for Hg, Uncultivated lands < Farmlands < Mining sites < Village squares < Mineral ore processing sites; (3) for As, Uncultivated lands < Farmlands < Village squares < Mining sites < Mineral ore processing sites; (4) for Cd, Uncultivated lands < Mining sites < Village squares < Farmlands < Mineral ore processing sites.
4.1. Human Health Risk Assessment and Kriging Prediction
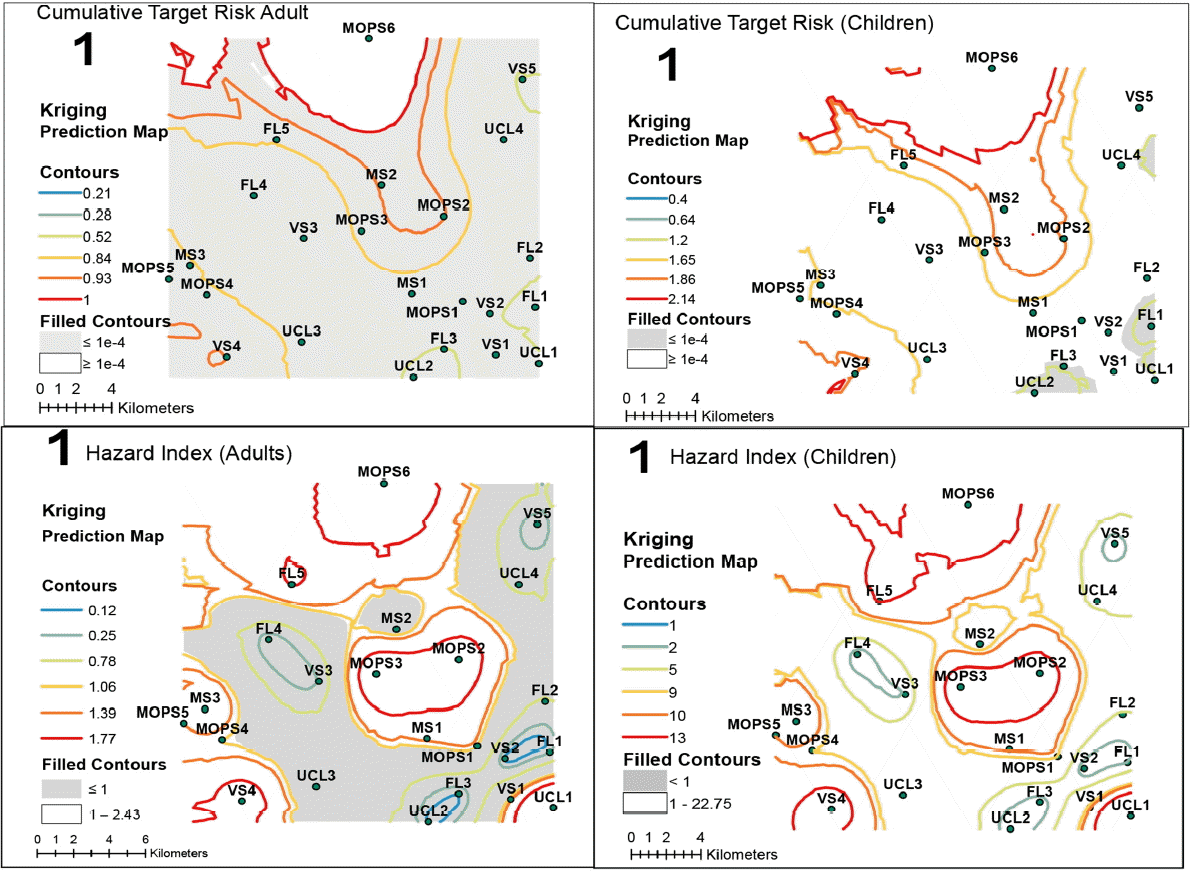
The calculated value of HI and CTR using Eq. (1)–(8) are presented in Table 4. The table shows clearly that only two sites (VS2 and VS5) out 23 sites in Anka exhibited a negligible HI for children (HI less than unity), as opposed to 11 sites for adults. This result is explicitly linking environmental harm to high risk to Anka’s children. As previously mentioned, the total cancer risk will be deemed to be “essentially negligible” where the estimated total CTR is less than the limits of human health risk. At an upper limit CTR value of 1×10⁻⁴, Table 4 shows that nine sites have negligible cancer risk to children. If lower limit value is selected (1×10⁻⁶), no site in the study area exhibits a negligible cancer risk to both children and adults. The spatial distribution of the HI (non-carcinogenic risk) and the CTR (Carcinogenic risk) of HMs in and around the measured locations are shown in Fig. 2.
4.2. Kriging Prediction
The contours for CTR shown in Fig. 2. have been normalized by dividing the total cancer risk for each study group (adult and children) by 1×10⁻⁴ (de Minimis risk) [25]. The value 1×10⁻⁴ represents the upper limit of human health risk, beyond which there is a statistical significant evidence of adverse health effect [25]. Therefore, any area on the map with CTR above unity, represents area with significant evidence of adverse health effect and vice versa. Generally, the risk is higher for children than for an adult. This is because children are more vulnerable to chemical attack due to their physiology and morphology and exposure pathway.
Fig. 2 shows that only very few areas have a CTR ≤1 or 1×10⁻⁴ and HI < 1 for children. This indicates that the majority of the study area showed that there is a significant risk for carcinogenic and non-carcinogenic adverse health effect for children. It can also be seen that areas corresponding to high CTR and HI are around the mineral ore processing sites or mining sites. Therefore, in order to reduce the risk posed by HMs through artisanal gold mining, children should stay clear of mining areas and mineral ore processing sites. Furthermore, any remediation strategy should prioritize areas such as VS4 and VS1 which have relatively higher risk and sizable number of inhabitants. In contrast, for adults, close to half of the study area indicated no significant non-carcinogenic risk of adverse health effect, and only about a quarter of the study area indicated significant carcinogenic risk of adverse health effects. The average HI for children and adult are 8.86 and 0.95, respectively. The average carcinogenic risk for adult and children are 7.27×10⁻⁵ and 1.36×10⁻⁴, respectively. This result validates why Doctors without Borders focused on children aged five years and below during the Pb poisoning outbreak as children were the most susceptible group [5].
Since some areas classified by the CTR method as having acceptable risk level, are at the same time classified by the HI methods as have unacceptable risk level, it can be deduced that HI method is the most conservative method of human health risk assessment. Hence, even though children and adults may not be exposed to significant doses to cause cancer, they might still experience adverse non-carcinogenic health effect.
4.3. Kriging Probability Map
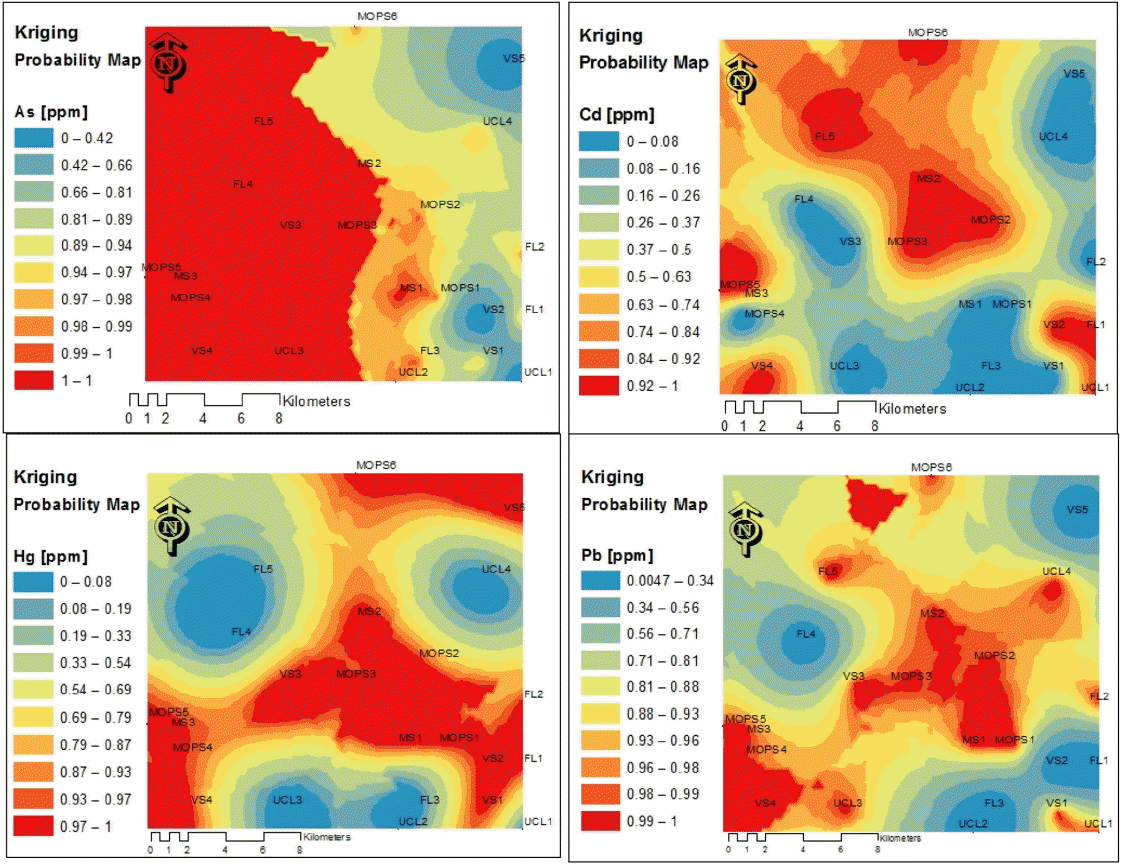
ArcGIS was used to develop a probability map, which was used to evaluate the probability that the concentration of HMs would exceed certain stated threshold limits (Fig. 3). The threshold values used to calculate the probabilities in the Kriging model for Pb, As, Cd, and Hg were 100, 20, 3, and 0.8, respectively [28, 29]. Fig. 3 shows that the probability of Pb, Hg, and As to exceed their respective threshold limit in the mineral ore processing sites and its immediate surrounding is almost 100%. As for Cd, the probability of MOPS1 and MOPS4 to exceed their threshold limit were found to range between 0 and 16%, while MOPS2, 3 and 5 show a higher probability of about 84–100%. VS4 shows a very high probability of 100% of Pb, Hg, As and Cd.
Furthermore, Fig. 3 shows that only three areas (VS5, VS2 and UCL1) within the vicinity of measured locations showed a probability of less than 42% for As to exceed its threshold value. However, the majority of the study area showed a probability greater than 90% of As to exceed the threshold value. In the same way for Cd, the majority of measured location within the study areas has a probability of less than 50% to exceed the threshold value. However, more than half of the study area showed a probability of greater than 50% of Cd to exceed its threshold value. Additionally, the majority of areas have Hg and Pb probability greater than 93% to exceed their threshold. However, while Hg has FL3-5, and, UCL1-4 in areas with probability in the range of 0–19% of Hg to exceed its threshold value, Pb has VS5, VS2, FL1, FL3, FL4 and UCL2 in areas with probability in the range of 0.47–34% of Hg to exceed its threshold value.
5. Conclusions
In this work, HMs concentration from uncultivated lands, farmlands, village squares, mining sites and mineral ore processing sites in Anka in Northwestern Nigeria were studied with the purpose of quantifying and evaluating the human health risk heavy metal from artisanal gold mining possess to the inhabitants of Anka. The results showed that arsenic, mercury, and cadmium generally have their highest concentration in the mineral ore processing sites. GIS Kriging was used to show that majority of the study locations have a significant risk for non-carcinogenic and carcinogenic risk adverse health effect for children. In contrast, for adults, close to half of the study area indicated no significant non-carcinogenic risk of adverse health effect, and only about a quarter of the study area indicated significant carcinogenic risk of adverse health effects. Furthermore, probability Kriging indicated high probability of Hg, Cd, As and Pb to exceed their threshold concentration around the study area, which point out that HMs are likely going to cause serious health issues for the residents of the village especially among sensitive groups. Ultimately, this research will help environmental engineers to delineate vulnerable areas that should be prioritized for remediation.