1. Introduction
Oily wastewater is discharged from both household and industry. In metalworking processes, cutting oil or cutting fluid is widely used to reduce temperature and corrosion rate from high speed friction working in form of a solution or an oil-in-water emulsion [1]. The cutting oil, typically, consists of mineral oil, surfactants, and additives such as anti-corrosion and anti-bacterial growth [2]. After use, cutting oil lose its lubricant and coolant properties and becomes a hazardous waste.
The conventional treatment processes likes coagulation/flocculation, coalescence, and membrane filtration were applied to separate oil from this wastewater [3]. However, these processes need a post treatment to remove the residual stable oil. Another alternative process is electrocoagulation-flotation (ECF), which is the electrochemical process used for treating small suspended particle by supplying metal ions, e.g. Al3+ or Fe2+, from sacrificial anode to form coagulant and also generating hydrogen micro-bubble to proceed the flotation [4]. This process has been applied to treat various kind of wastewater including oily wastewater [5–6]. It was reported that the ECF can produce more compact sludge [7], which solve the problems on the large sludge production of the chemical coagulation [8]. To investigate the oily wastewater treatment by the ECF, effects of operating conditions on the treatment performance have to be considered. Apart from conducting an experiment, the application of the design of experiment (DOE) concept was another approach to determine an effect of each parameter. Moreover, the analysis results can be used to propose a correlation between operating parameters and the treatment efficiency. Therefore, the objective of this work is to study the cutting oily wastewater treatment by the electrocoagulation-flotation. Effects of operating conditions (i.e. electrodes gap, current density, oil concentration, and reaction time) on the treatment efficiency were investigated. The DOE analysis on each parameter were conducted and, finally, a mathematical model for the efficiency prediction was proposed.
2. Materials and Methods
2.1. Experimental Set-Up
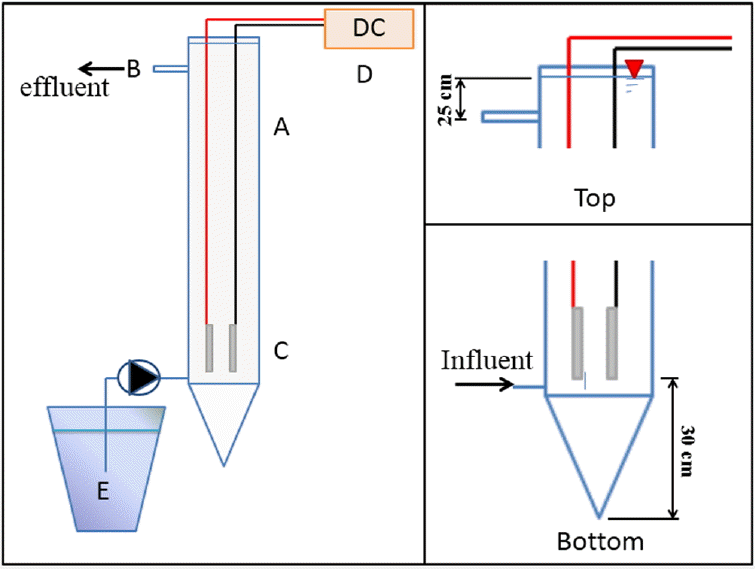
Fig. 1 shows the schematic diagram of the electrocoagulation-flotation in the 25 liters bubble column (A) made of clear acrylic with 14-cm inner diameter and 180-cm height. The sampling point (B) was designed at 25 cm under the water surface. The current was supplied through a pair of 5 cm × 20 cm × 0.2 cm aluminum electrodes (C) by the direct current power supply (D) at 5 A and 60 V. The cutting oil emulsion was fed to the reactor from the preparation tank (E).
2.2. Synthetic Oily Wastewater
The synthetic wastewater was prepared by mixing the commercial cutting oil (Castrol Cooledge BI) with tap water at three different concentrations of 0.5, 1.0, and 1.5 g/L under the agitation for 30 minutes. The oil concentration in this work was measured by means of turbidity and COD using the 2100P Turbidimeter and the closed reflux method, respectively. These two parameters were suggested as the reliable measurement to represent the concentration of metalworking fluid [9–10]. The treatment efficiency was evaluated from the turbidity removal. The characteristics of the cutting oil waste-water are displayed in Table 1. It can be seen that both turbidity and COD were increased with oil concentrations. Note that the zeta potential of this wastewater was −48 mV suggested the presence of negative charges on droplets’ surface. Combining with the microsize of droplets, this wastewater can be categorized as the secondary emulsion, which cannot be separated by physical separation process.
2.3. Experimental Procedures
Firstly, the chemical coagulation experiments were conducted in a jar test with the 1.0 g/L emulsion using aluminium sulfate (Al2 (SO4)3).16H2O) as a coagulant. The rapid mixing of 100 rpm for a minute was followed by the slow mixing of 30 rpm for 30 minutes and 30 minutes sedimentation. The undernatant was collected to measure its turbidity and COD. The ratio between oil sludge and treated water was also determined.
Afterward, the electrocoagulation-flotation was conducted. Three oil concentrations of 0.5, 1.0, and 1.5 g/L was applied with the varied gap between electrodes of 1.25, 2.5, and 3.75 cm and the supplied current densities of 0.75 A, 1.00 A, and 1.25 A. The effluent was collected for 20 mL every 10 minute at the sampling point. The mechanisms of the electrocoagulation-flotation with the aluminum electrodes are presented in Eqs. (1–3). The reaction will be differ depending on the applied electrode type. Generally, metal ions are generated at the anode, while the cathode can produce hydrogen gas (H2) bubbles (Harif et al., 2011).
3. Results and Discussion
3.1. Chemical Coagulation
The chemical coagulation using alum can effectively treat the emulsion under the pH of 6–9 where the sweep flocculation by aluminium hydroxide precipitates (Al(OH)3) play a key role in the destabilization [11–12]. This conformed to the formation of solid flocs observed at the water surface after settling. The required alum dosage was increased with the oil concentration. The treatment efficiency of higher than 95% can be found at 120 mg/L, 160 mg/L, and 200 mg/L for the oil concentrations of 0.5 g/L, 1.0 g/L, and 1.5 g/L, respectively. Increasing the alum to exceed these dosages caused the slightly reduction of the efficiency. Excess Al(OH)3 production could be responsible for this as larger amount of precipitates can increase the turbidity of the treated water.
It was also noticed that flocs formed in this experiment were bulky and easily break-up under little agitation, which made them difficult to be separated. Moreover, its high water content resulted in larger volume of sludge to be disposed after the coagulation. Finding an alternative to ease this problem is interesting. Therefore, the electrocoagulation-flotation was investigated in the following section since it has been reported to produce more compact sludge than the chemical coagulation [7].
3.2. Electrocoagulation-Flotation (ECF)
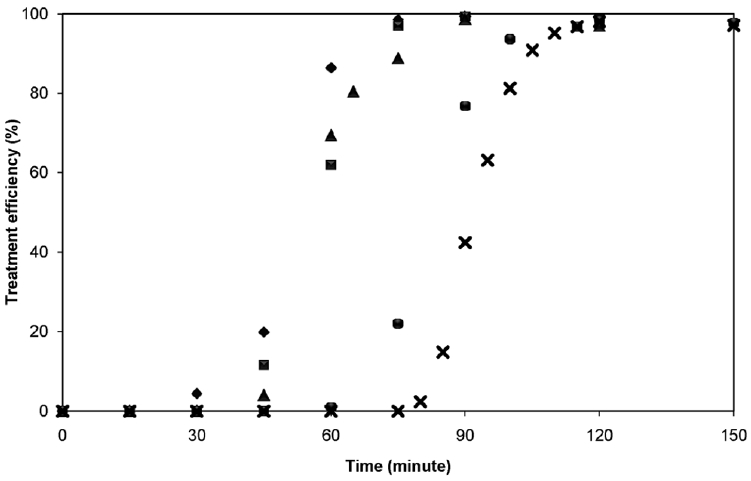
Fig. 2 displays the variation of the treatment efficiency with time under different current density and electrode gap in the case of 1.0 g/L oil concentration as an example. Similar pattern and efficiency was obtained for other oil concentrations, i.e. 0.5 g/L and 1.5 g/L. Three stages of turbidity removal can be noticed, which corresponded to lag, reactive, and stable stages [13]. Note that the pH of the wastewater was almost unchanged from the initial value of 7–8. This range is suitable for the sweep floccution mechanism since the solid aluminium hydroxide (Al(OH)3(s)) dominate the aluminium speciation in the system [11]. The turbidity in the lag stage was unchanged since little amount of aluminum ions were released from the anode side. Later, more aluminum ions were produced and diffused through the whole column by the assistance of ultrafine hydrogen-oxygen bubbles from the cathode. This stage only occurred for 20–30 minutes as aluminum precipitates attached on the droplets’ surface to form oil flocs resulting in the destabilization. Flocs can rise upward to the water surface. Afterward, the removal efficiency reached the highest value of more than 95% and became steady in the stable stage. gaps of 1.25 cm and 2.5 cm in this work was unclear since they were in a small range. The electrode gap of 2.5 cm was selected as the optimal condition due to the fact that it contained larger reactive zone.
Oil concentration also played a role in the treatment in term of reaction time. As can be seen in Table 2, the optimal time was increased with the oil concentration. This can be explained by the fact that larger number of droplets at higher oil concentration required longer time to react with aluminium ions and achieved the maximum efficiency. The treatment of higher oil concentration also produced larger sludge volume. Note that the same sludge characteristics were obtained at different oil concentrations.
When compare with the chemical coagulation, the ECF consumed less aluminium dosage (7.0 mg/L) than the chemical coagulation (13.7 mg/L for the alum of 160 mg/L) to achieve the same efficiency for the 1.0 g/L oil concentration. This also affected the volume of the sludge production, which increased with the oil concentration. Sludge from both chemical coagulation and electro-coagulation-flotation were generated in the similar portion. However, the sludge from the ECF contained less water content than the chemical coagulation, i.e. 50% and 95%, respectively. This corresponded to those reported for sludge of aluminium hydroxide flocs in the works of Hu [15] and Shin [16]. The advantage on the sludge production of the electrocoagulation-flotation over the chemical coagulation was proved in this study.
As the benefit of the ECF in the oily wastewater treatment was found, key parameters affecting the process performance were analyzed. Apart from the experimental results, the modeling approach was applied to estimate the effect of each operating parameter on the process performance. The concept of the design of experiment (DOE) was utilized as exhibited in the following section.
3.3. Design of Experiment Analysis
The design of experiment (DOE) was used to analyze the correlation between each parameters by MINITAB 7 software. The 3-levels of −1, 0, and 1 represent the low, medium, and high levels of each factor, respectively. These levels were applied to 4-parameters being considered in this study, including oil concentration, electrode gap, current density, and reaction time. The factors and theirs levels assigned in the DOE are presented in Table 3. As a result, 31 runs of the designed experiments were given by the software.
After conducting all the experiments, the correlation among these parameters to the treatment efficiency from the DOE analysis was obtained as shown in Table 4. It can be seen that the current density (x3) and the reaction time (x4) played an important role on the efficiency due to their p < 0.005 and high range of f value. In addition, the oil concentration in the 2-way interaction parameters (x1 x3 and x1 x4) also influenced the treatment performance.
A a mathematical model was proposed to clarify effects of these parameters on the treatment efficiency taken into account all of the studied parameters. The results are presented in the next section.
3.4. Model Prediction for Electrocoagulation-Flotation: Linear Function
An uncoded unit of regression equation was provided by MINITAB 7 with the coefficient of determination (R2) of 0.9544, which represented a good fit of the prediction model (R2 > 0.90 is preferable) [17]. The acquired correlation is expressed in Eq. (4).
The experimental results were used to validate this acquired model as depicted in Fig. 3. As can be seen, the prediction was accurate in the lag stage and slightly overestimate (» 100% removal) in the stable stage. However, a large discrepancy can be noticed in the reactive stage. According to the variation of the turbidity removal efficiency over time (see Fig. 2), the reactive stage could be explained by a linear function as the removal effciency was uniformly increased. On the other hands, the other two stages can be definded in a quadratic or a logarithm function. Therefore, a model focusing on the lag stage was further developed in order to estimate the duration of the lag stage, in other words, to determine the starting point of the reactive stage.
3.5. Model Prediction for Electrocoagulation-Flotation: Logarithm Function
A model based on a logarithm function was proposed using the analysis from MINITAB. The objective of this second model was to estimate the lag stage period and indicate the starting point of the reactive stage. To develop this model, two assumptions was proposed including (1) the lag stage was described as the region of unchanged turbidity and (2) the turbidity appearance during the reactive and stable stages can be definded by logarithm function with time. The time to achieve the 80% efficiency was applied as the terminating point of the linear turbidity removal and estimated the constant in a logarithm function. Two regression results with the R2 of 0.9096 and 0.9402 were obtained as in Eqs. (5) and (6) for the prediction of the lag time (tlag) and the steady time (tsteady) (80% removal reached), respectively.
The logarithm function to determine the efficiency from these times is expressed in Eq. (7).
The constant in the prediction model (k) can be calculated from Eq. 8. From the calculation, the constant k of every oil concentration was in the range of 0.011 – 0.065/min incresing with the current density.
To validate this model, the experiments with randomized level of the studied parameters were conducted. As can be seen in Fig. 4, the predicted values of tlag, tsteady, and treatment efficiencies were close to the experimental results under the conditions of 1 g/L oil concentration, 2 cm electrode gap, and 125 A/m2 current density. This indicated the capability of this model to give the treatment efficiency from the operating parameters. Moreover, the correlation between these factors and the treatment performance was affirmed. Nevertheless, it should be kept in mind that this model was only applicable in the narrow range of oil concentration (0.5–2 g/L) and current density (100–125 A/m2). More experimental results, particularly in wider range operating conditions, would be helpful to improve the applicable range and the prediction accuracy of this model.
4. Conclusions
The treatment of cutting oil wastewater by the electrocoagulation-flotation process was proved to be successful with several advantages over the chemical coagulation. The efficiency higher than 90% was obtained from both processes, but the ECF utilized less aluminium dosage and produced less oil sludge. By using the design of experiment (DOE) concept, current density, oil concentration, and reaction time were found to be the important factors affecting the ECF performance. Their effects on the treatment efficiency was confirmed in the validation of the proposed mathematical model. The logarithm approach provided a better prediction than the linear function as the former gave the considerable accuracy comparing to the experimental results. However, only a limited range of operating conditions was tested with the model, which could be one constraint on its applicable in other scenarios.