1. Introduction
With the increasing demands for low engine emissions, reducing the NOX which is produced by heavy duty diesel vehicles has become one of the major tasks. Urea-SCR (selective catalytic reduction) systems possess an outstanding performance in NOX reduction, which can be served as a technology platform for further improvement. Therefore, urea-SCR system is regarded as the most promising approach to meet restricted emission standards [1].
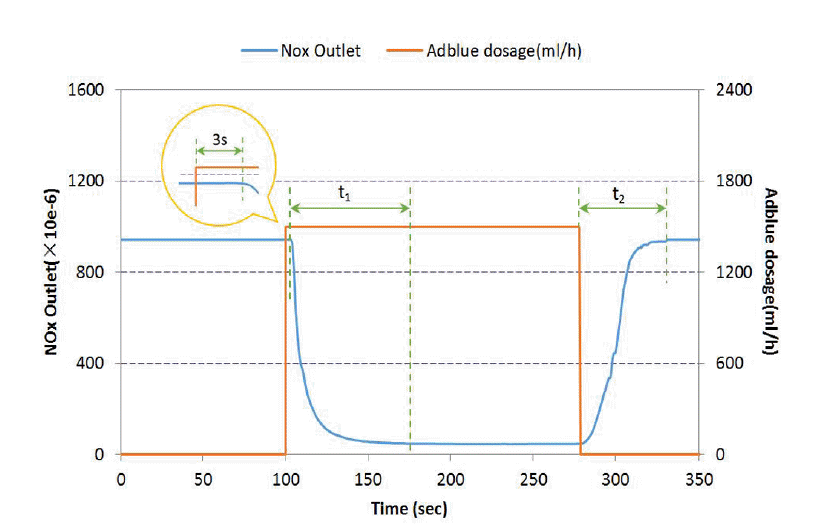
Experimental researches showed that the NOX concentration tracked at the outlet of SCR catalyst with a transient variation of Adblue dosage had certain regularity (Fig. 1). After a sudden increase of Adblue dosage, the NOX concentration decreased at 3 seconds later, which means the time delay is encountered in SCR systems. Then, the NOX concentration decreased slowly and it became stable gradually in 80 seconds (t1). When the injection stopped, the NOX concentration increased to the original level in 70 seconds (t2).
The track of NOX concentration features as a resistance-capacitance (RC) model, facing obstacles to obtain simultaneously NOX expected to be reduced and equi-molar ammonia available to SCR reaction, which finally inhibits NOX conversion efficiency. Generally, engine loads change frequently, triggering a rapid changing of Adblue dosage, which aggravates the air quality that are caused by NOX emission and ammonia slip.
The present research confirmed the problem which is discussed above. In order to increase the conversion efficiency of NOX and avoid secondary pollution, a lot of work have been done [2–5]. Bonfils et al. [2] proposed a lumping method for the SCR system. Zhang et al. [5] presented a method to combine neural network model with Fuzzy Fuzzy proportional-integral-derivative (PID) to To meet both NOX emission requirements and NH3 slip targets. However, the studies of embeddable models are relatively limited [6]. The existing embeddable models are not accurate enough to fully describe the transient response of NOX concentration and reveal the regularity of different factors affecting SCR system characteristics [7, 8].
Based on the weight analysis of the influencing factors on SCR system, the paper presents “variable RC model with time delay” to describe the input-output state relations of SCR system comprehensively. Such model can be used for a real-time correction of Adblue dosage, thus to creating an avenue for the SCR control strategy.
2. Materials and Methods
Both experimental and simulation research on the time-delay and RC characteristics of SCR system were implemented in the paper, and finally the “variable RC model with time delay” was obtained.
The experimental setup is consisted of a 4.75 L diesel engine, a 12 L V2O5-WO3/TiO2 catalyst, an Adblue dosing system and a Tianlan designed controller. The aftertreatment system was equipped with NOX sensors and exhaust temperature sensors at both inlet and outlet of the catalyst converter, an AVL AMA i60 emission analyzer and a Siemens ammonia analyzer at the tailpipe.
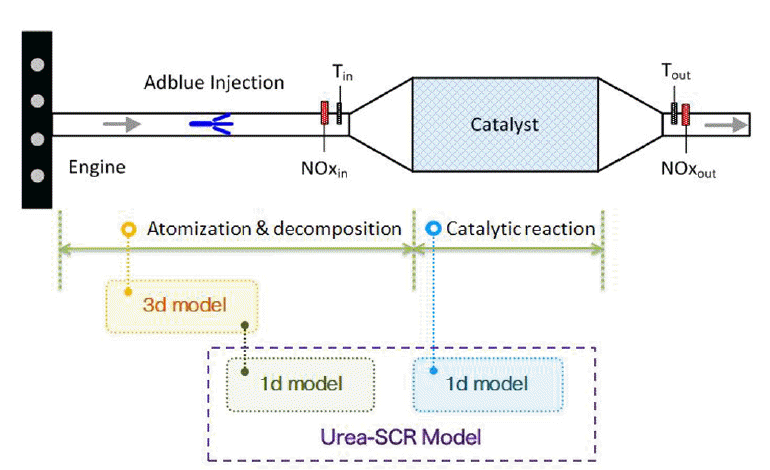
The process of urea-SCR system can be divided into atomization and decomposition process and catalytic reaction process. The paper established a 3D Adblue injection model to describe the first process, including the evaporation of droplets, secondary break-up, droplet-wall interaction and urea decomposition. A simplified 1D Adblue injection model based on the results of 3D model was also established to speed up the simulation. The urea-SCR model for the weight analysis was consisted of 1D Adblue injection model and 1D catalytic converter model (Fig. 2). After the estimation of kinetic parameters, the simulation results well agreed with the experiments.
3. Results and Discussion
3.1. Time Delay
3.1.1. Time delay of Adblue transportation
Due to the time delay of Adblue transportation, the change of NOX concentration track at the inlet of SCR catalyst is obviously lagging behind the change of Adblue dosage. The state-of-the-art NOX sensors have cross-sensitivity to NH3 [9, 10], which can be used to measure the transportation delay (Fig. 3).
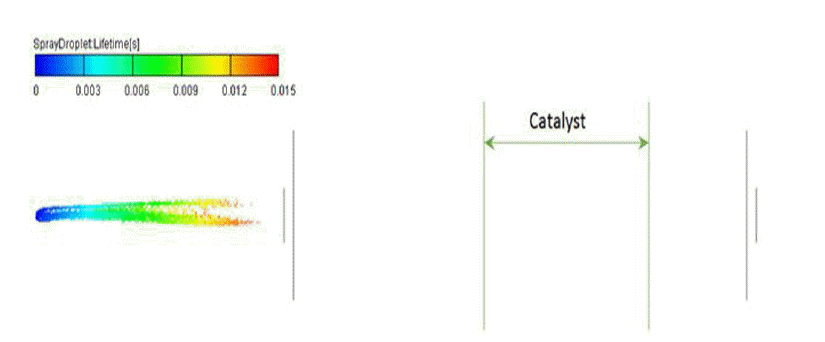
The time delay of Adblue transportation is consisted of the lag time in injection pipe and exhaust pipe. The transportation delay of Adblue in injection pipe is related to the injection pressure, dosage and temperature of adlbue, and also the geometrical size of injection pipe. The transportation delay of Adblue in exhaust pipe caused by the atomization and decomposition process is influenced by exhaust mass flux and temperature, Adblue dosage and injection pressure, as well as the geometrical size of exhaust pipe. According to the simulation results of 3D Adblue injection model, the transportation delay of Adblue in exhaust pipe is 0.015 seconds (Fig. 4).
3.1.2. Time delay of exhaust flow and catalytic reaction
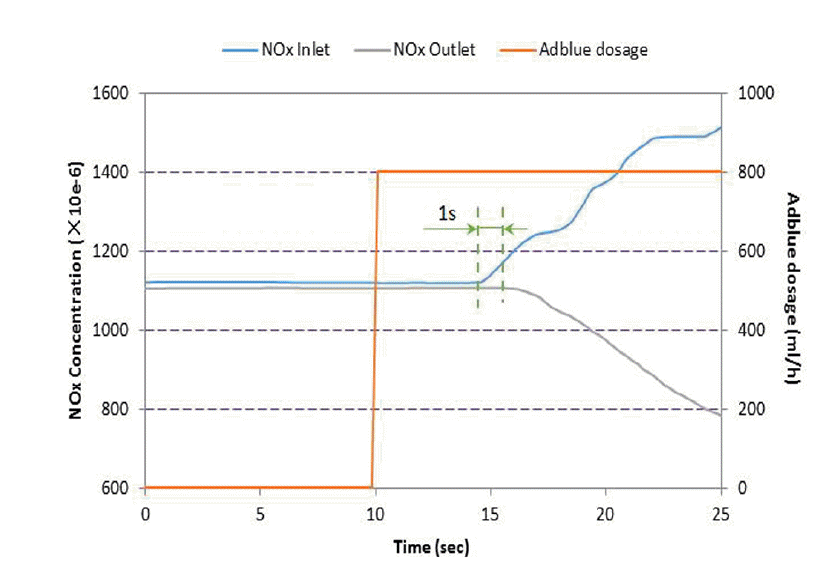
The value of NOX sensors at inlet and outlet of catalyst changes respectively corresponding to the change of Adblue dosage (Fig. 5). The lag time between two NOX sensors is consisted of the exhaust flow delay and reaction delay.
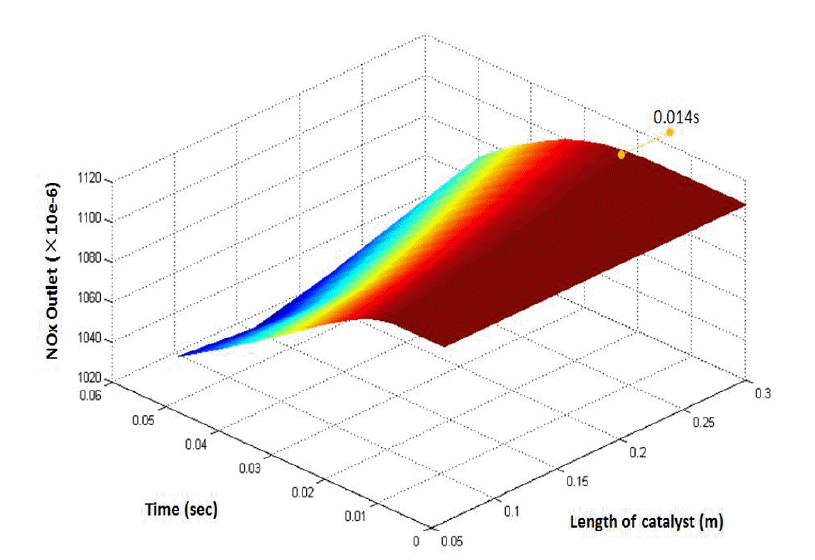
The exhaust flow delay is related to exhaust flow, the temperature, and the structure of catalytic converter. In catalyst, NH3 is first absorbed at active site and then reacts with gas-phase NOX to form N2 and H2O. The lag time of this process is influenced by exhaust flow and temperature, the gas composition and the size of catalyst. According to the simulation results of 1D catalytic converter model, the reaction delay in catalyst is 0.014s (Fig. 6).
3.1.3. Time-delay of different operations
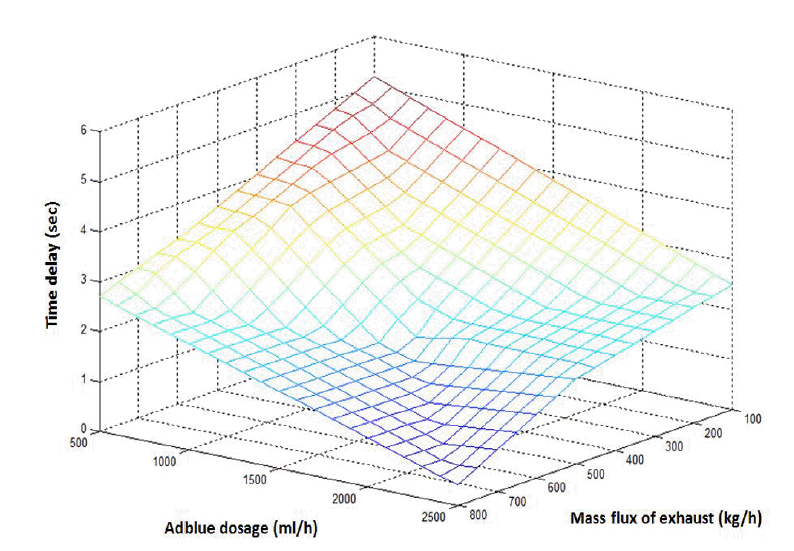
It can be concluded that the transportation delay of Adblue in the injection pipe and exhaust flow delay are the main compositions of time delay of urea-SCR system. Since the physical structure of injection pipe and catalytic converter are determined, the time delay of the system is mainly associated with exhaust flow and Adblue dosage. A map of time delay at different operations can be derived from various kind of experiments (Fig. 7).
3.2. RC Characteristics
3.2.1. The weights of influencing factors
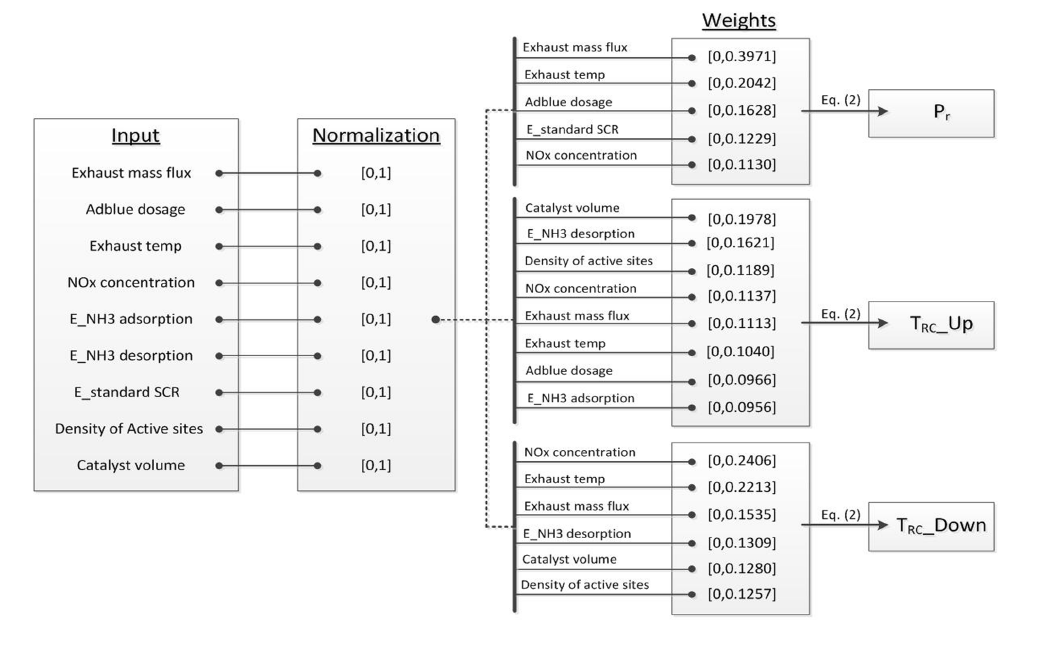
The influencing factors of urea-SCR system discussed in this paper are consisted of four parts. The first is the properties of exhaust, which includes the gas composition, mass flux and temperature. The second refers to the relevant parameters of Adblue injection system, namely the injection quantity, Adblue temperature and the HCNO conversion efficiency. The third means the structure parameters of catalyst and the last one is the kinetic parameters of catalytic rate expressions.
The levels of influencing factors of exhaust properties were determined by the European steady Cycle (ESC) and European Transient Cycle (ETC) baseline tests (ESC baseline: 10.74 g/kW·h, ETC baseline: 10.38 g/kW·h). At the same time, the levels of factors in the second part were determined [11]. Furthermore, the levels of factors in the third part were determined on common commercial catalysts which have been widely used in the world [12]. What is more, the levels of kinetic parameters were determined on the estimation results at different exhaust temperature.
The weights of influencing factors on the NOX conversion efficiency, time t1 and t2 are shown in the Table 1.
3.2.2. The key factors of urea-SCR system
The mean value of the weights was taken as an evaluation index in the paper. All the factors were evaluated and preliminary screened. A weight analysis of the screened factors was carried out and finally the critical elements were found out. The key factors are shown in the Table 2 and Table 3.
As shown in Table 2 and Table 3, the mass flux, temperature and NOX concentration of exhaust, the catalyst volume, the activation energy of NH3 ad/desorption and standard SCR reactions, and the Adblue dosage are the key factors of urea-SCR system.
The engine-out NOX level directly influences the development of urea-SCR system. The space velocity and activity of catalyst are affected by the exhaust mass flux and exhaust temperature. The NOX mass flux at the inlet is determined by the NOX concentration and exhaust mass flux. Therefore, the mass flux, temperature and NOX concentration of exhaust play a very vital role on the NOX conversion efficiency, time t1 and t2.
The catalytic performance of catalyst is crucial to the urea-SCR system. The standard SCR reaction means a lot in the NOX reduction, so its activation energy has an obvious effect on the NOX conversion efficiency. Inside the catalyst, NH3 takes part in the SCR reaction only after the adsorption on the active sites, which refers to the reaction of NH3 ad/desorption, the density of active sites and the catalyst volume have a great influence on the transient response of urea-SCR system.
The Adblue dosage which determines the concentration of NH3 and HCNO at the inlet has a great effect on the NOX conversion efficiency and time t1 but little effect on time t2.
3.3. The Description of Urea-SCR System
Based on the comprehensive analysis of urea-SCR system, the paper presents “variable RC model with time delay” to describe the characteristic of the system. The transfer function is calculated by Eq. (1):
Where, R is the value of resistance, C is the value of capacitance, TRC is the time constant, Tratio is the proportional constant, and τ is the time delay.
The parameter τ is derived from the interpolation of time delay map that is shown in Fig. 7. According to the results of weight analysis, the time constant and proportional constant are calculated by Eq. (2):
Where, N is the number of key factors, x is the weight of key factors, A, B and C are state parameters.
As shown in Fig. 8, different TRC is used according to the trends of outlet NOX concentration.
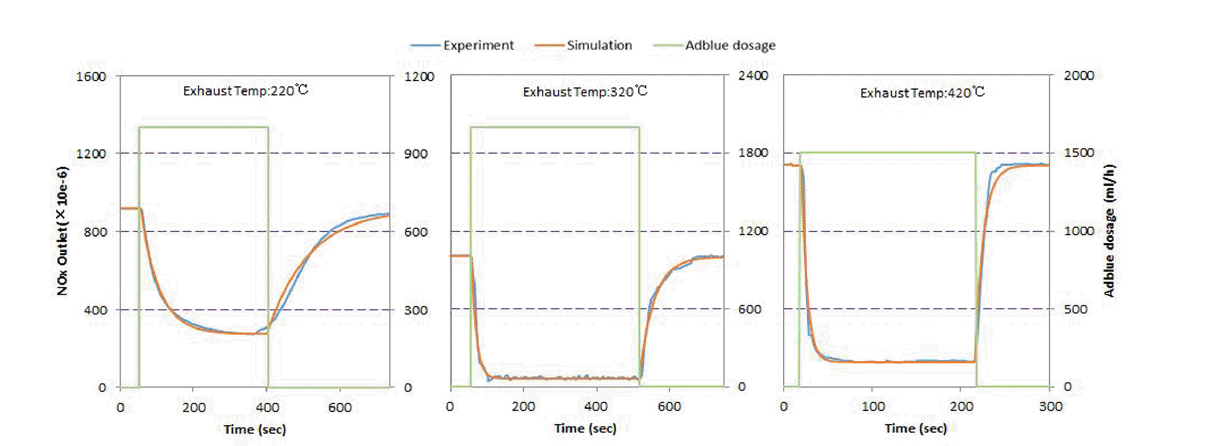
After the estimation of state parameters by using genetic algorithm, the simulation results well agreed with the experiment (Fig. 9) and the error less than 0.5%. The control strategies of Adblue dosage developed based on this model will have a better performance in keeping high NOX conversion efficiency and shortening the time t1 and t2, which can help to reduce NOX emission and avoid NH3 slip.
3.4. Model-based Control of Urea-SCR System
A model-based control strategy of urea-SCR system is presented in the paper (Fig. 10). The prediction of engine-out NOX is based on the NOX map that is derived from the universal performance curves. These steady-state values are corrected according to the change rate of speed and torque. What’s more, the maximal NOX conversion efficiency (the NH3 slip is keeping at 10 ppm) at different SV and exhaust temperature are taken into consideration in the calculation of basic Adblue dosage. Also, the Adblue dosage must be modified during the sudden changes of engine operating conditions. The variable RC model is used for the prediction of system-out NOX. According to the NOX target and prediction, the fuzzy controller gives the emendation of Adblue dosage. At last, a correction is made by the rapid increasing controller for preventing a greatly increase of Adblue dosage.
The model-based control strategy was verified by ETC and ESC test and the results were lower than Euro V emission standard limit 2.0 g/kw·h (Fig. 11). Furthermore, as the key part in the SCR control, this model can be easily used in other strategies.
4. Conclusions
The paper gives a comprehensive analysis of time delay of urea-SCR system, and the results show that the transportation delay of Adblue in injection pipe and exhaust flow delay are the main composition. A weight analysis of influencing factors is carried out and the result shows that the mass flux, temperature and NOX concentration of exhaust, the catalyst volume, the activation energy of NH3 ad/desorption and standard SCR reactions, and the Adblue dosage are the key factors of urea-SCR system.
Accordingly, a map of time delay is established and a solution method for time constant and proportional constant is carried out. Finally, the paper presents “variable RC model with time delay” to describe the input-output state relation of SCR system accurately and to reveal the regularity of different factors affecting SCR system characteristics. Moreover, this model can be used for a real-time correction of Adblue dosage, which can increase the conversion efficiency of NOX and avoid secondary pollution forming.