1. Introduction
Water scarcity, poor water quality and water related disasters are three main concerns for current and future water resources [1]. Urban water demand in many regions around the world grows continuously as a result of urbanization and increasing specific water demand, which leads for higher generation of wastewater. Wastewater is an immense resource, as paradigm shifts from only treatment to treatment along with energy and nutrient recovery. In current centralized approach of wastewater treatment, lager part of valuable nutrient and potent energy recovery is lost. Novel concept of source separation and in-situ treatment, which is slowly growing in recent years, is decentralized sanitation and reuse (DESAR). Source separation is not unaccustomed but this practice accompanied with onsite treatment assists in easy treatment, energy and nutrient recovery. In accession, decentralized concept assist in saving at least 25% of fresh water. This concept helps in reducing sewer line and its cross-section and installation depth. It also minimizes land usage and capital cost for building sewage storage reservoirs [2].
DESAR concept proposes separation of wastewater stream into brown water, yellow water and grey water from the household level. General trend of water consumption in houses around the world is 25% in toilet, 65% of water is used in laundry, kitchen sink, shower and 10% is used in other purposes which indicates that grey water is the major wastewater generated from a household level. Pollutant strength in domestic wastewater is highly variable. Pollutant strength depends on living habit of people, product usage and flushing system installation [3]. Black water is highly pathogenic and depends on food consumption pattern whereas grey water is less pathogenic which consist of 50%–80% of total household wastewater [2, 4].
A variety of processes and their combinations, such as ponds, sand filter, septic tank, and activated sludge has been applied for on-site wastewater treatment [5, 6]. Anaerobic on-site treatment is a sustainable option due to its low energy consumption, small space requirement, simple reactor design, and ability to endure long pauses in feeding. Anaerobic reactor is based on the concept of conventional septic tank [6, 7, 8]. Generally, four gradational processes occur in anaerobic reactor system for decomposition of substrate. In hydrolysis process, macro molecules like proteins, poly-saccharides and fats that compose the cellular mass of the excess sludge are converted into molecules with a smaller atomic mass that are soluble in water: peptides, saccharides and fatty acids. Acidogenesis or acidification process, results in the conversion of the hydrolyzed products into simple molecules with a low molecular weight, like volatile fatty acids (e.g., acetic-, pro-pionic- and butyric acid), alcohols, aldehydes and gases like CO2, H2 and NH3. This process is affected by a very diverse group of bacteria, the majority of which are strictly anaerobic. In acetogenesis, the products of the acidification are converted into acetic acids, hydrogen, and carbon dioxide by acetogenic bacteria. The first three steps of anaerobic digestion are often grouped together as acid fermentation. Bacteria generate H2 on two pathways concerning glucose as carbohydrate. Much hydrogen can be generated from glucose in the pathway (1). The generation rate of hydrogen is 4 mol/1mol-glucose, and that of acetic acid is 2 mol/1 mol-glucose.
In the final step of the anaerobic digestion process, the products of the acid fermentation are converted into CO2 and CH4. Only then will organic material be removed, as the produced methane gas will largely desorb from the liquid phase.
A study is needed to focus on production of hydrogen gas rather than methane gas because hydrogen gas is cleaner compared to methane. Methane burns to form CO2 but hydrogen burns to form H2O which does not emit carbon to atmosphere and has relatively higher calorific value than methane. In order to produce hydrogen, reaction in the reactor should follow pathway defined by reaction (1) above which can be achieved by different substrate and biomass pretreatment processes.
Anaerobic on-site treatment is especially suitable for concentrated wastewater, like black water (BW) originated from ordinary flush toilets, containing high COD [9]. However, the composition and concentration of pollutants varies due to volume of water used for any household and flushing purposes. From anaerobic treatment energy can be recovered in terms of H2 and CH4.
Membrane bioreactor (MBR) is the combination of a membrane (MF or UF) process like microfiltration or ultrafiltration to treat wastewater by suspended growth of biomass [6]. MBR is generally used to treat low strength wastewater, which is capable of removing pathogens and reclaims wastewater. The reclaimed water is used for watering garden, roads and street, and used in toilet flushes too [6].
The objective of this study is to treat wastewater in terms of organic removal via synergetic incorporation of anaerobic hydrogen fermentation with MBR, to analyze the energy recovery as hydrogen gas production, and to study whether this system could meet up the goals of DESAR technologies.
2. Materials and Methods
2.1. Inoculum and feedstock
The seed sludge was taken from an anaerobic digestion tank at local wastewater treatment plant in Changwon, South Korea. It was pretreated at 90°C for 30 minutes to inactivate H2-consumers such as methanogens. H2 producing (closturdium sp.) can form protective spores when they are in restrictive environment (high temperature, extreme acidity, alkalinity) pretreatment prevents completive growth and co-existence of bacteria which are H2 consuming [10]. The alternative for brown water was prepared artificially in laboratory. Brown water is the water selectively separated from urine diversion toilet. After diversion of urine (yellow water) the water with feces and other toilets use is brown water. The substrate used for preparation of synthetic brown water was glucose as a carbon source, along with sufficient inorganic nutrients. Inorganic nutrients used were of following concentrations (mg/L): NH4Cl 1,300; KH2PO4 250; MgCl2 · 6H2O 125; FeSO4 · 7H2O 5; ZnCl2 0.5; NiCl2 · 6H2O 0.5; 3BO4 H 0.5; Na2MoO4 · 2H2O 0.5; MnCl2 · 6H2O 2.5; KI 2.5; CoCl2 · 6H2O 2.5. Brown water composition found by Rajagopal et al. [11] is stated is stated (Table 1). As synthetic wastewater does not contain suspended solids and other particulates; high concentration of synthetic wastewater is used. The substrate COD concentration as brown water was 17,000 mg/L. The grey water used for MBR was collected from a household. Before grey water was injected to reactor it was passed through 200 μm screen. The characteristics of grey water used are shown in Table 2.
2.2. Reactor configuration and operational conditions
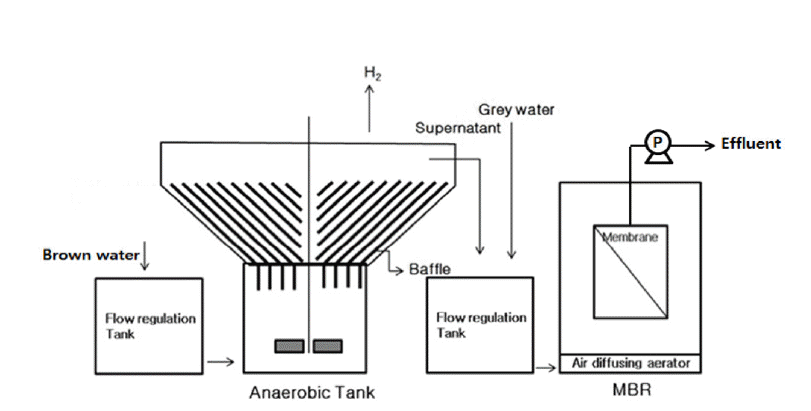
Fig. 1. shows the schematic diagram of anaerobic reactor coupled with MBR. Reactor type used in this experimental study is CSTR type inclined plate anaerobic fermenter. The inclined plates are placed to prevent and control sludge overflow. Heat pretreated anaerobic sludge was seeded to an anaerobic reactor with volume of 20 L; pH was maintained at 5.5 by pH controller. The stirrer was provided with low stirring capacity to maintain uniform pH throughout the reactor. Biomass concentration of 4,100 mg/L was seeded initially in the reactor. Operating temperature of reactor was 370.5°C. Temperature was maintained on reactor using water bath. Anaerobic reactor was followed by membrane bioreactor. MBR of capacity 60 L was coupled with anaerobic reactor. Table 3 shows the operating condition of anaerobic reactor.
The supernatant from anaerobic reactor was sent to MBR along with grey water where mixing and dilution of anaerobic supernatant occurs. Air was provided continuously in MBR to prevent early fouling of the membrane. Table 4 shows operating conditions of membrane bioreactor. General specifications of membrane used are specified in Table 5.
2.3. Analytical Methods
Amount of gas produced was recorded daily using the water displacement method. The content of the gas was analyzed using gas chromatograph (GC-2010 plus; Shimadzu, Japan) equipped with thermal conductivity detector (TCD) and 30m × 0.53mm, 50 μm MolSeive 5A open tabular capillary column (Restek Co., USA). Operational temperature of the injection port, column oven and the detector were 50, 35, and 120°C respectively. The carrier gas used was helium at the flow rate of 30 ml/min. Volatile fatty acids (VFA) was analyzed using High Performance Liquid Chromatograph (HPLC) (LC-20A; Shimadzu, Japan) equipped with an UV (210 nm) detector and 300 × 7.8 mm Aminex HPX-87H column. Samples were centrifuged at 12,000 rpm for 5 minutes before performing the VFA tests. Sulfuric acid of 0.005 M was used as mobile phase solution at flow rate of 0.6 mL/min.
3. Results and discussion
3.1. Anaerobic Hydrogen Fermentation
3.1.1. Organic Removal
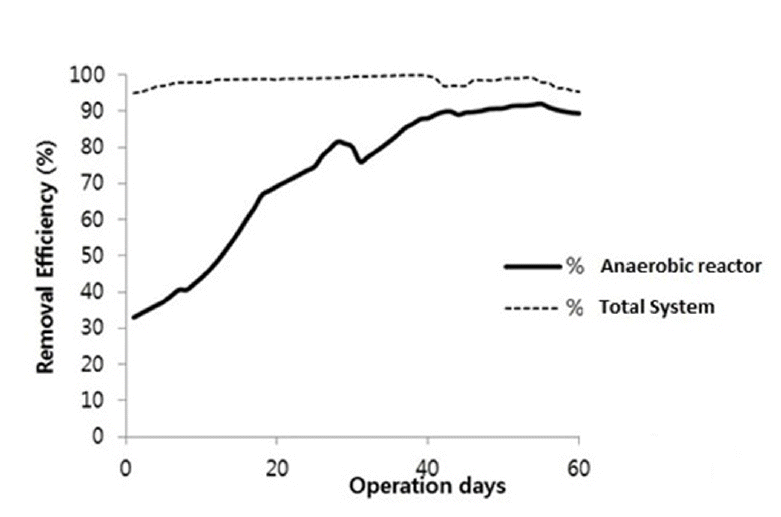
Substrate degradation (as COD reduction) during the anaerobic fermentation is depicted in Fig. 2. An utmost decrease in COD concentration is observed. The COD removal of the system increased gradually from day 5 and reached at the removal of 92% at day 55. It is reported that COD removal efficiency of more than 90% could be achieved in anaerobic reactor system treating domestic wastewater [12]. In anaerobic treatment; bacteria convert organic compounds (i.e., COD) into gas and biomass growth in environment without oxygen. COD removal by anaerobic reactor was gradually increasing from initial experiment to day 55 and started declining slightly from 56th day of operation. At the initial stage of the reactor operation, removal efficiency was low because of the lag phase. Lag phase was observed during which the cells adapt to their new environment and growth of cell and metabolic activities are low [13]. In case of present study, the fraction of incoming COD was degraded first at anaerobic reactor. During the operational period most of the COD was removed in the anaerobic system at first stage at maximum removal of 92% within 60 days of operation.
3.1.2. VFA Production
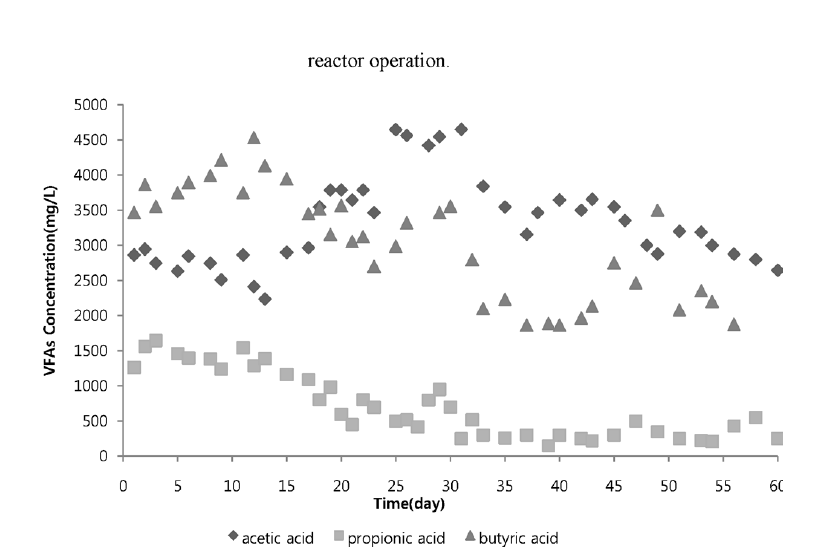
H2 productions are generally accompanied by acid and solvent production due to metabolism [14]. Acidic intermediates formed during the process generally reflect changes in the metabolic pathway of the microorganisms and provide a better insight which could be used to improve the conditions favorable for H2 production. Fig. 3 depicts the amount of VFA produced in the system. During the process of reactor operation, major terminal liquid products recorded were acetic acid, propionic acid and butyric acid. At initial stage of reactor operation, concentration of propionic acid was relatively high compared to operational days after day 20. Initially hydrogen production was inhibited by accumulation of propionic acid during reaction. Typical propionic acid forming bacteria consumes hydrogen in its reaction of generating propionic acid [15]. After day 20 propionic acid concentration is gradually diminished and acetic and butyric acids formation is high.
Generally butyrate to acetate (B/A) ratio plays a significant role in CSTR and butyrate to propionate (B/P) ratio was found to be the most important factor in hydrogen production in anaerobic sequencing batch reactor (ASBR) [16]. The study of similar ratio is made in this system, B/P ratio. At initial stage of reactor operation, B/P ratio was low resulting in low production of hydrogen gas. As B/P ratio increased gradually after day 20 hydrogen productions is also increased in the reactor. This indicated that B/P ratio should be higher for better performance of anaerobic reactor to produce hydrogen gas. Asserting that hydrogen consuming propionic acid should be diminished in the reactor.
3.1.2. Hydrogen Gas Production
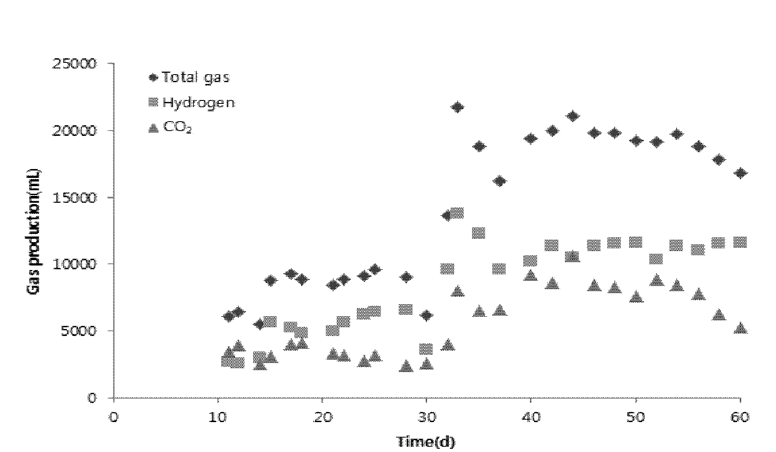
Fig. 4 illustrates the variation of the total gas and hydrogen gas produced. The experimental data depicted the feasibility of H2 production by utilizing glucose as substrate along with COD removal. The H2 yields differed significantly with the strength of wastewater used as substrate and experimental data illustrate the influence of substrate/organic loading on process. The reactor was operated at 0.94–1.2 kg COD/day for period of 60 days. Initially, at the start-up of the reactor, there was no or negligible amount of hydrogen produced due lag phase during which microorganism were not adapted to the environment and the impact of organic loading. With the speed of microorganism growth gradually accelerated in log growth phase, hydrogen producing rate and hydrogen content were also increasing with the fermentation process. After the start-up of the operation, about 30 days later, maximum gas producing rate and hydrogen content were found to be 4.6 L/day and 52.38% respectively. From the 5th day to 20th day, total gas and hydrogen production kept increasing until the phase of stable period. The main components of the produced gas were found to be hydrogen and carbon dioxide. No methane in the produced gas was detected; this is due to suppression of methanogen bacteria by pre heat treatment of sludge and high COD concentration and toxicity of organic acids accumulated. Higher hydrogen generation after day 40 of reactor operation can be attributed to increase in acetic acid concentration as shown in Fig. 3. Operation of reactor with relatively high VFA concentration (around 6,000 mg/L) as acetic acid is preferred to ensure additional inhibition of H2 consuming microorganisms [17]. Hydrogen production at similitude operating condition was found 11% higher compared to this study (64%) and no methane production was marked by Fang et al. [18]. Nevertheless, the result of hydrogen gas produced at similar operating condition was analogous to the result obtained by (43%–53%) Lin et al. [19] and hydrogen production marked in this study is higher than the result obtained by (9%–15%) Nakamura et al. [20].
3.2. Membrane Bioreactors (MBR)
3.2.1. Organic Removal
Accompanying MBR stage with anaerobic treatment served as treatment augmentative and water polishing step which removed major incoming COD from mixture of grey water and anaerobic reactor effluent. The combination of anaerobic reactor and MBR assist to reclaim wastewater for further reuse. Fig. 5 illustrates the treatment performance of MBR accompanied with anaerobic system. The MBR treated more than 98% of incoming COD in the system. In membrane bioreactor, grey water was mixed with supernatant of anaerobic reactor system which diluted the supernatant concentration from anaerobic reactor. The microorganism in grey water used the anaerobic reactor effluent as a substrate for MBR system in aerobic condition. The MBR enhanced the performance of the whole system. COD removal efficiency of solely anaerobic reactor and whole system is illustrated in Fig. 6.
3.2.2. Membrane Performance
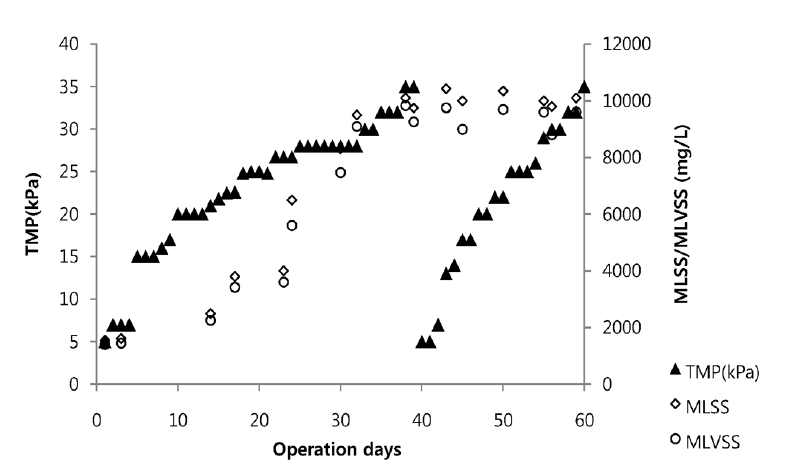
Fig. 7 illustrates the evolution of trans membrane pressure (TMP) in the membrane bioreactor operation. The more mixed liquor suspended solids (MLSS) concentrations rise up, the more TMP increased. But the TMP did not increase linearly. Some authors report an increase in fouling with increasing MLSS concentrations [21, 22], but it is not clear which parameter determines the resulting flux. The membrane fouling does not increase instantly and it needs some amount of time to reach maximum TMP because it needs time to increase MLSS concentration and EPS production to a sufficient level. TMP was gradually increasing from 5 KPa to 35 KPa from the day of operation to 40th day of operation. When the membrane reached to the TMP of 35 KPa at day 40, chemical cleaning of membrane was done using NaOH 0.1 M solution. The cleaned membrane was again used in membrane; this time there was rapid increase in TMP from 5 to 35 KPa within 30 days. This short time TMP increase is due to increasing MLSS concentration in the bioreactor.
3.2.3. Water Quality for Reuse
Water reuse is great method to conserve, protect water sources and save energy and economy. Reclaimed water can be employed for urban reuse, industrial reuse agricultural reuse, environmental and recreational reuse; groundwater recharge etc. Urban reuse can include systems serving a large user which includes parks playground athletic fields, highway medians, golf courses and other recreational facilities. Industrial reuse includes pulp and paper factory, chemical industry, textile industry petroleum and coal industry etc. There exists the great market of reclaimed water for reuse. Fig. 5 illustrates that integration of anaerobic reactor and MBR system assists in water reuse in domestic level. Average permeate concentration is below 20 mg COD/L. EPA recommends reclaimed water of organic concentration less than 20 mg COD/L can be reused except for wetlands and groundwater recharge[23]. Korea standards for water reuse revised in 2001 urges COD concentration should be less than 20 mg/L for water reuse[24]. From the above experiment, it can be asserted that combination of anaerobic reactor and membrane bioreactor can be implemented as a technology for domestic wastewater treatment and reuse.
3.3. Organic Mass Balance Over the System
Organic mass balance for the system could be represented as follows.
Where, MI is total COD of influent, MO is total COD of effluent, MBG is COD assimilated for biomass growth, MGs is the COD corresponding to gas production in anaerobic rector, and MSW is COD in wasted sludge. Continuous measurement was conducted for 20 days to calculate mass balance when the steady-state was reached. According to the mass balance calculation, mass flow diagram for the process was prepared in Fig. 8. Total income COD, 340 g/day was mostly removed in the anaerobic reactor producing 80 g/day effluent soluble COD. 16g/day of COD was calculated to be consumed for biomass growth based on the MLVSS concentration in the reactor. The COD transfer to H2 and CO2 gas was 24 g/day and 15 g/day, respectively. The gas transfer COD was calculated using measured gas volume during the operation period of the anaerobic reactor. Theoretical coefficient of hydrogen production via glucose 89.62 L H2/192 g COD was used to calculate COD to hydrogen and factor of 1 kg CO2/kg COD was used to calculate conversion of COD to carbon dioxide [25, 26]. The COD outgoing was assumed by over flow of sludge due to foaming, floating sludge, influent injection procedures. Around 10% of COD was assumed to be outgoing as overflow sludge [28]. However the calculated difference between incoming and outgoing COD in anaerobic reactor was about 50%. Similar difference in COD mass balance was observed in hydrogen production using maghemite nanoparticle in ASBR by Nasr et.al [27]. The high gap between incoming and outgoing COD could be attributed to transfer of COD into alcohols, residual gelatins unknown metabolites EPS, SMP’s and other biomass forming agents, assumptions made and instrumental/experimental errors [28]. The incoming and outgoing difference of COD in MBR was 9%. 64% of incoming COD in MBR was calculated to transfer for biomass growth and 27% of COD was transferred to CO2. The loss of COD could be credited because of not considering production of volatile compounds, unknown metabolites, biomass and constituents of cake formation on membrane and other end products produced in reactor [29].
4. Conclusions
Combination of anaerobic hydrogen fermentation (AHF) and membrane bioreactor exhibited high performance in removal of organics. More than 98% of COD was removed by the system. AHF system provided maximum hydrogen production and hydrogen content of 4.6 L/day and 52.38%, respectively after system operates in steady state condition. MBR integrated with AHF could produce higher effluent quality and proved combination as promising technology for future of water reuse. However, performance of MBR is dependent on growth of biomass in reactor which imparts rise in MLSS concentration in MBR system contributing to membrane fouling and rise in TMP. Result of this study exhibited that COD is not completely degraded but is transformed to different reactor byproducts. Organics mass balance illustrates the loss of COD over the system; this loss is associated with various unaccountable products and loss due to volatilization of compounds from MBR system under aerated conditions. Finally, AHF-MBR system could provide desirable organics removal for further water reuse and produce clean energy on-site which meets up to the goals of DESAR technology minimizing waste and economic load to centralized treatment system.
Nomenclature
APHA
American Public Health Association
ASBR
Anaerobic Sequencing Batch Reactor
B/A
Butyric to Acetic acid Ratio
B/P
Butyric to Propionic acid Ratio
BW
Brown Water
CSTR
Continuous Stirred Tank Reactor
COD
Chemical Oxygen Demand
DESAR
Decentralized Sanitations and Reuse
EPS
Extracellular Polymeric Substances
HPLC
High Performance Liquid Chromatograph
MBR
Membrane Bioreactors
MF
Microfiltration
MLSS
Mixed Liquor Suspended Solids
SS
Suspended Solids
TMP
Trans Membrane Pressure
UF
Ultrafiltration
VFA
Volatile Fatty Acids
VSS
Volatile Suspended Solids


