1. Introduction
In recent years, electronic waste (e-waste) has become one of the most conspicuous waste groups of all the waste types. Continuous improvement in electrical and electronic equipment technology increases the consumption and circulation of such material and, as a result, the lifetime of electrical and electronic devices has been decreased. E-waste has accumulated on an enormous scale, exceeding 53.6 million metric tons in 2019, and the quantity continues to increase [1, 2]. According to the Global E-Waste Monitor’s 2020 report, the amount of e-waste is estimated to reach 74.7 million metric tons by 2030 [1]. Printed circuit boards (PCBs), which are the basic parts of electronic equipment, increase significantly with the increase of e-waste, and it is estimated that 4% of such e-waste will consist of PCBs [3].
Although PCBs are only about 4% of the total weight of e-waste, they have an important economic value due to their precious metal content. These metals are 0.04% gold (Au), 0.16% silver (Ag), 0.01% palladium (Pd) and 18.4% copper (Cu) by weight [4]. The levels of precious metals in electronic waste vary significantly between 10–1,600 ppm Au, 200–20,000 ppm Ag, and 5–970 ppm Pd, but in most cases, it exceeds what is traditionally expected in mineral ores. A rich gold ore typically contains 0.0018% (18 ppm) gold by weight, and a typical silver ore contains 0.085% (85 ppm) silver [5]. Therefore, they can be considered as ‘artificial ore’. According to a study by the US Environmental Protection Agency, the recovery of metals from e-waste has significant advantages compared to primary metal production, such as lower energy consumption and less secondary waste generation [6]. In this context, the investigation for inexpensive and efficient separation techniques to recover precious metals from secondary sources, such as waste PCBs, is important both environmentally and economically.
There have been several studies on the recovery of precious metals from waste PCBs by pyro-metallurgical, hydro-metallurgical, and bio-metallurgical processes. Compared to other separation processes, adsorption is a favorable process for metal recovery due to its lower cost, higher efficiency, and lower residue production [7]. Adsorption is an efficient and economical technology for the recovery of precious metals from secondary sources by biomass, such as bacteria, fungi, algae, and agricultural and industrial by-products [8], which are generally abundant and cheap as alternative adsorbents. Losev et al. [9] use pine sawdust for the extraction of precious metals like gold, palladium, and platinum (Pt) from dilute solutions of hydrochloric acid. Egg-shell membrane, which is protein-rich biomass is also used for recovery of these metals [10]. Chemically modified chitosan resin with magnetic properties was investigated for the recovery of Au (III) and Ag (I) from their aqueous solutions [11]. Polyethylenimine (PEI) modified Lagerstroemia Speciosa leaves powder (PEI-LS) as a biosorbent was efficiently applied for gold recovery from acidic solution [12]. Recovery of Au (III) in an aqueous hydrochloric acid medium using lemon peel has also studied, and the lemon peel was found to adsorb Au (III) highly selectively [13]. Saman et al. [14] report that lignocellulosic materials can be used as adsorbents for the adsorptive recovery of Au (III) ions from an aqueous solution. Taşdelen et al. [15] investigate the recovery of gold from synthetic solutions using cellulose beads treated with 2-(diethylamino) ethyl chloride hydrochloride solution (DEAE-cellulose). The results show that gold can be efficiently recovered using excessive amounts of DEAE-cellulose. Sericin and alginate particles chemically cross-linked by proanthocyanidins (SAPAS) have been successfully used for gold recovery from wastewater [7].
Among biological materials, agricultural by-products are relatively cheap and exhibit extremely high adsorption capacities. One agricultural waste material from the orange juicing industry is orange peel, which is abundant, inexpensive, and easily available [16]. Orange peel is a material composed of several constituents. Among them, pectin (galacturonic acid), hemicellulose, cellulose, and lignin acid carry various polar functional groups, including carboxylic and phenolic acid groups, which can be included in the complex of metal ions. Due to its low cost, orange peel is an attractive and inexpensive alternative for the adsorptive removal of dissolved metals [17]. Waste orange peel has a large surface area, high swelling capacity, high adsorption capacity, low cost, and easy availability according to the literature [18]. Several studies have used orange peel as an adsorbent for the removal of dye [19, 20], herbicides [21], and various metals [22–27].
In this study, which differs from the literature, the sequential adsorption of gold (Au), copper (Cu), silver (Ag), and palladium (Pd) from waste PCBs using bio-sorbents was the aim. Waste orange peel and derivatives, which are organic waste that occur in high quantity and can only be used in animal feed in Turkey, were used as bio-sorbent. For separation of the metal components from the organic material, adsorption studies were conducted with the solid products of the pyrolysis of PCBs.
2. Materials and Methods
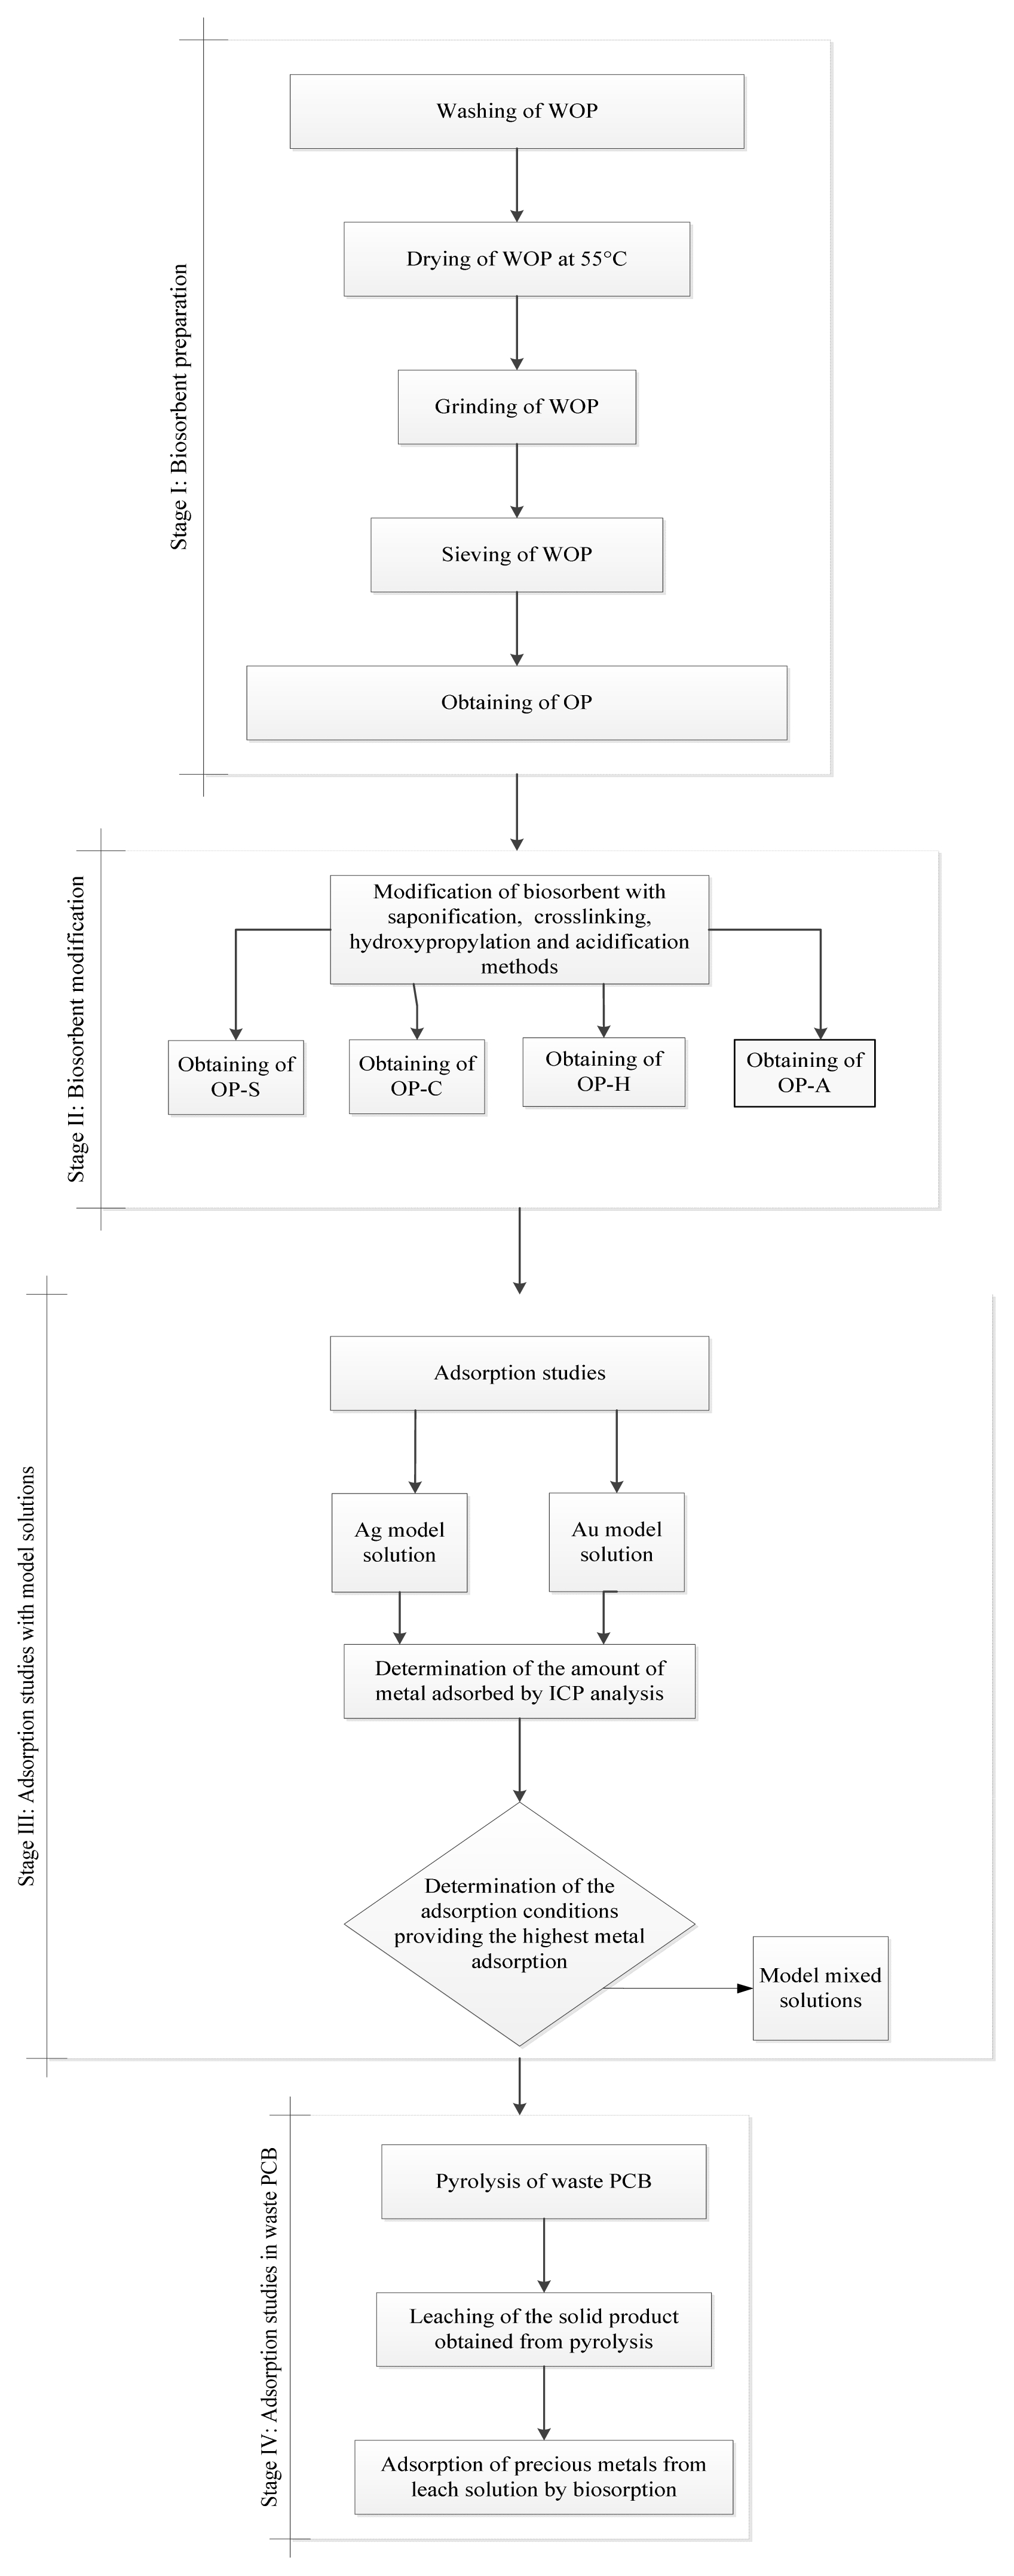
This study consists of four stages (Fig. 1). In the first stage, bio-sorbent OP is derived from waste orange peel (WOP) and OP is chemically modified to improve the metal sorption behavior. In the second stage, adsorption experiments are performed with bio-sorbent derivatives under various conditions using Au and Ag model solutions, with the best adsorption conditions being determined. In the third stage, model solutions including Au, Cu, Ag, and Pd, which are frequently used on waste PCBs, are prepared, and adsorption efficiencies are examined in the presence of different metals. Finally, the prepared PCB sample is pyrolyzed in a fixed bed stainless steel reactor to obtain an only-metal-containing solid product. After this, the leaching of metals from the solid product is performed. In the last stage, sequential adsorption studies on the leach solution of the solid product obtained from PCB pyrolysis are conducted under determined optimum conditions.
2.1. Bio-sorbent Preparation
To obtain OP, the WOP was washed with ultrapure water, oven-dried, ground, and sieved to a particle size of 0.2–0.5 mm. The OP was chemically modified by saponification, crosslinking, hydroxypropylation, and acidification [28]. For saponification, 10 g of the OP was stirred with 100 mL of 0.1 M sodium hydroxide (NaOH) solution at 200 rpm for two hours at 25°C. It was rinsed with distilled water, and oven-dried at 55°C to obtain OP-S (orange peel prepared by saponification). For crosslinking, 10 g of the OP was stirred with 100 mL of ultrapure water containing 0.2 g of sodium trimetaphosphate (STMP) and 0.5 g of sodium tripolyphosphate (STPP) at 200 rpm at 40ºC for two hours. It was rinsed with distilled water, oven-dried at 55°C to obtain OP-C (orange peel prepared by cross-linking). For hydroxypropylation, 1.5 g of sodium sulfate (Na2SO4) was dissolved in 100 mL of distilled water, 10 g of the OP was added to the solution and the pH was adjusted to 10.5 with NaOH. After adding 1 mL of propylene oxide, the mixture was stirred at 200 rpm at 40ºC for twenty-four hours. It was rinsed with distilled water, oven-dried at 55°C to obtain OP-H (orange peel prepared by hydroxypropylation). For acidification, 10 g of OP was stirred with 100 mL of 0.1 M citric acid solution at 200 rpm for two hours at room temperature. It was rinsed with distilled water, oven-dried at 55°C to obtain OP-A (orange peel prepared by acidification).
2.2. Adsorption Studies with Model Au and Ag Solutions
In adsorption studies, first of all, the model solutions were prepared in 10 and 25 mg/L using Fluka analytical standards for Au and Ag, respectively. To determine the optimum pH, preliminary experiments were carried out with a contact time of 120 min at two different pH (2 and 5), keeping the temperature and bio-sorbent type constant (25°C and OP). Based on the highest adsorption efficiencies, the optimum pH was determined to be 2 for Au and 5 for Ag.
Equilibrium experiments with a sorbent concentration of 10 g/L at different temperatures (25, 40, and 60°C) were carried out to study the effect of temperature on Au and Ag adsorption onto OP, OP-S, OP-C, OP-H, and OP-A. 15 mL samples were taken every 5 min in the first 30 min, and every 15 min in the last 90 min. Ag concentrations of the samples were measured using a Varian ICP-OES, while Au concentrations were determined with Agilent ICP-MSMS. For Au isotherm studies, different weights of adsorbent (0.05; 0.10; 0.20; 0.30; 0.40 and 0.50 g) were mixed with 200 mL of solutions containing 10 mg/L of Au under constant stirring for two hours. For Ag isotherm studies, weights of adsorbent used were 0.25; 0.50; 0.75; 1.0; 1.25; 1.50; 1.75; 2.0 and 2.50 g for 200 mL of 25 mg/L Ag solution. The Freundlich, Langmuir, and BET models were tested [29, 30].
The pseudo-first-order, diffusion, and pseudo-second-order models were used for the analysis of exchange kinetics are represented as, respectively:
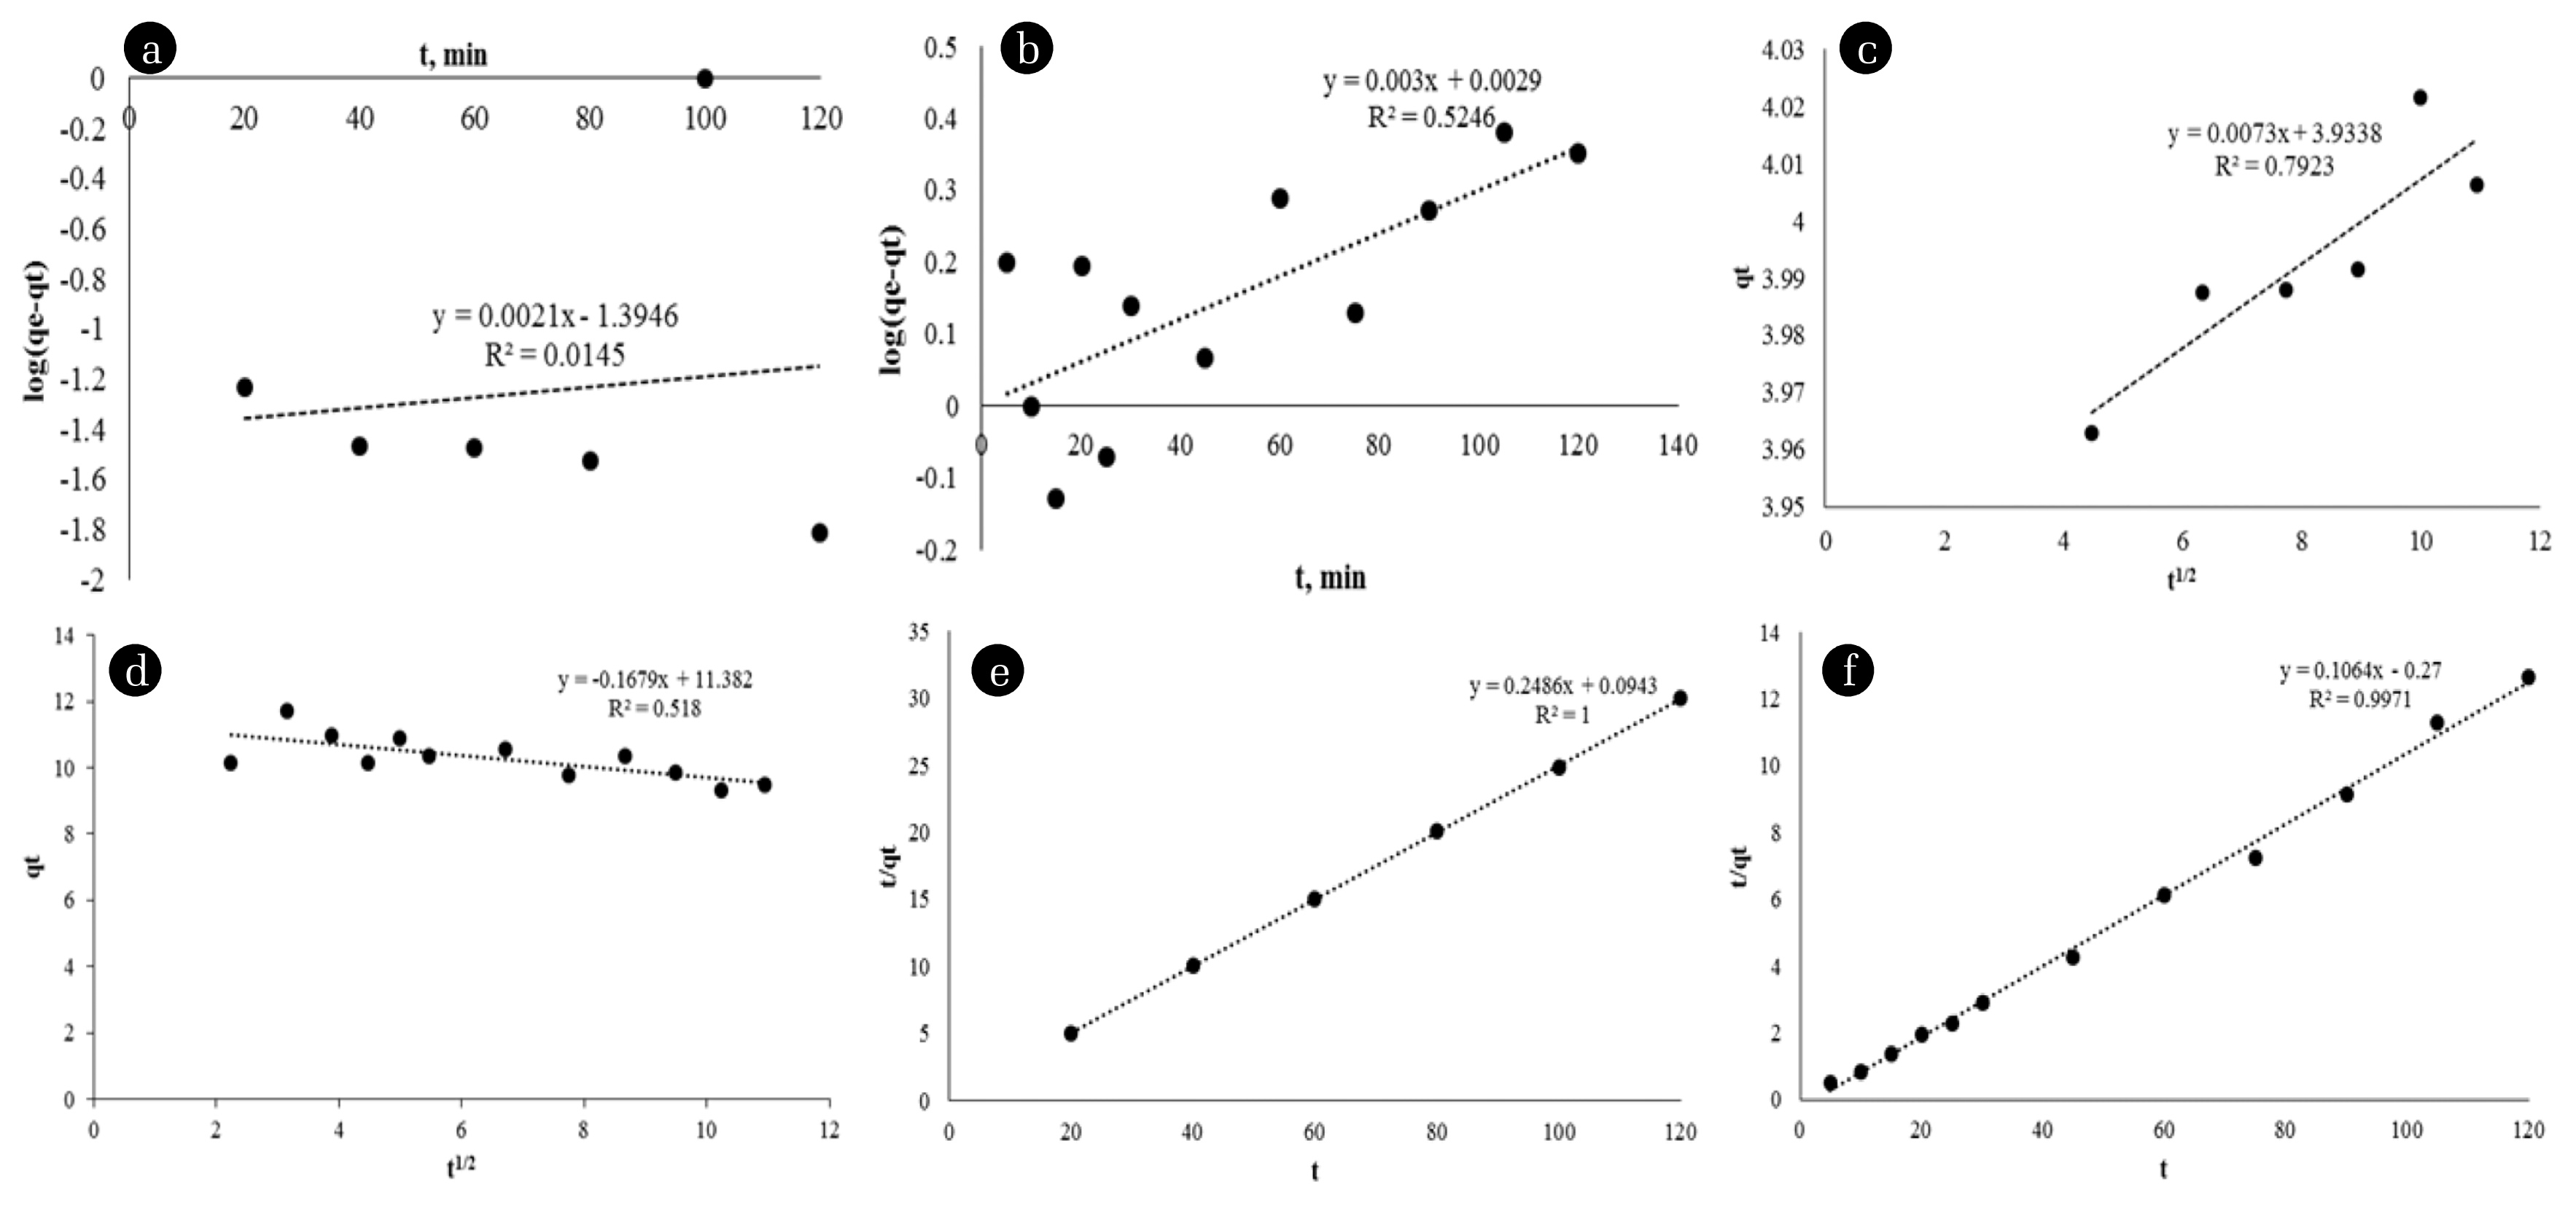
where k is the rate constant (g/mg min). For the pseudo-first-order model, values of k1 and qe were derived from the linear plots of log(qe-qt) against t. In the diffusion model, the values of kd and C were derived from the linear plots of qt against t1/2. Finally, for the pseudo-second-order model, the values of k2 and qe2 were derived from the linear plots of t/qt against t.
In addition, to evaluate the validity of the kinetic and isotherm models, the regression of determination coefficient (R2) and residual root-mean-squared error (RMSE) were calculated [31]. The RMSE equation can be expressed as follows:
where, qexp,n, and qtcal (mg/g) are the experimental results and calculated values from the model equations for the isotherm and kinetic studies, respectively. While the lower values of RMSE are considered the best estimation, the higher value R2 is preferable in terms of good accuracy [32].
For thermodynamic properties, changes in the standard free energy (ΔG0), enthalpy (ΔH0), and entropy (ΔS0) were calculated using the following equations:
where KC is the equilibrium constant, CAe is the amount of Au and Ag uptake (mg/L), CSe is the equilibrium concentrations of Au and Ag (mg/L), T is the temperature (K), and R is the gas constant (8.31 J/mol.K). In Eq. 6, the standard free energy was determined. A graph was prepared according to KC and 1/T and ΔHº, and ΔSº were calculated from the slope and intercept of this graph.
2.3. Adsorption Studies with Model Mixed Solutions
In this stage, two different model solutions were prepared. One of these (Model I) contained 75 mg/L Cu, 10 mg/L Au and 10 mg/L Pd, and the other (Model II) included 75 mg/L Cu, 25 mg/L Ag, and 10 mg/L Pd. In experiments on the Model I and Model II mixing solutions, the adsorption processes were carried out sequentially. Au and Ag adsorption studies were carried out with these solutions at optimum conditions, which were obtained at the previous stage. The optimum working conditions for Cu and Pd were determined by the results from our previous studies [28, 33]. OP-C for Au adsorption at pH 2 and 25°C, OP-S for Cu adsorption at pH-5 and 25°C, and OP for Pd adsorption at pH 5 and 60°C were added to the Model I solution, respectively, and mixed for 30 minutes at each stage. OP-S for Cu adsorption at pH 5 and 25°C, OP-C for Ag adsorption at pH 5 and 25°C, and OP for Pd adsorption at pH 5 and 60°C were added to the Model II solution, respectively, and mixed for 30 minutes at each stage. After each stage, following the separation of the bio-sorbent by filtration from the model solutions, a 15 mL sample was taken and analyzed with ICP.
2.4. Adsorption Studies in PCB Waste
In the final stage, PCB waste was pyrolyzed under atmospheric pressure at 500ºC with a 35°C/min heating rate in a fixed bed stainless steel (380 S) 240 cm3 reactor. In order to concentrate the bromine in the glass fiber contained in the PCB, zeolite was added to the PCB to be pyrolyzed at a ratio of 3:1 [34]. The metallic composition of the solid product was determined using ICP analysis.
The leaching solution was prepared by dissolving 5 g of pyrolysis solid product with 50 mL aqua regia (HCl and HNO3). Recovery of metals from the leach solution was carried out sequentially, similar to Section 2.3. Firstly, 5 g OP-C was added to the solution at pH 2 and 25°C for Au adsorption. After 30 minutes, the bio-sorbent was separated by filtration and it was passed to the next step. The same processes were carried out with 5g OP-S at pH 5 and 25°C for Cu, 5g OP-C at pH 5 and 25°C for Ag, and 5g OP at pH 5 and 60°C for Pd. After each stage, a 15 mL sample was taken and analyzed with ICP.
3. Results and Discussion
3.1. Equilibrium Results
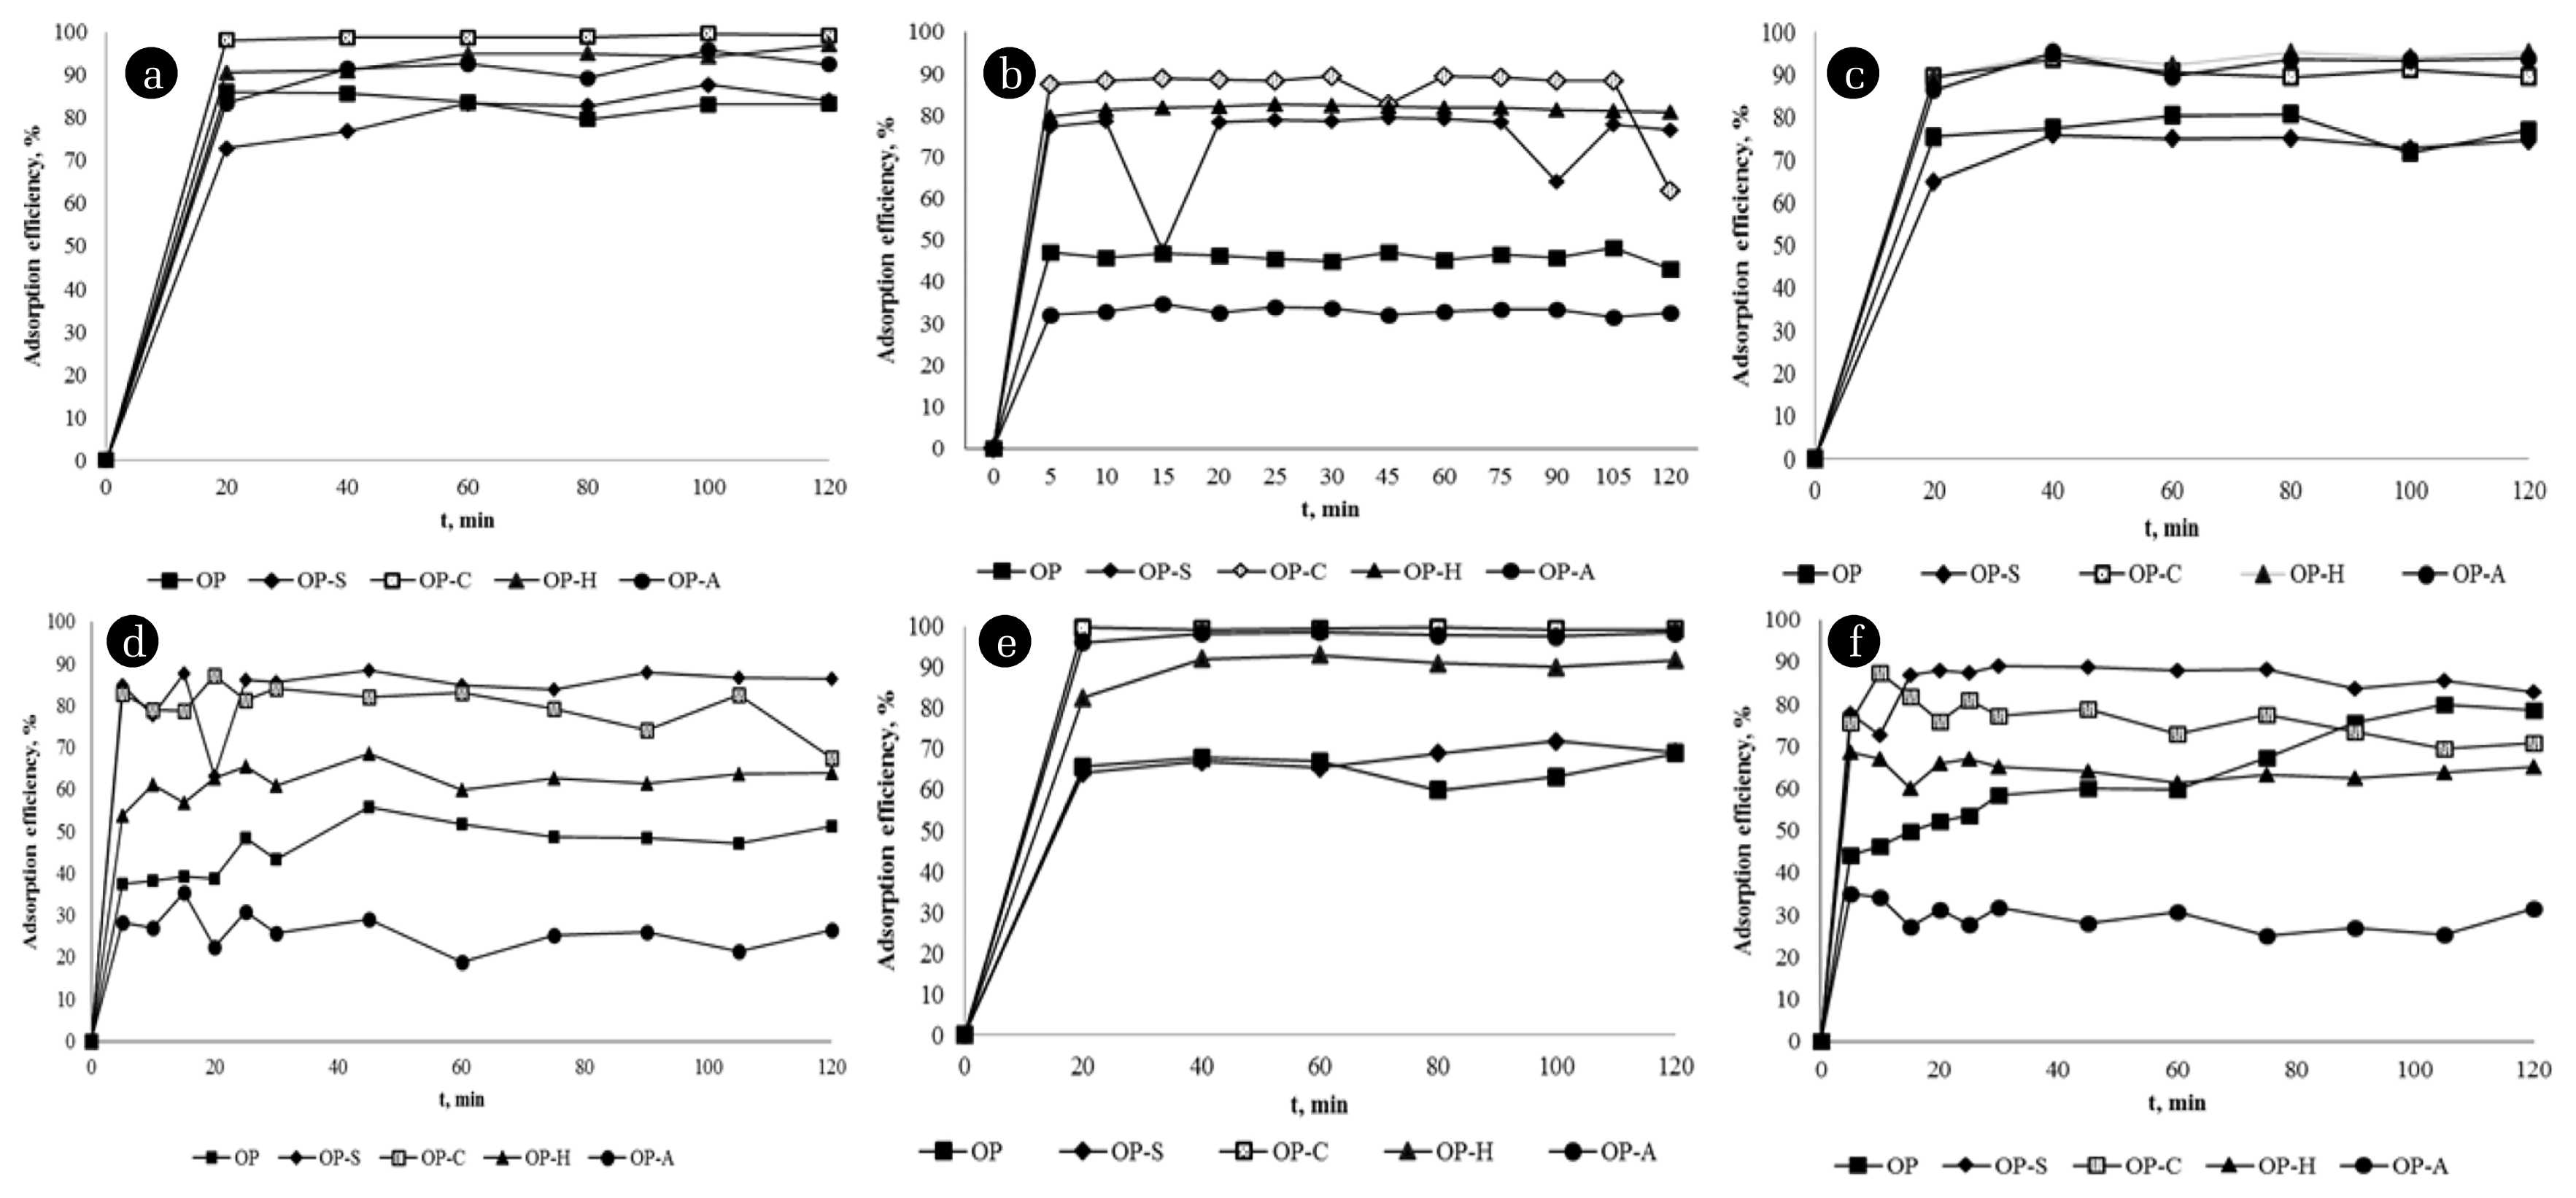
Equilibrium experiment results with the OP, OP-S, OP-C, OP-H, and OP-A at 25, 40, and 60°C are given in Fig. 2. With the increase in temperature, no increase in adsorption efficiency was observed, and it was decided that the optimum temperature was 25°C, considering low energy consumption. According to the plots, higher efficiencies are achieved in a shorter time in the Au adsorption. While the OP and OP-S efficiencies are within the range of 60–70%, the OP-H and OP-A yield is 70–80%. It can be seen that OP-C is the most effective derivative in Au adsorption with a yield of close to 100%. For Ag, it is noteworthy that the efficiencies vary significantly (30–90%) according to the modification types, and the lowest efficiency is observed for OP-A at all temperatures. In summary, it can be seen that the best adsorbent is OP-C at 25°C for both Au and Ag. Under these conditions, Au adsorption efficiency is approximately 100% and Ag adsorption efficiency is approximately 90%. In addition to the remaining hydroxyl and carboxyl groups in pectin, cellulose, and lignin [28], the contribution of phosphate groups added by cross-linking in the adsorption of Au and Ag is obvious. However, further work should include additional analysis by FT-IR and X-ray photoelectron spectroscopy (XPS) for a clearer understanding of the metal-binding mechanism.
3.2. Isotherm Results
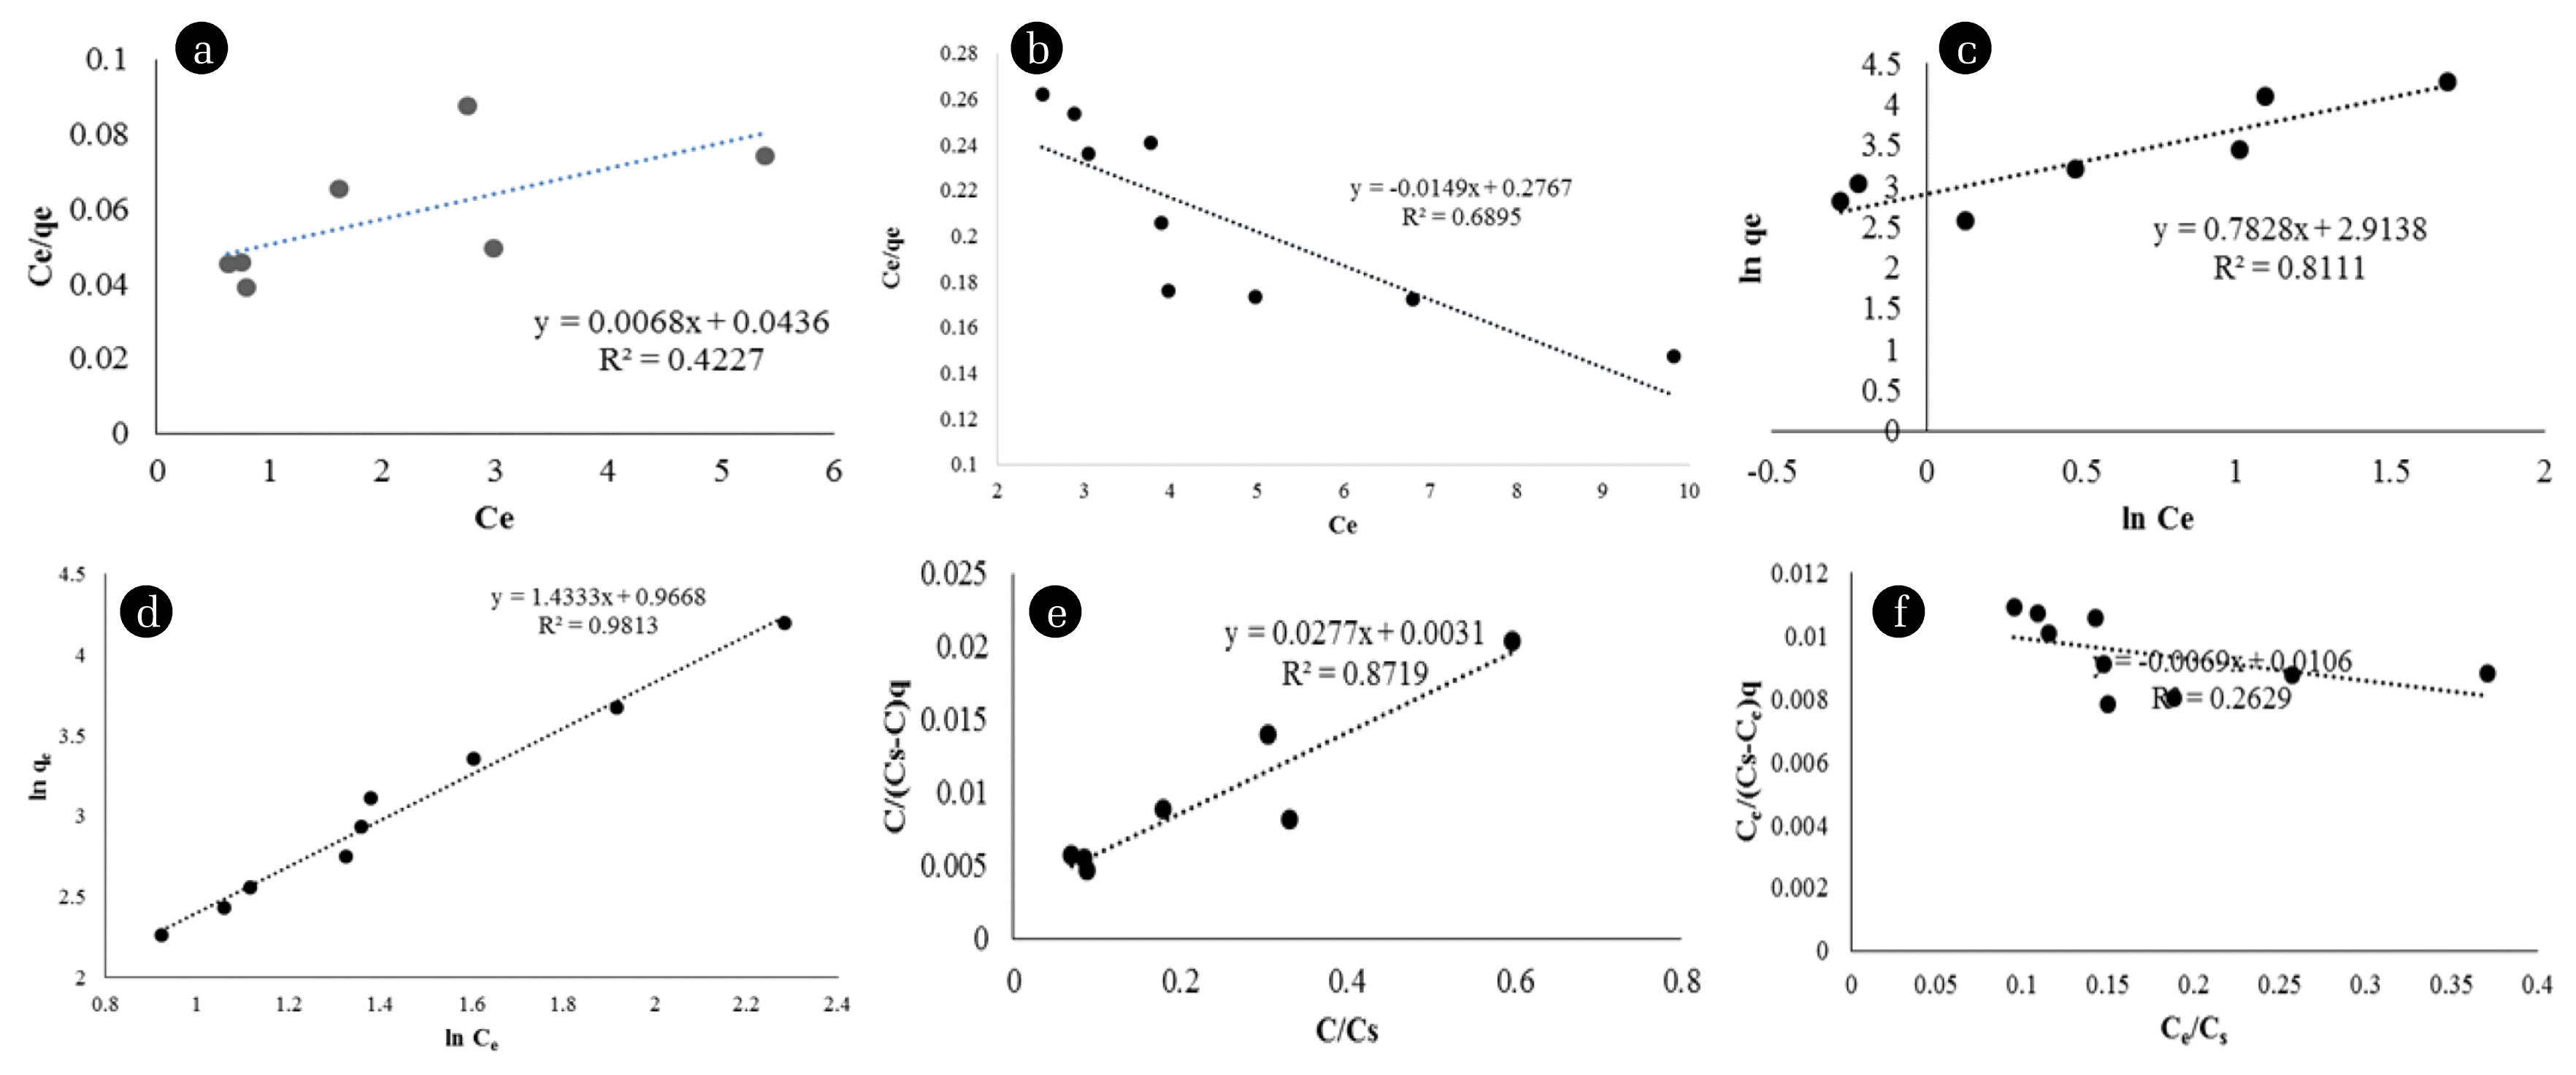
Langmuir, Freundlich, and BET isotherms plots, according to the final Au and Ag concentrations of different weights of OP-C, are presented in Fig. 3. In addition, Table 1 shows the values of the coefficients for these isotherm models. According to the regression coefficient values R2 in Table 1, it may be pointed out that the adsorption isotherms can be fairly described by the Freundlich equations for Ag and the BET equations for Au adsorption. However, high RMSE values in BET isotherms are quite remarkable. Therefore, it is possible to say that the Freundlich isotherm is suitable for both metals. The values of the Langmuir constants represent favorable conditions for adsorption, but low correlation coefficient values indicate that the Langmuir model is less suitable for the current adsorption study than others. Therefore, for the Langmuir model, Ce/qe versus Ce is found to be highly nonlinear. Although R2 is the highest in the Freundlich isotherm for Ag, 1/n < 1 indicates that it is more successful for Au adsorption. 1/n > 1 for Ag adsorption indicates irreversible or linear adsorption [12]. The fact that Kf has a higher value in Au adsorption supports this situation. The correlation constants are higher for the Au BET model, so that multi-layer sorption can occur during the adsorption process from Ag. This indicates that both multi-layered and heterogeneous surface conditions coexist under the applied test conditions [35]. The adsorption curves show that the maximum uptake values for Au and Ag are 72.65 and 66.75 mg/g, respectively.
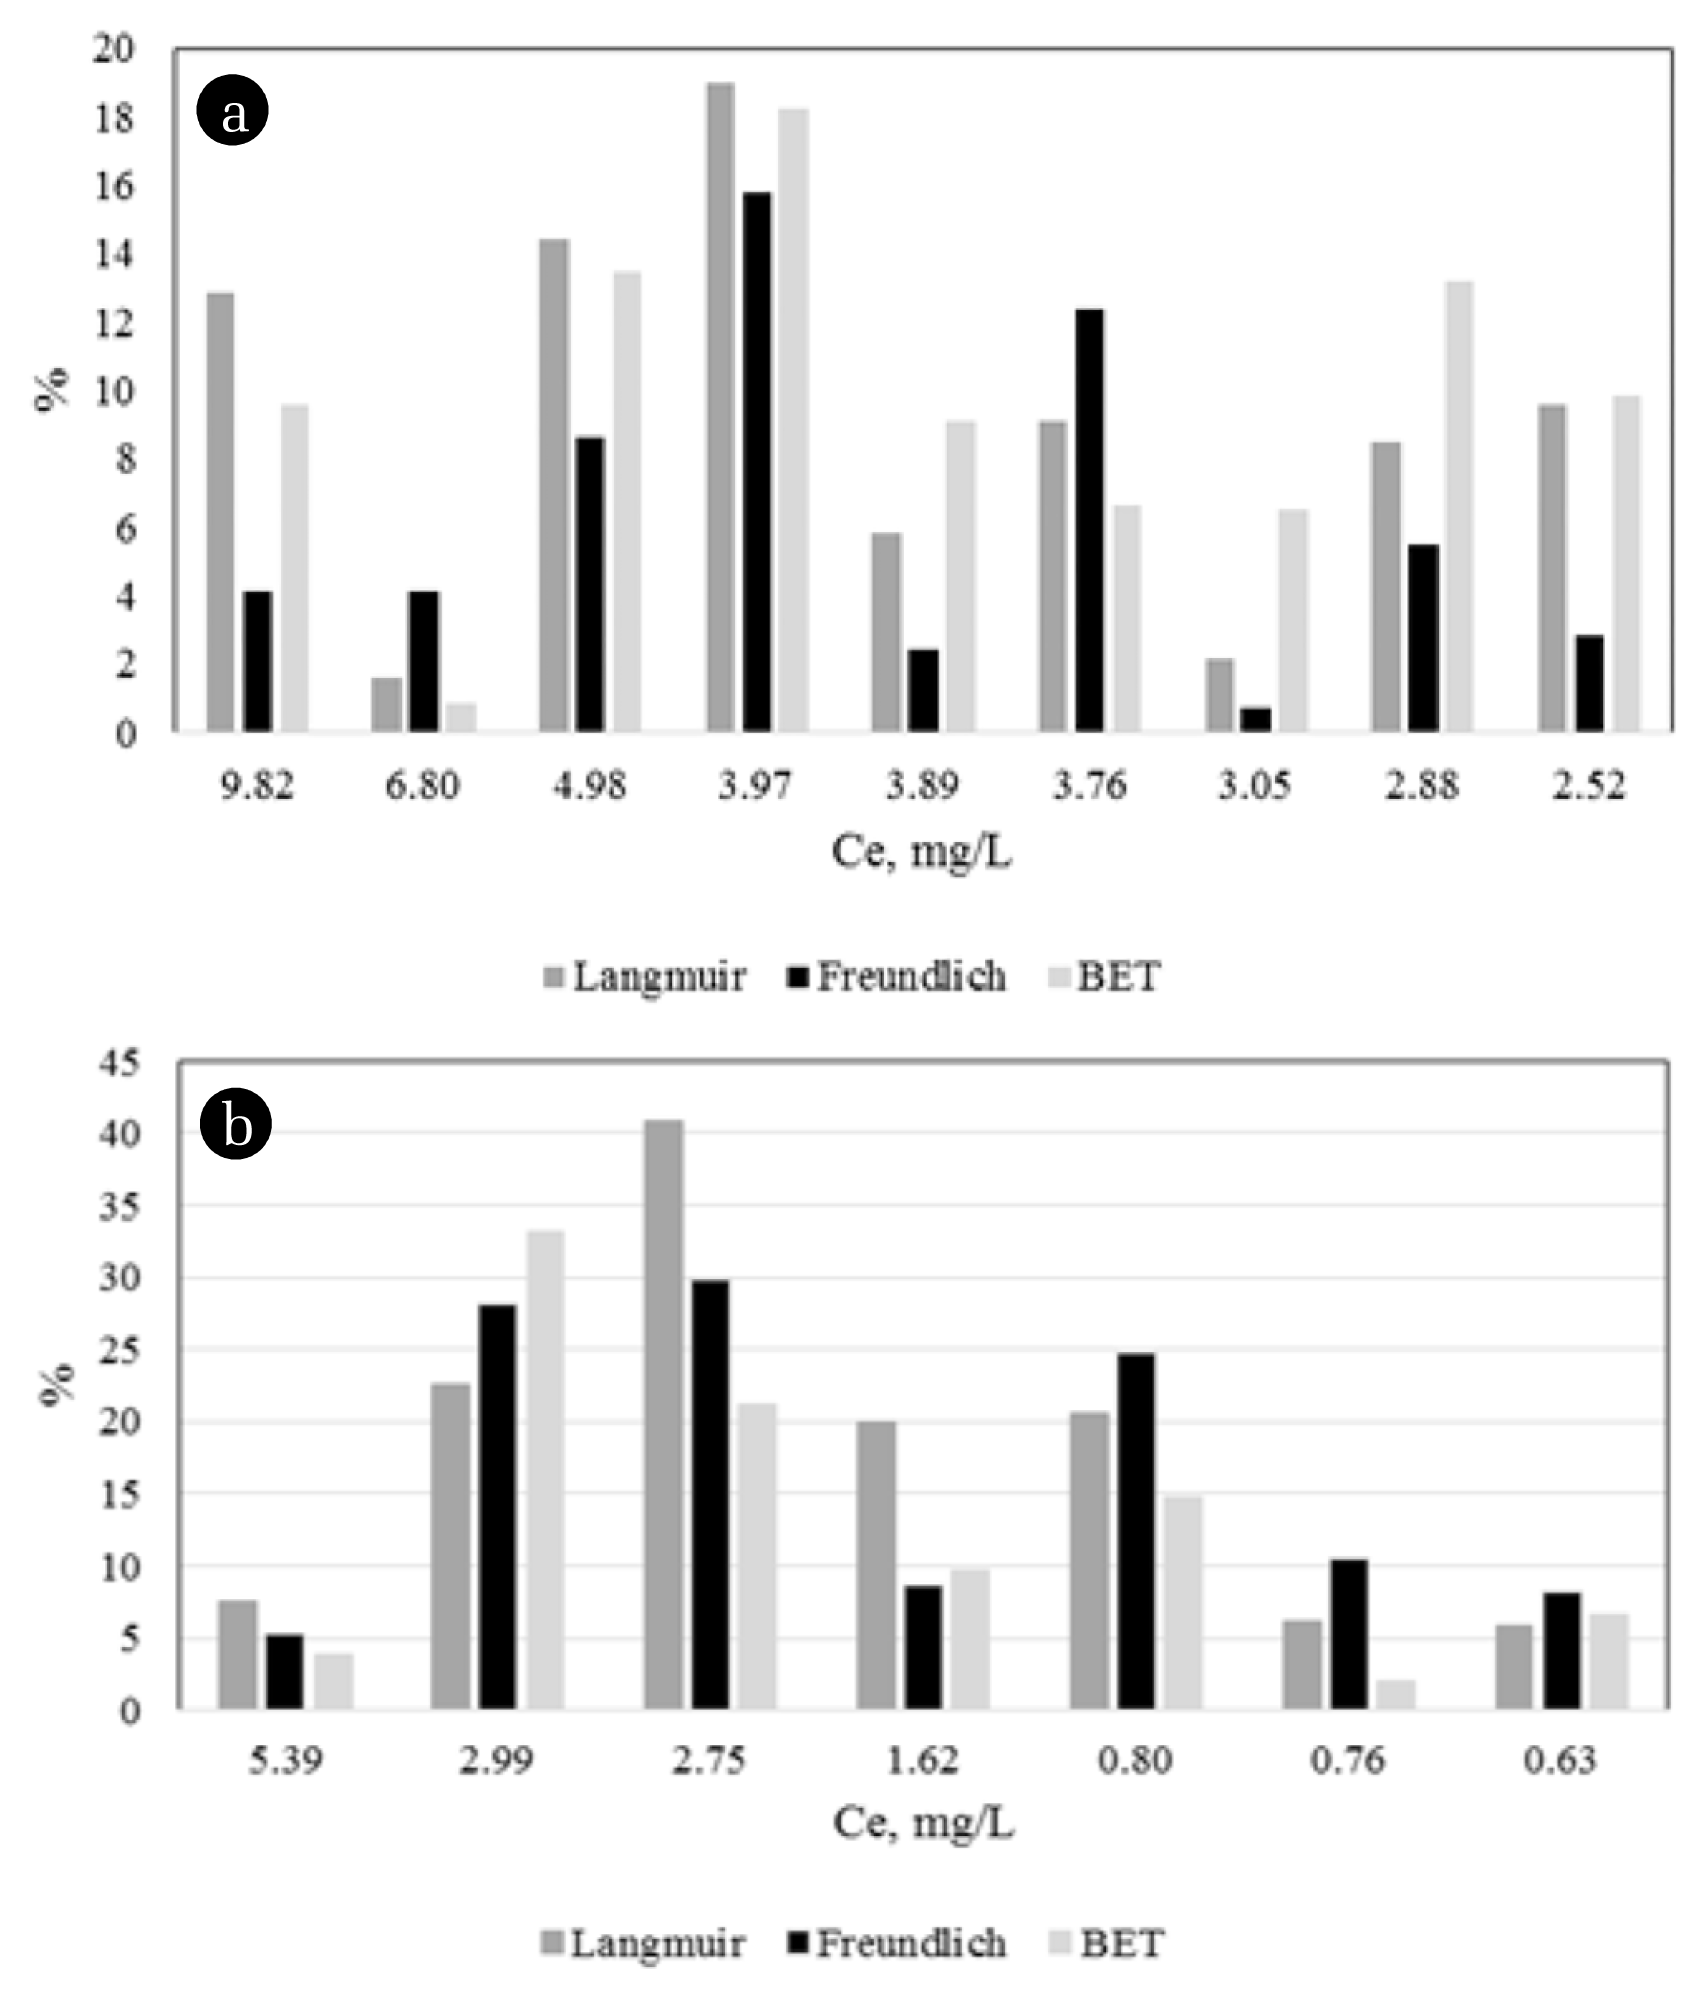
Additionally, the q (mg/g) values were calculated using all three equations and relative errors (%) were determined using the differences between experimental results (Fig. 4). When the graphic is carefully examined, it can be seen that the results obtained from the Freundlich model are generally closest to the real results.
3.3. Kinetic Results
The kinetic model results for OP-C at 25°C are given in Fig. 5. The values of the constants obtained from the linear plots are given in Table 2. According to the correlation coefficients in Table 2, the higher coefficient correlation values confirm that the Au and Ag uptake follows the pseudo-second-order model (R2 > 0.995). It is noteworthy that as the R2 values increase, the RMSE values decrease in parallel. This supports that the most suitable model is the pseudo-second-order model.
3.4. Thermodynamic Results
The thermodynamic parameters are summarized in Table 3. The standard free energies (ΔG0) have negative values. These results indicate that Au and Ag adsorption by OP-C is spontaneous. Ag adsorption is an endothermic process, since the change in the standard enthalpy (ΔH0) has a positive value, while Au adsorption is an exothermic process. The positive value of the standard entropy change suggests that randomness increases at the solid-solution interface during adsorption. It is noteworthy that the randomness in the Au adsorption is higher in these results.
3.5. Adsorption Results of Model Mixed Solutions
According to the analysis results, while 81.01% Au, 77.22% Cu, and 80.63% Pd were totally adsorbed from the Model I solution, 94.06% Ag, 93.41% Cu, and 85.88% Pd adsorption were totally performed from the Model II solution. It was observed that bio-sorbents are not selective for metals, and all metals are partially adsorbed at each stage.
3.6. Adsorption Results from the Solid Product of the PCB Pyrolysis
The yields of pyrolysis products in solid, liquid, and gas forms were 68.4, 19.2, and 12.4%, respectively. The metallic composition of the solid product after the separation of the glass fiber part, which constitutes approximately 57%, is given in Table S1.
According to the adsorption results, in the first step, 64.21% of Au was recovered with OP-C while negligible amounts of Cu, Ag, and Pd were also kept. In the second step, 67.01% of the Cu was recovered, and small amounts of Au, Ag, and Pd were kept. In the third step, 83.37% of Ag as the target metal was recovered, while 56.1% of the remaining Cu was recovered. In the last step, while 75% of the target metal Pd was recovered, 82.24% of the remaining Ag was recovered. At the end of the adsorption process, 85.77% Cu, 67.07% Au, 97.05% Ag, and 75% Pd were adsorbed in total. As a result, the findings of the Au and Ag adsorption from PCB differed from those obtained from the model solutions. This is thought to occur due to multilayer adsorption in the presence of different metals.
4. Conclusions
This study clearly suggests that orange waste can be converted to a valuable adsorbent. It was seen that crosslinking modification increases the Au and Ag adsorption capacity of native OP. In addition, Au and Ag recovery from PCBs was successfully realized. The adsorption equilibrium was analyzed using the Freundlich, Langmuir, and BET isotherms. The adsorption capacities of the adsorbents for Au and Ag recovery were compared using the calculated isotherm constants. The Freundlich isotherms provided the best modeling results for adsorption. Therefore, there may be a possibility of a multilayer, as well as heterogeneous adsorption, for Au recovery in these experimental conditions. The adsorption process of both Au and Ag onto OP-C was spontaneous (−ΔG°). Ag adsorption is an endothermic process, since the change in the standard enthalpy (ΔH0) has a positive value, while Au adsorption is an exothermic process. Moreover, the (+ΔS°) value indicated the increased randomness at the solid-solution interface during the adsorption interaction. The sequential adsorption from pyrolysis solid product leach solution of waste PCBs resulted in a total recovery of 67.07% Au, 85.77% Cu, 97.05% Ag, and 75% Pd. The obtained results show that orange peel and derivatives have a promising potential as an inexpensive bio-sorbent for the adsorption of precious metals from acidic leach solutions of waste PCBs. Taking account of its efficiency and low cost, orange peel could be considered as an alternative adsorbent instead of conventional adsorbents. Furthermore, recovery of the metal ions using this adsorbent could be expected to be easier.