1. Introduction
Pickling wastewater is produced when the steel strips were removed their surface metal-oxides through the pickling line. The pickling line normally consists of pickling tanks filled with the acid solution and washing tanks filled with water [1]. The acid solution used in the pickling tank is usually at an original concentration of 200 g/L. With more steel strips immersed into the pickling tank, the metal oxides are continuously dissolved, the acid concentration is gradually lowered to 30–60 g/L while the concentration of ferrous ions accumulates up to 15 g/L [2]. Such acid solutions are considered to be exhausted due to the loss of solving ability. Those exhausted acid solutions from pickling tank are called pickling waste solution. After taken from pickling tanks, the steel strips were rinsed into washing tank to clean up a small amount of pickling solution left on their surface. The rinsed water discharged from the washing tank is called pickling wastewater. Usually the volume of pickling wastewater is 30–50 times more than that of pickling waste solution because fresh water is constantly supplied to wash tank to ensure the surface quality of the steel product.
The characteristics of the raw wastewater can be found elsewhere [3], the concentration of Ca ions of effluent is high owing to the effects of lime as a neutralizer in pickling wastewater from the steel industry. Conventional treatment for this pickling wastewater has included aeration, neutralization, and sedimentation [4–6]. After aeration ferrous ions were oxidized, a basic solution is used to precipitate ferric ions and other metallic ions in the wastewater. Sedimentation is then used to remove metallic ions to achieve the requirements for wastewater discharge. Although the aeration, neutralization, and sedimentation method can effectively remove metallic ions, it no longer satisfies the increasingly strict discharge requirements for suspended solids indicators in industrial wastewater. In addition, there remain problems in the application of conventional treatment methods; for example, the formation of colloidal ferric hydroxide that cannot settle in the sedimentation tank and instead forms a suspension layer [7]; high water content in sludge and difficulty in sludge dehydration [8]; and poorly controlled sludge pH or slud59ge with long retention times that can cause reverse dissolution of ferric ions, resulting in water COD (chemical oxygen demand) and pollutant concentrations exceeding standards and causing secondary pollution. In order to ensure effectiveness of treatment on effluent, the use of membranes after sedimentation as a safeguard technique has been proposed. However, it was noted that Ca ions would accelerate membrane fouling, as reported in previous studies [9–13]. Moreover, the high concentration of suspended solids and inorganic elements in pickling wastewater, especially mental cations (Ca, Mg and Fe) were found to accumulate in cake sludge and accelerate membrane fouling [14–17]. The above analysis indicated the application and promotion of membranes in treating wastewater from the steel industry has faced limitations and obstacles.
In this study, we proposed a new method for stable treatment of pickling wastewater from the steel industry. We introduced the membranes used in brine refining to pickling wastewater treatment from the steel industry [18–21]. For all membrane processes, fouling is a crucial shortcoming, as it aggravated membrane performance tempestuously. Therefore, while verifying the feasibility of filtration membranes from brine refining in the treatment of pickling wastewater, the effects of membrane fouling and the fouling mechanism on application of membrane were also analyzed to ensure efficiently designed and scaled up.
The objective of this study is to investigate the treatment effect, the properties of membrane fouling in a full scale membrane filter treating pickling wastewater by various analytical methods. The results obtained in this study are expected to provide new insights into membrane fouling control in full-scale membrane applications of pickling wastewater. Samples were analyzed using scanning electron microscopy (SEM), X-ray diffraction (XRD), energy dispersive X-ray spectroscopy (EDS), inductively coupled plasma optical emission spectroscopy (ICP-OES), hydrophilic contact angle analysis, Hg porosimetry, and the zeta potential method [22].
2. Material and Methods
2.1. Membrane Filters and Treatment Process
2.1.1. Membrane filters
Membrane were sourced from Pall Corporation (USA). The main application of these membranes is in brine refining for the chloralkali industry. Membranes comprised expanded polytetrafluoroethylene manufactured using a special expansion technology. These membranes are porous, chemically stable, have a very low coefficient of friction, are temperature resistant, aging resistant, acid and base corrosion resistance, and have high strength. After pickling wastewater had undergone conditioning in a Ca-based alkaline solution, where large amounts of Ca-based salts, ferric hydroxide, and other metal sediments were produced; the membranes were used for solid-liquid separation of sludge replacing sedimentation tanks firstly from the steel acidic wastewater.
2.1.2. Treatment process
The membrane filters were applied for treating pickling wastewater of the steel company of Tianjin, China. The full scale membrane filters were built from 2009 and operated from 2011, and the steel company changed the membranes firstly in 2016. The data below were based on the full scale membrane filter treating pickling wastewater.
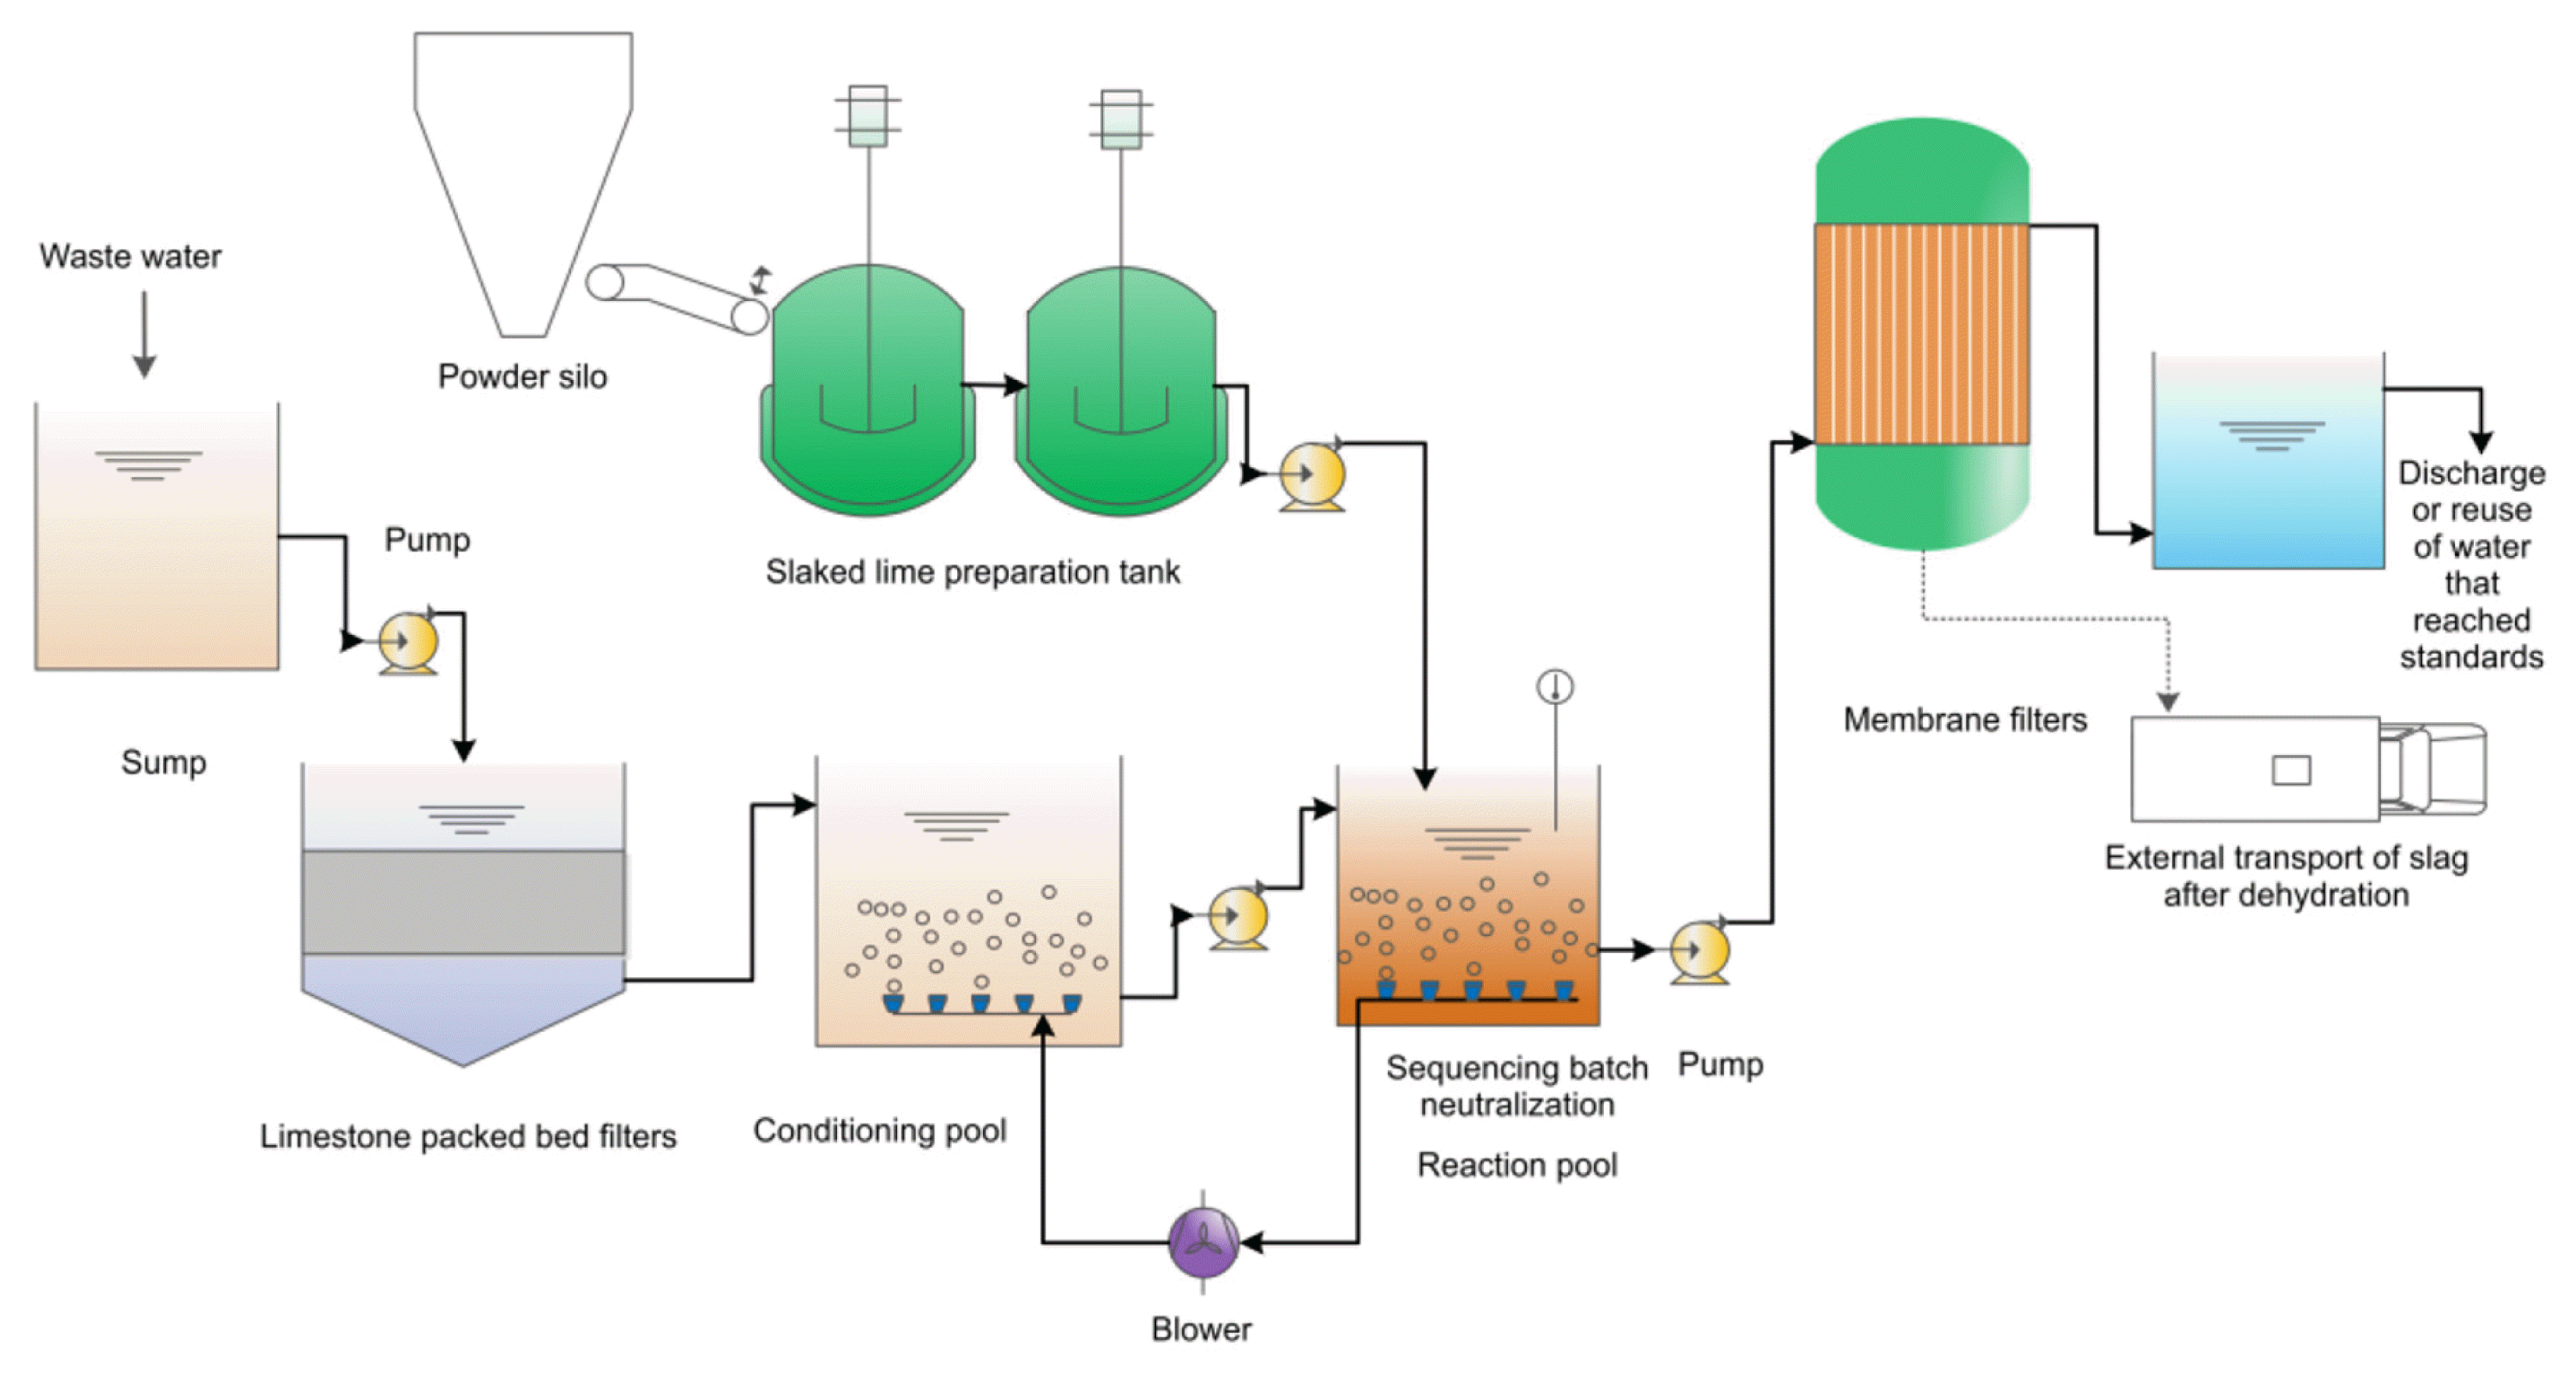
The membrane filters with a treating capability of 7, 200 m3/d. The main treatment process consists of a limestone-packed bed filter, a sequencing batch neutralization reaction, and membrane filtration. The retention time of the limestone-packed bed filters was 0.5 h and the limestone particle size was 5 mm. The pH was adjusted to 4.5, and the height of the filtration and upper buffer layer was 1.5 and 0.5 m, respectively. The 0.5 m over-height and bottom layer was reserved. Limestone was piled in the pool and perforated pipes were installed at the sides of the pool for aeration. The retention time of the neutralization pool was 1.5 h. The pool was divided into three compartments and was aerated to ensure sufficient air to oxidize Fe2+ into Fe3+. The membrane filters was applied to separate the water from a mud-water mixture formed in the sequencing batch neutralization reaction pool. The diameter of the filter was Φ2.5 m, the volume of the membrane filter was 180 m2, the membrane flux was 0.4 m3/m2·h, and the pore size of the membrane was 0.2 μm. Table 1 shows the characteristics of the influent and effluent. Table 2 shows the characteristics of the membrane.
Pickling wastewater flows into a sump and is pumped into the limestone-packed bed filters for initial adjustment of the pH. Then, wastewater flows into the conditioning pool, where water quality is adjusted and water volume, aeration, and agitation are carried out. The pickling wastewater is pumped into the sequencing batch neutralization reaction pool for aeration and oxidization; lime slurry is added to this pool to allow ferric ions in the wastewater to react with the alkaline solution and form ferric hydroxide sediments. The mud-water mixture from the neutralization pool is pumped into the membrane filters to complete solid-liquid separation and enable wastewater to reach the discharge standards before entering into the clear water pool. Some of the water that reaches discharge standard is recycled to the production process, and the rest is discharged. Fig. 1 shows the schematic of steel pickling wastewater treatment technology.
2.2. Analysis Methods
2.2.1. Sample collection and water quality analysis
Effluent samples were collected from the water outlet of the membrane filter. Membrane samples included both fouled and new membranes. Fouled membranes kept operating by the steel company for five years. Of the fouled membranes, both uncleaned and cleaned membranes were analyzed (here after, ‘fouled membrane’ refers to cleaned membranes, unless otherwise specified). The cleaning process was as follows: (1) immersion in clean water for 0.5 h, (2) immersion in 30% hydrochloric acid for 1.5 h, and (3) immersion in clean water for 1 h.Chemical oxygen demand (COD), total phosphorus (TP) and suspended solids (SS), total iron (TFe), total dissolved solids (TDS), chlorideion of the influent and effluent of the pickling wastewater were determined according to Standard Methods for the Examination of Water and Wastewater [23].
2.2.2. X-ray diffraction
The main inorganic crystallity of membrane fouling was analyzed using a Rigaku D/max 2500 V XRD with a scanning range of 0–80 deg.
2.2.3. Scanning electron microscopy
The surface structures of membrane pores were imaged using a cold-field-emission SEM (Hitachi SU3500) [24–28]. Samples were coated by gold, which was applied for 120 s under a vacuum pressure of less than 3 Pa. The sample was imaged using a vacuum of 5×10⁻⁴ Pa. Compositional analysis was performed using EMAX x-act EDS manufactured by Shanghai Polytronics Instruments Co.Ltd.A total of four spots were examined:(1) the surface of uncleaned fouled membranes, (2) surfaces of cleaned fouled membranes, (3) the interiors of pores from cleaned fouled membranes, and (4) fibers from cleaned fouled membranes [29, 30].
2.2.4. Inductively coupled plasma optical emission spectroscopy
An ICP-OES (VISTA-MPX, Varian) was used for further analysis of the components of membrane fouling, particularly heavy metal pollutants. Samples for ICP-OES were collected by scraping the sludge cake layer from fouled membranes onto a plastic sheet. Two samples’ thicknesses scrapped from the sludge cake layer of fouled membrane were 0.2 and 0.5 mm, with samples collected from areas of 20×20 mm. The samples were dried at 105°C for 1 h in a constant temperature oven and then digested to liquid with nitric acid for further analysis.
2.2.5. Zeta potential
Zeta potential was analyzed by A SurPass 3 (AntonPaar GmbH, Austria) for characterize fouling and the characteristics of the membranes. For this analysis, two 10 × 20 mm pieces of cleaned fouled membranes and new membranes were obtained. Rinsing and test pressure were set and the gap height was adjusted to 100 um. At this time, the electrolyte flow velocity was 90 mL/min. The potential of each membrane in a neutral solution was measured. The potentials of the membrane samples were tested at pH 11.0, 10.0 9.0, 8.0, 5.0, 4.0, 3.0, and 2.0, respectively.
2.2.6. Membrane pore property analysis
Total pore volume, pore diameter distribution, porosity, permeability and other pore properties were analyzed using an AutoPore IV 9500 mercury porosimeter from Micromeritics (USA). A precision balance was used to weigh both fouled and new membrane samples. A fixed mass of sample was placed in a 5 cc dilatometer and sealing grease was used to seal the connection between the capillary tube and the dilatometer before reweighing. This sample was then placed in a low-pressure chamber for further analysis at 30 psi. At this point, the dilatometer was reweighed and recorded before being placed into a high-pressure chamber for analysis at 30,000 psi, during which pressure was slowly withdrawn. When the pressure reached standard atmosphere, the analysis was completed.
2.2.7. Hydrophilic contact angle analysis
The hydrophilicity of fouled and new membranes was analyzed using a SL200B standard contact angle goniometer from Kono (USA). An environmental temperature of 23.0ºC ± 2.0ºC and a relative humidity of 50% ± 5% were used. The contact angle was measured when the instrument and the test sample both were at the above temperature and humidity conditions for 10 min. The membrane sample strip was fixed onto the sample stage and the needle was perpendicular to the membrane surface. The light source, sample stage, and camera were adjusted so that the sample image was shown in the middle of the display and the image was clear. The syringe needle released 1 μL-2 μL of deionized water and the sample stage was raised so that the sample surface contacted the liquid droplet hanging from the needle. The sample stage was then lowered so that the droplet was completely transferred onto the sample surface before the timer was started. An image was recorded when the sample surface contacted the droplet for 10 s; at the same time, the right and left contact angle values were measured.
3. Results and Discussion
3.1. Long-Term Operation Performance of the Full-Scale Membrane Filters
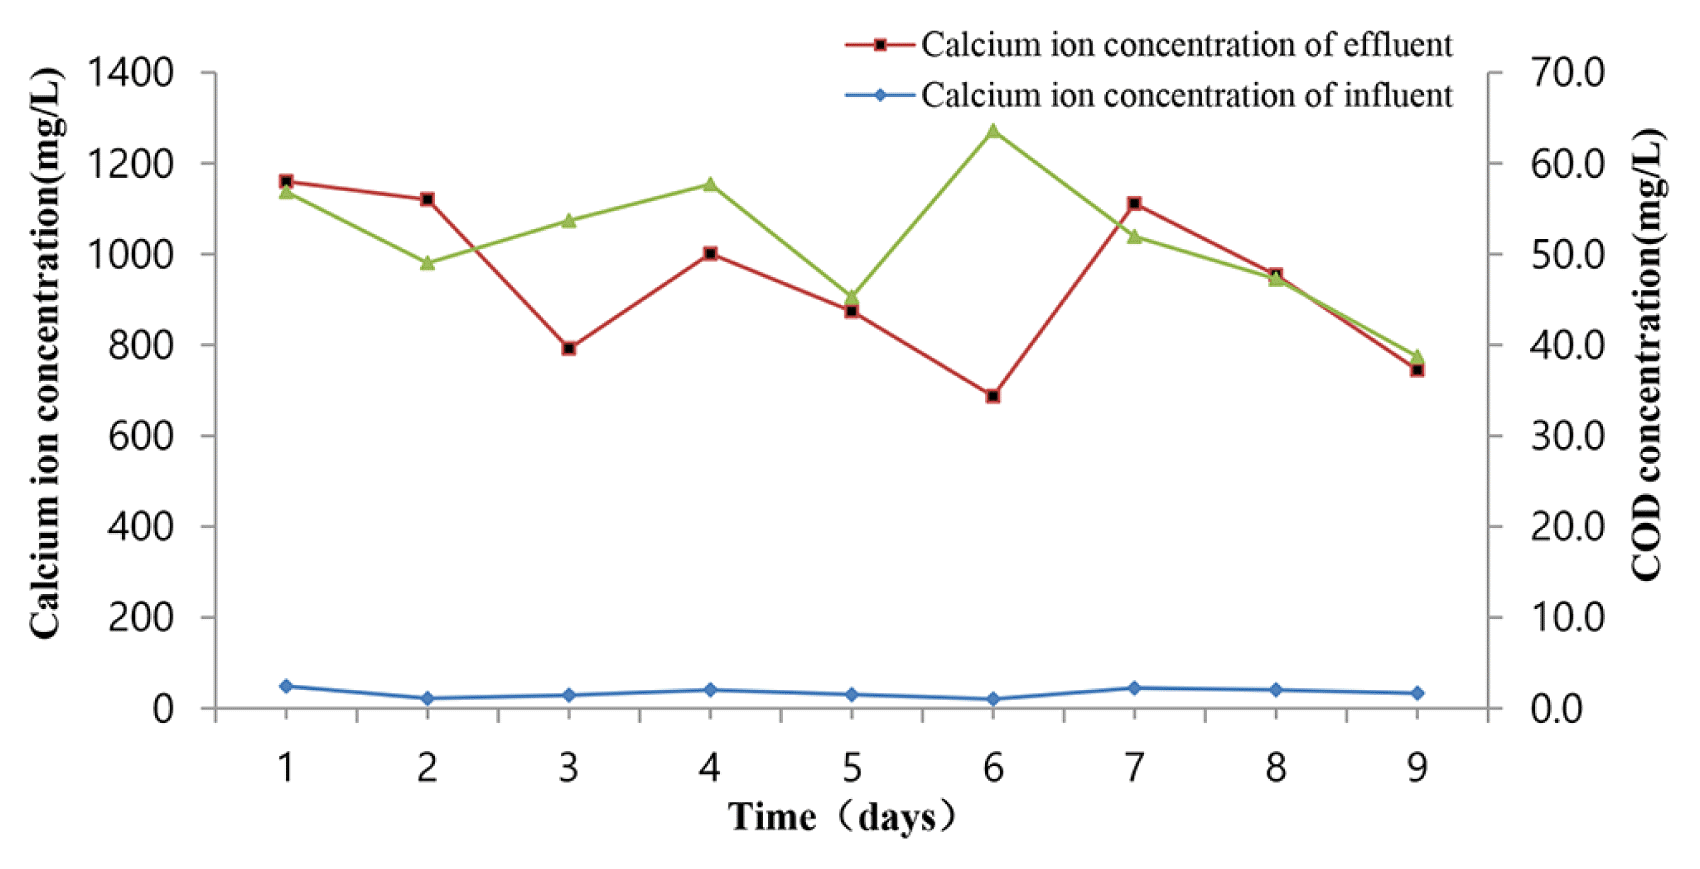
The membrane filters used at the steel factory in Tianjin achieved stable discharge requirements (COD ≤ 70 mg/L; TFe ≤ 1 mg/L; SS ≤ 30 mg/L; TP ≤ 0.5 mg/L; and pH = 6~9, Fig. 3), despite large fluctuations in influent water quality. Fig. 2 shows the operation data of the membrane filter continuously for two years. The average removal efficiency of each pollution indicator used for this process is presented in Table S1 of Supplementary materials. From Fig. 2, we can see that when the influent COD of pickling wastewater was no more than 200 mg/L, the treated effluent could achieve a COD less than 70 mg/L.
As shown in Fig. 3, the full-scale membrane filter system was operated for approximately eight years at the steel company of Tianjin, China, showing excellent performance in terms of pollutant removal and membrane filtration performance. Other detailed information about the treatment performance has been reported previously [31]. The treated effluent is recycled to the production process, and the rest is discharged.
After pickling wastewater were neutralized in a Ca-based alkaline solution pond, where large amounts of Ca-based salts, ferric hydroxide, and other metal sediments were produced; the membranes were used for solid-liquid separation of the neutralized effluent. A phenomenon was detected by other researchers [32–36], who claimed that Ca ions would accelerate the flux of membranes decline and membrane fouling. But the concentration of calcium ion and suspended solids have no adverse effect on the membrane filtration system by five years full-scale operation, and the effluent quality of the membrane system is stable. Membrane filtration performance represented by the evolution of Calcium ion concentration with operational time was recorded, and is presented in Fig. 3. The membranes are used for brine refining which is to remove calcium ion, magnesium ion and sulfate ion from raw brine. The concentration of calcium ion and suspended solids in raw brine before membrane filtration is in the range of 1,000–5,000 mg/L, respectively. Accordingly, the concentration after filtration by refining membrane is less than 3 mg/L and 1 mg/L, respectively [37]. It is noted that the characteristics of the raw brine is similar with the characteristics of pickling wastewater after aeration and neutralization. And according to the strict definition of membrane, the membrane with 0.2μm pore size should be microfiltration, it mainly used for solid-liquid separation in the wastewater, therefore it takes a longer time to reflect the effect of calcium ion and suspended solids concentration on membrane in pickling wastewater. The related experiments are conducted now.
3.2. Fouling Morphology and Behavior
3.2.1. Fouling morphology
The morphology of fouled membranes was analyzed by means of microscopic observation. SEM images showed that pores in new membranes (Fig. 4(a) and (b)) are even and the spaces between membrane pores are larger than those of fouled membranes (Fig. 4(c) and (d)). From Fig. 4, we can see that membrane fouling caused both external and internal blockage. Pores on the surface of fouled membranes were significantly smaller, and patch-like foulants had adhered to the surface. No biological communities were found on the fouled membranes (Fig. 4(c)); however, spherical inorganic crystalline particles were abundant and uniformly distributed (Fig. 4(d)). The surfaces of fouled membranes and the interiors of the membrane pores were all adsorbed with significant fouling layers, which decreased the area of the membrane pores. It is noted that inorganic ions from wastewater are continuously accumulated. When the concentrations of these ions exceed the solubility product, some inorganic substances would adsorb and precipitate on the membrane surfaces and inside the membrane pores, eventually forming fouling consisting mainly of inorganic substances, which was consistent with the theory of crystallization of Okazaki and Kimura [38]
3.2.2. Fouling characteristics
Hydrophilicity is an essential characteristic of membranes and can affect membrane flux and anti-fouling ability [39]; Contact angle is often used to represent a membrane’s hydrophilicity. Before use, the modified Teflon membrane was hydrophilic with a contact angle of 10.163º (super-hydrophilic membrane with a contact angle of less than 40°). After being used for an extent period, the contact angle increased to 79.76°, which illustrates a decrease of hydrophilicity of the membrane surface caused by the membrane surface and pore structures change. Teflon membranes are modified by membrane surface before applying into wastewater treatment to increase hydrophilicity and anti-fouling ability [40, 41]. The hydrophilicity of the membrane mainly comes from the hydrophilic group of the modified membrane surface. The frequent chemical cleaning makes the hydrophilic group disappear resulting in a decrease in membrane hydrophilicity.
The impact of pore sizes at the micrometer level and the effects of membrane surface characteristics (e.g., roughness, porosity, pore size, distribution) on hydrophilic contact angle measurements cannot be overlooked [42–44]. We used Hg porosimetry to test the stable properties of the membrane, as this approach avoids problems associated with the mean radius of irregular pores in the cross-section and contact angle [45]. The larger the contact angle, the higher the hydrophobicity and the weaker the permeability of the membrane; conversely, the smaller the contact angle, the better the hydrophilicity of the membrane and the higher the permeability [46].
The porosity and permeability of fouled membranes were all lower than those of new membranes, which is consistent with the measured hydrophilic contact angle data, and is presented in Table S2 of Supplementary materials. The median pore diameter of new membranes was 1,009.3 nm, while that of fouled membranes was 4804 nm. The pore size of the reticular interlaced membrane became larger, the pore size changes, and the porosity and permeability of the membrane decrease obviously. Based on these dimensions, new membranes can intercept macromolecules while fouled membranes can only intercept large particles. Zeng KL et al. [47] pointed out that the smaller the pore size distribution, the stronger the membrane anti-pollution ability [48]. As the membrane pore size decreased, the critical flux increased from 34–43 L/m2h to 105–114 L/m2h. Kim and Baudot et al. believed that the mass transfer interface area should be the microporous part of the membrane, that is, the membrane porosity has a direct effect on the mass transfer effect. However, the effect of membrane pore distribution and porosity on membrane mass transfer and membrane fouling needs further study.
3.2.3. Fouling types
Stoller believed that the particulate pollution with the ratio of particle size to membrane pore size between 0.1 and 10 was caused by blocking the membrane pore. Particles with the diameter 10 times greater than that of membrane pore usually formed cake layer pollution on the surface of the membrane, membrane pore pollution is more severe than cake layer pollution [49]. Table S3 indicates that the ratio of particle size (calculated according to X90) to membrane pore size was 1.09 before membrane filtration. In fact, serious membrane pore blockage and fouling occurred in the measured membrane filter. During the operation of the membrane filter, the membrane pressure and backwashing frequency increased, the membrane flux recovered poorly after cleaning, and the effluent quality of the membrane filter was unstable.
After neutralization and aeration, wastewater enters the membrane filter. The intense turbulent state formed by aeration destroys the growth of small flocs, makes the average particle size of sludge particles smaller and the particle size distribution uniform entering the membrane filter, and increases the probability of membrane pore blockage. The small suspended sludge solids attach preferentially to the membrane surface and pore, leading to the densification of the cake layer, then the flux of membrane decreases, membrane fouling occurs gradually. The concentration of iron ions is high, which also contributes to membrane fouling. Studies have shown that excessive iron salts also aggravate the irreversible fouling of membranes, which is not eliminated by conventional chemical cleaning, and fouling due to excess iron can only be removed by heating the cleaning solution [50].
3.3. Accumulation and Interaction Properties of Fouled Membrane
3.3.1. Organic and inorganic component analysis
Table S4 shows the phase changes of fouled and unfouled membranes. The main components of new membranes were ultradispersive Teflon and hexamethylenetetramine, while the main component of the fouled membranes was ultradispersive Teflon. Hexamethylenetetramine is an additive used during the membrane molding process; it is extremely soluble in water. After a period of usage, hexamethylenetetramine from membranes is discharged into wastewater. Although the scanning time is adequately prolonged, even with lower scanning speed and stepwise scanning, no phase of foulants less than 1% was measured. The major component elements of fouled membranes were C and F, which was used as the background for the subsequent analysis of the fouled membrane.
EDS analysis was further performed for both the fouled membranes and uncleaned fouled membrane to identify the inorganic content in Fig. 5. SEM images distinctly confirmed that foulants covered surface of the membrane after the long-term operation.SEM images showed that only small amounts of foulants were remained on the fouled membrane surface after washing; however, a significant fouling layer still adheres to the interior of membrane pores. As Fig. 5(a)–(b) illustrate, Au, Ca, Cr, Fe, F, Cl, O, S, Si, P, K, Pb, Zn and Al appeared on the surface of an uncleaned fouled membrane. Fig. 5(c)–(d) shows that the significant fouling elements in the membrane fibers of back-washed fouled membranes were Cl, Ca, Mn, Cr, Fe, P, S, C, O, F, Zn, Cu, Si. Among the identified elements, C and F were the major components of the membrane material. The detection of Au relates to the use of gold-coating during sample preparation for SEM analysis. Accumulation of metallic ions such as Mn, Cr, Cu, Zn, Pb and Si formed after a long period of operation, and eventually the matrix of metal salts formed on the membrane surface and into the membrane pore.
In this work, the results emphasized the accumulation phenomenon of inorganic ions and their important effects on the formation of fouling layers. The surfaces of fouled membranes and the interiors of the membrane pores were all covered by a significant fouling layer, which decreased the area of the membrane pores (Fig. 2). As Fig. 5 shown, the differences in the types of precipitated foulants on different regions of the membrane were observed, but no significant deviations in the main active components. After excluding the effects of C and F(i.e., elements that make up the membrane material), it was determined that the main elements causing membrane fouling are Cl, Ca, O, Mn, Cr, Si, Fe, P, S, Zn, Pb. Moreover, it was reported that inorganic elements played an important role in fouling layer formation and high fouling layer resistance [51, 52]
The process of membrane filtration treatment is mainly inorganic chemical reaction. After a long period of operation, inorganic pollutants accumulate continuously. When the total dissolved solids concentration in wastewater exceeds its solubility, precipitation, inorganic scale or crystallization will take place on the membrane surface or inside the membrane pore, Such as sulfate, chloride, and phosphate salts of metallic ions, along with some soluble salts such as chlorides, resulting in inorganic pollution of membrane filter. However, fouled membrane by chemical cleaning just only changed the surface properties of the membrane(i.e., porosity, permeability, pore diameter, etc.). From the point of practical application, hydrophilicity of fouled membrane is not completely recovered, the flux of membrane is not stabilized and decreased rapidly. Based on the above fouling characteristics of membrane, effective chemicals were chosen to hinder and control membrane fouling.
3.3.2. Zeta potential
The magnitude of zeta potential is related to the nature and quantity of ions adsorbed onto the membrane surface and can quantitatively reflect the charge in performance, the degree of membrane fouling, membrane aging, and the membrane cleaning status. Changes in the zeta potentials of membrane surfaces before and after use can be used to quantify the membrane fouling status and cleaning effects [53–56].
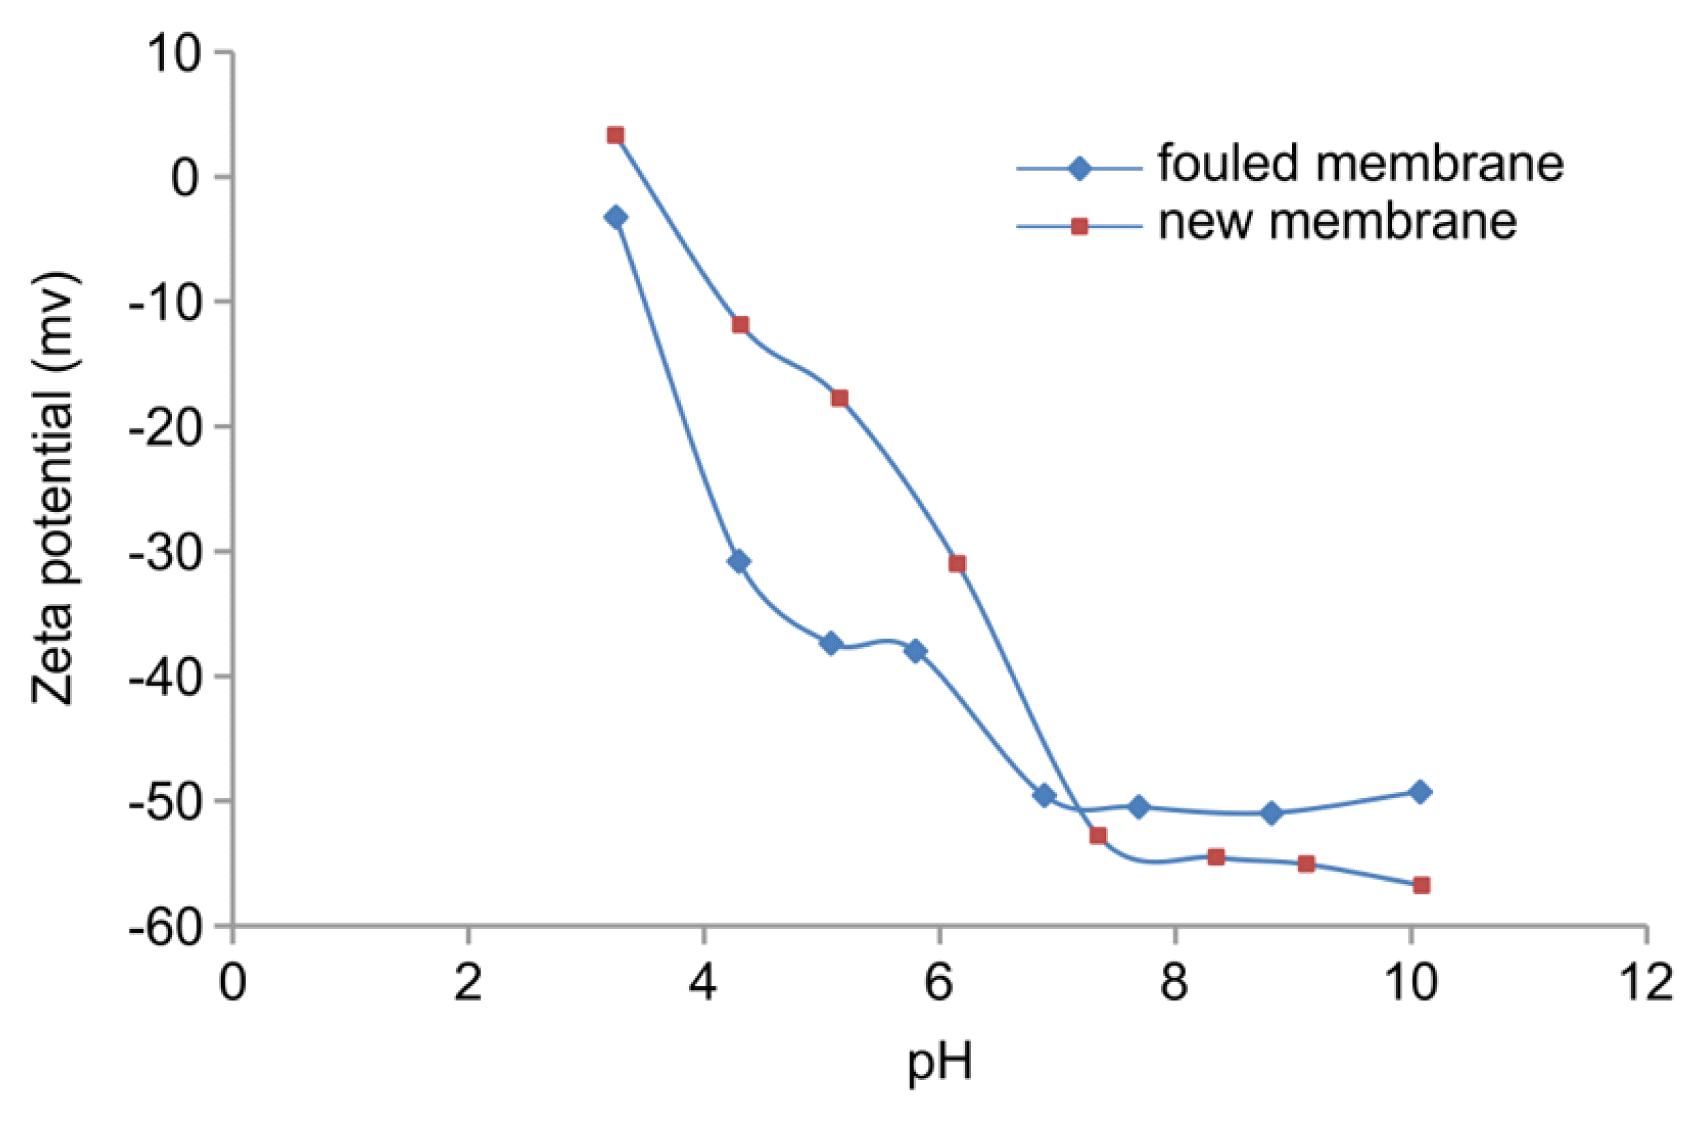
Fig. 6 shows the zeta potentials for membrane surfaces before and after fouling. Results showed that the isoelectric point of new membranes was at pH 3.48 and the zeta potential tended to be unstable at pH greater than 7.35. At pH 10.09, the absolute value of the zeta potential was greatest. In the fouled membranes, the zeta potential tended to be higher for pH of more than 7.69, with the most exceptional value at pH 8.81; however, at pH 10.0, the absolute value of the zeta potential started to decrease. When the absolute value of the zeta potential is at its highest, the membrane surface charge is greatest and hydrophilicity is strongest.
Moreover, further observation of zeta potentials of membrane was conducted. Owing to fouling, the surface charge on the membrane decreases along with hydrophilicity. This result (Fig. 4) is consistent with previous hydrophilic contact angle data. When the pH value of a new membrane is lower than 7.34, and when the pH of the fouled membrane is lower than 7.69 or greater than 10.09, the zeta potential on the membrane surface shows an increasing trend, with a decrease of the membrane surface charge and hydrophilicity. From this, the optimal pH range of new membranes for wastewater treatment is above 7.34 that of fouled membranes lies between 7.69 and 10.09.
The small change of pH would cause the large fluctuation of Zeta potential. The adsorption or desorption of H+ or OH− on the membrane in the electrolyte solution change the surface charge of the membrane, resulting in the different Zeta potential. The size of the Zeta, the positive and negative Zeta potential could be changed by pH. When the solution is acidic, Zeta potential tends to be positive. As the pH increases, Zeta potential gradually decreases. As far as the pH deviates from the isoelectric point, the Zeta potential is farther away from the origin. And when membrane surface Zeta potential absolute value is the largest, it indicates that negative charge on the membrane surface is the most, and the hydrophilicity is the strongest at the pH. Therefore, the pH of the treatment system can be selected according to the phenomenon. The highest membrane flux can be obtained under the same operating conditions, which can effectively prevent most colloidal substances from membrane fouling, and prolong the service life of the membrane.
As other studies demonstrated when the charge on the membrane surface increased; this can effectively prevent membrane fouling and prolong the life span of the membrane [57]. Optimal pH values for fouled membranes are relatively higher because the charge on the surface is already lower than that of new membranes. At the same time, when permeability and hydrophilic contact angle data are combined, it could be observed that after acid washing, the hydrophilicity of fouled membranes substantially decreased, membrane pores were internally blocked, and flux decreased. This fouling is irreversible. The membrane can still be used in its fouled state, but the optimal pH range for wastewater treatment will have been shifted, making it extremely easy to form sludge cake layers on the membrane surface. Pickling wastewater contains high levels of inorganic salts and is a type of electrolyte solution. The membrane surface is negatively charged while levels of Ca and ferric ions are very high. As opposites attract, this decreases the amount of charge on the surface of new membranes. Previous studies have shown that when the membrane filtration time extended, both zeta potential and flux decrease [58, 59], this is consistent with the results of this study.
As the decrease of the Zeta potential of the membrane, the interaction between the contaminated particles and the membrane can gradually transfer from the mutual repulsion force to the mutual attraction. The flocculants of the aerated tank effluent can easily adhere to the surface of the membrane due to the positive charge, and produce the sludge cake layer to cause the membrane fouling. When the Zeta potential of the pickling wastewater increased, the repulsion force between the contaminated particles and the fouled membrane enhanced. The flocculants of the aerated tank effluent are challenging to adhere to the surface of fouled membrane.
Besides, the membrane carries the negative charge, the separation mechanism of the charged membrane is mainly pore sieving and electrostatic interaction. For colloid and molecules without charge, pore size screening is the primary separation principle, whereas electrostatic interaction is the main reason. Pickling wastewater is an electrolyte solution, which contains a lot of calcium ions and ferric ions. The charges attract leads to charge neutralization, which forms inorganic salts of calcium or iron on the membrane surface or in the membrane pore after a long period of accumulation. Therefore charge neutralization is also a pivotal factor to membrane fouling, which might also contribute to the heterogeneous structure of fouling layer during long-term operation. However, membrane fouling is a dynamic process, more research is needed to clarify the underlying mechanism.
4. Conclusions
This study tested a new technique for treating pickling wastewater from the steel industry. The performance was investigated in a full-scale membrane filter during long-term operation. It was confirmed that application of filtration membranes from brine refining in the treatment of pickling wastewater were feasible. Membrane fouling during pickling wastewater treatment is inorganic and mainly consists of sulfate, chloride, and phosphate salts of metallic ions through SEM imagery, SEM/EDS, and ICP-OES. The zeta potential, porosity, and hydrophilic contact angle of membrane surfaces before and after fouling qualitatively characterized the degree of membrane fouling during pickling wastewater treatment and verified optimal reaction pH for fouled membranes. The Zeta potential of the pickling wastewater can be increased artificially by adjusting influent factors such as pH of reaction to control the membrane fouled. Membrane fouling occurs over the five years operation of the membrane system. Charge neutralization accelerates the accumulation rate of inorganic pollutants, and cumulative concentrations of inorganic pollutants exceed the solubility and precipitate on membrane surfaces and inside membrane pores, which is a reason to membrane fouling.