1. Introduction
Antibiotic drugs have been widely used to treat human and veterinary diseases of bacterial infections since their development for performing a biological effect. However, they have been frequently detected in water environment due to inappropriate use in recent decades [1–5]. Recently, Feng and co-authors have pointed out that many antibiotics are pseudo-persistent pollutants of emerging concern owing to its potential toxicity to non-target species, the development of antibiotic-resistant bacteria and chronic inhibitory effects on growth [6]. Fluoroquinolones (FQs) is one of the most widely employed class of antibiotics with bactericidal action. Particularly, flumequine (FLU) is one of the most used FQs in intensive aquaculture. Since FLU is difficult to be biodegradable naturally [7, 8], it remains active in sediments for extended time periods, producing negative environmental impacts. FLU has been extensively found in surface water and municipal wastewater (2.5–50 ng L−1) and in soil (6.9 mg g−1) [9–13]. Antibiotics such as FLU cannot be often eliminated completely by conventional wastewater treatment systems due to low degradation efficiency [14]. Therefore, it is extremely pressing to develop effective methods to remove FLU from aqueous environment.
Advanced oxidation processes (AOPs) have been successfully applied to remove residual antibiotics in water environment due to their high ability to oxidize pollutants with different structures [1, 3, 15–20]. AOPs mainly include photocatalytic, chemical and electro-chemical methods and combined chemical and biological technology, which can generate a variety of active oxygen species such as hydroxyl radicals (•OH), sulfate radicals (SO4•−) and superoxide radicals (O2•−) [21]. Among various AOPs, the photocatalytic method has become an emerging and promising method for the removal of antibiotics in aqueous environment. Titanium dioxide (TiO2) is one of the most common used photocatalysts owing to its low cost, non-toxicity, mechanical robustness, and environmental friendliness [22, 23]. However, the wide band gap (Eg = 3.2 eV for anatase) and the high recombination rate of photogenerated electron-hole pairs (e−/h+) became its two hindrances to high photocatalytic performance [24, 25]. Thus, the structural modification or doping of TiO2 was considered as a good method to improve its response to the sun light and hence the photocatalytic activity.
Various TiO2-based photocatalysts by metallic or/and non-metallic ions doping and codoping have been successfully used for the degradation of organic pollutants [26–30]. Among various doping methods, nitrogen doping has been considered as one of the most encouraging due to comparable atomic size to oxygen and small ionization energy of nitrogen atom [31]. Some studies confirmed that nitrogen doping can enhance the visible light absorption of TiO2 or/and suppresses the recombination rate of e−/h+, resulting in an enhancement of photocatalytic performance compared to pure TiO2 [32–34]. Nieto et al. [35] synthesized N-doped TiO2 in the presence of urea (U-TiO2) by using sol-gel technique and they found that the significant effect of U-TiO2 in the removal of FLU in water system is mainly its adsorption phenomena. Asahi et al. [32] reported that N doping of TiO2 by annealing the TiO2 powders in a NH3/Ar gas mixture leads to an increase of photocatalytic activity of TiO2 under visible light. Thus, N-doped TiO2 can be seen as a promising photocatalyst for environmental re-mediation and other applications. However, there are very few studies on the use of N-doped TiO2 catalysts for photocatalytic degradation of FLU. On the other hand, the preparation methods of N-doped TiO2 catalysts and the selection of N sources need to be further expanded. Therefore, it is necessary to develop facile techniques for synthesizing N-doped TiO2 with different N sources and excellent activity on photocatalytic degradation of FLU.
In the present work, we conducted a comprehensive exploration on the preparation of N-doped TiO2 catalysts with different N sources using a simple method and their application for the photocatalytic degradation of FLU. The main objectives of this study are as follows: (1) to synthesize a new N-doped TiO2 catalyst with excellent photocatalytic activity on degradation of FLU and high stability, (2) to investigate the degradation kinetics and the main reactive species in the photodegradation process of FLU involving N-doped TiO2 catalysts, and (3) to determine the plausible intermediates and degradation pathways in the photodegradation of FLU and predict the toxicities of FLU and these intermediates to some aquatic organisms.
2. Material and Methods
2.1. Materials
FLU (purity > 98%) was provided by J&K Chemical Ltd. Methanol and formic acid (FA) were purchased from Merck (Darmstadt, Germany) and were of HPLC grade. Other chemicals used in this study such as Ti(SO4)2, HCl, NaOH, p-benzoquinone (p-BQ), urea (CO(NH2)2, U), ammonium nitrate (NH4NO3, AN), ammonium chloride (NH4Cl, AC), AgNO3 and tert-butyl alcohol (TBA) were analytical reagent grade and used without further purification. A Milli-Q Plus system (Millipore, Bedford USA) was employed to prepare ultrapure water (> 18.2 MΩ cm), which was used throughout all experiments.
2.2. Preparation of Photocatalysts
N-doped TiO2 catalysts were synthesized by using precipitation combined with thermal decomposition method. The specific steps are as follows: First, using Ti(SO4)2 (purity ≥ 96%) as a Ti precursor and NaOH (2 M) as precipitator, after the pH of the mixed solution rose to 10 in the precipitation process, then the precipitation cakes were filtrated at vacuum condition, washed using ultrapure water four times and dried at 80°C overnight. The resultant sample was crushed to obtain fine powder. Second, 1.0 g of the sample powder obtained above and 1.0 g of nitrogenous compounds including CO(NH2)2, NH4Cl or NH4NO3 were mixed uniformly and then milled thoroughly in an agate mortar, respectively. The resultant mixture was transferred into porcelain crucible for calcination at 450°C for 2 h at a heating rate of 4 °C/min in a muffle furnace, and then cooled down to room temperature. The formed product was further crushed. Thus, N-doped TiO2 catalysts were obtained and signified as TiO2/U, TiO2/AC, or TiO2/AN, respectively. For comparison, the undoped TiO2 was also synthesized using the same method in the absence of dopants.
2.3. Characterization Methods
Scanning electron microscopic (SEM) instrument (FEI, Netherlands) was used to observe the morphology of the prepared samples. The powder crystalline structures of the samples were obtained using Smart lab 9 X-ray diffractometer (Rigaku, Japan) with Cu Ka (0.15406 nm) X-ray source. Raman spectra of these samples were collected using HORIBA HR800 Raman spectrometer and the intensity data were collected from 100 to 800 cm−1. The chemical states of the samples were investigated by carrying out X-ray photoelectron spectroscopy (XPS) determination employing a PHI 5000 Versa Probe system (ULVAC-PHI, Japan) with Al Kα radiation source. The C 1s level at 284.6 eV was used as an internal standard to correct the shift of binding energy due to relative surface charging. The UV–Vis diffuse reflectance spectra (UV-Vis-DRS) of the samples were obtained via UV-visible spectrophotometer (PerkinElmer, Lambda-950) employing BaSO4 as a reference material.
2.4. Photocatalytic Activity Measurements
All experiments were carried out in a XPA-7 multi-tube agitated photochemical reactor (Xujiang Technology Co., Ltd. Nanjing, China). The photocatalytic activity of the samples was assessed by degrading FLU in aqueous solution under 500 W xenon light irradiation, and its light intensity at the sample position was about 48.0 mW cm−2. The photochemical reactor is equipped with water circulation cooling device to control the reaction temperature at 25 ± 1°C and further details of XPA-7 can be found in our previous work [36]. In a typical experiment, a 10 mg of sample was added into a quartz photo-reactor containing 50 mL FLU solution (10 mg L−1). Prior to irradiation, the obtained suspension was stirred magnetically for 30 min in the dark to ensure the establishment of adsorption/desorption equilibrium. At prescribed time intervals, 1 mL sample solution was extracted and immediately filtered through a 0.22 μm filter into a brown HPLC vial for further analysis. In the experiment, the initial pH value of the reaction solution was adjusted to pH = 7 ± 0.2 using HCl and NaOH. All experiments were performed in triplicate. To estimate the catalytic stability and reusability of the prepared N-doped TiO2 catalysts, the recycling experiments for photocatalytic activity measurements of the catalyst with the highest catalytic performance were conducted. The catalyst was collected by centrifugation after each run and then washed with ultrapure water three times. The catalyst solids were left and the fresh FLU reaction solution was added to the reaction tube, followed by the next run.
2.5. Analytical Methods
An HPLC UV (Agilent Technologies, Series 1200) system equipped with an Agilent ZORBAX SB-C18 column (5 μm, 4.6×150 mm) was used for monitoring FLU concentration. The maximum absorbance wavelength for FLU was 238 nm. The isocratic elution was methanol and 0.3% formic acid in water (v/v = 70:30) at a flow rate of 1 mL min−1. Total organic carbon (TOC) determinations were carried out in a Shimadzu 5000A TOC analyzer.
The degradation products of FLU were analyzed by high resolution liquid chromatography time of flight mass spectrometry (LC-QTOF-MS) using ultra performance liquid chromatography tandem-mass spectrometry (UPLC-MS/MS, Waters Corp., USA). A BEH C18 column (2.1×50 mm, 1.7 μm) was used for chromatographic separation. The mobile phase consisting of 0.1% formic acid in water (A) and acetonitrile (B) was eluted at 0.3 mL min−1. Mass spectrometric analysis was carried out with a G2-XS-QTOF MS operating in a positive ion mode by an electrospray ion source. Mass range of TOF MS was set at m/z from 100 to 600. The other mass parameters were set as follows: Capillary voltage: 3.0 kV, source temperature: 100°C, desolvation gas flow rate: 800 L h−1 and desolvation temperature: 350°C.
2.6. Determination of Active Components (•OH, O2•−, e− and h+)
In order to evaluate the role of the main reactive species including hydroxyl radical (•OH), superoxide radical (O2•−), photogenerated electrons (e−) and positive hole (h+) during the photocatalytic reactions, four scavengers including TBA, p-BQ, AgNO3 and FA were added to the FLU solutions containing catalyst to capture •OH, O2•−, e−, and h+, respectively [37–39]. The detailed step was as follows: 10 mg of as-prepared catalyst sample was dispersed in the 50 mL of FLU aqueous solution (10 mg L−1), and then 38.3 mM TBA, 0.38 mM p-BQ, 4.0 mM AgNO3 or 1.0 g L−1 FA was added into reaction system, respectively. The choice of the concentrations of TBA, p-BQ, AgNO3 and FA was referred to a previous report [36]. The analytical method was the same as that used in the evaluation of photocatalyst activity mentioned above.
3. Results and Discussion
3.1. Catalysts Characterization
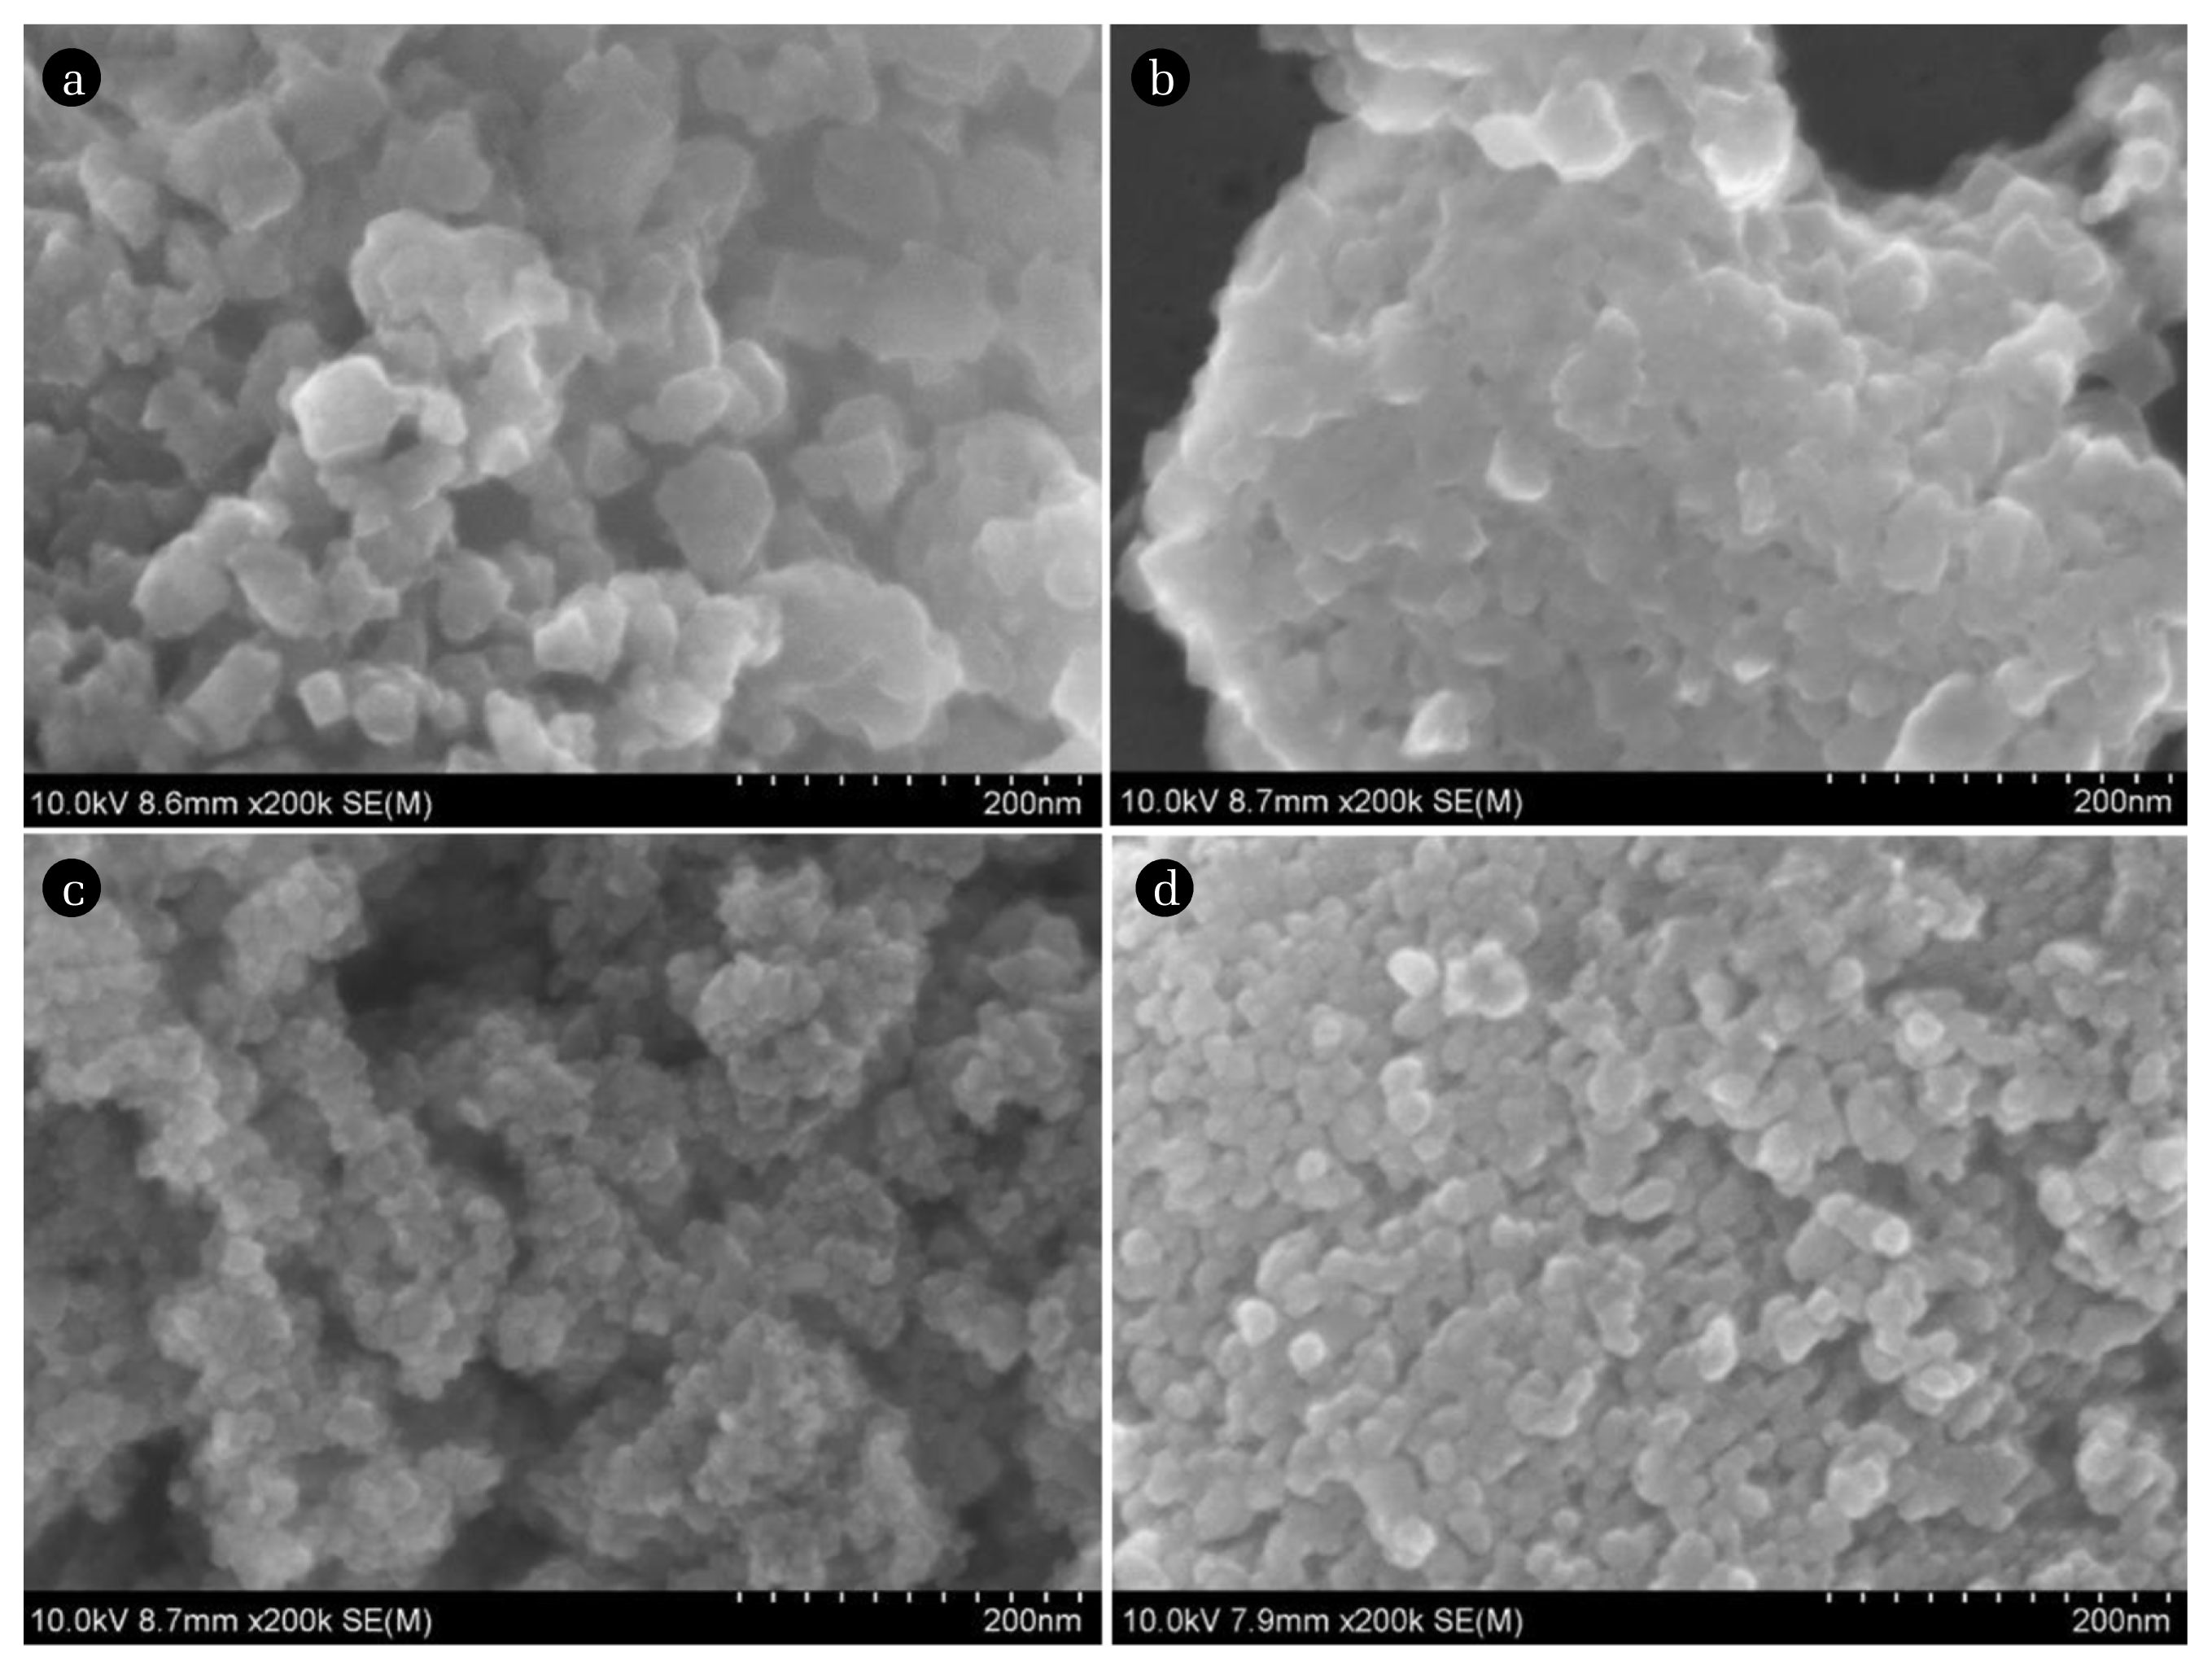
The surface morphologies of the four as-synthesized samples were examined using SEM technique and the results are shown in Fig. 1. The surface topography of these samples varied widely. The surface of pure TiO2 particles appeared rough and not uniform (Fig. 1(a)). Compared to pure TiO2, the TiO2/U sample particles were tightly packed and layered, resulting in bad adsorption capacity (Fig. 1(b)). For TiO2/AC sample, although its particle size was obviously smaller than those of pure TiO2 and TiO2/U, there was agglomeration in it (Fig. 1(c)). Compared to the three samples mentioned above, the particles of TiO2/AN sample (Fig. 1(d)) exhibited spherical, highly dispersed and evener particle size distribution in the range of 9–13 nm. Thus, it was expected to have high photocatalytic activity.
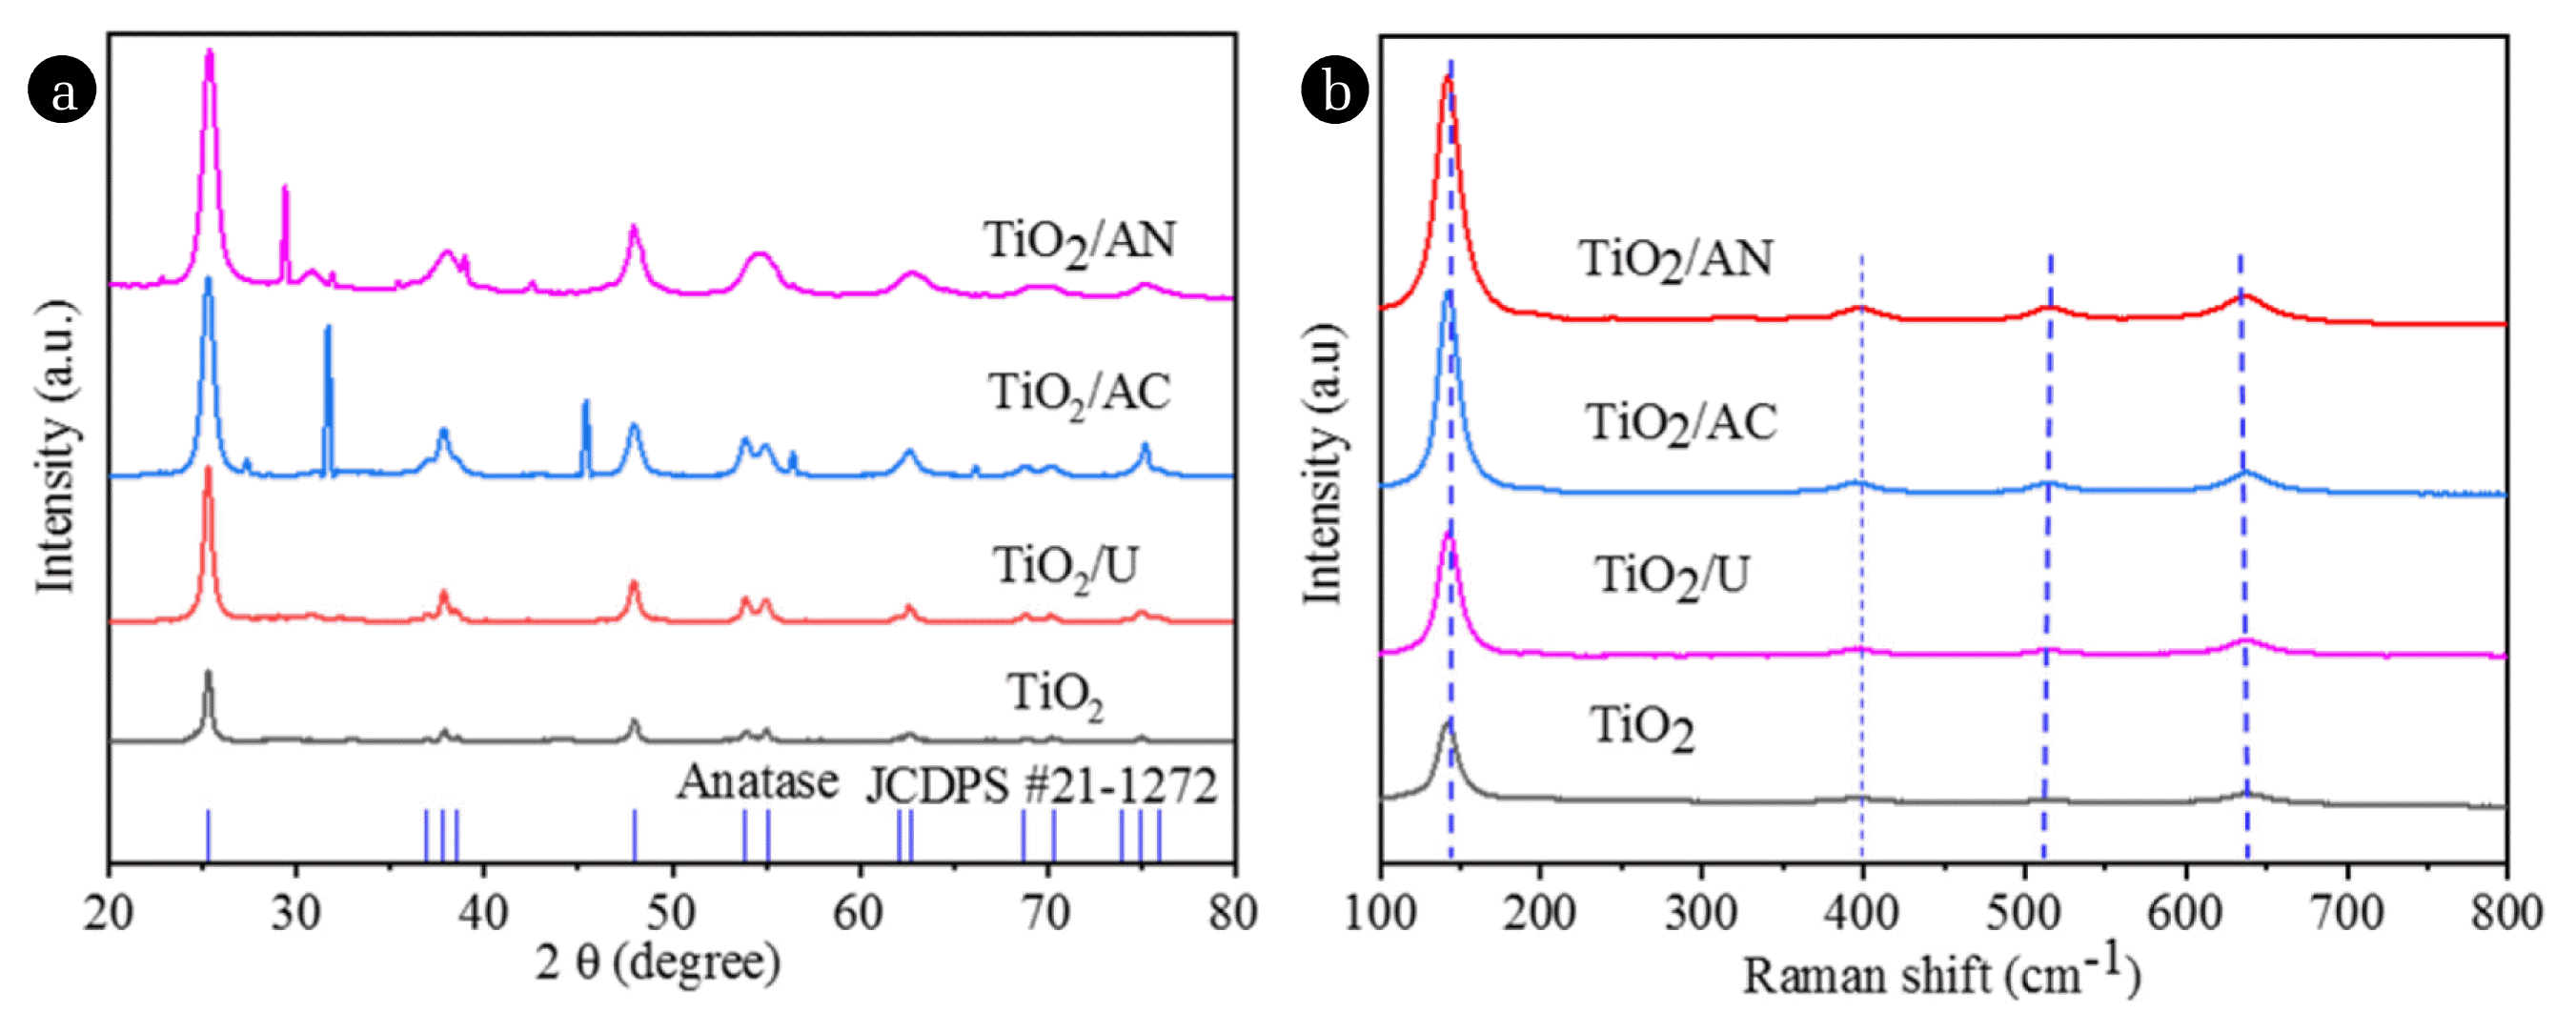
XRD measurements were performed to identify the crystal structures of the four samples (pure TiO2, TiO2/U, TiO2/AC and TiO2/AN) and the results are shown in Fig. 2(a). The XRD spectra results of these samples indicated that the main diffraction peaks at 25.3°, 37.9°, 48.1°, 54.0°, 55.1° and 62.9° are attributed to (101), (004), (200), (105), (211) and (204) lattice planes of anatase of TiO2, agreeing well with the standard JCPDS No. 21-1272, respectively. Specifically, all diffraction peaks of pure TiO2 and TiO2/U samples belong to the crystalline phase of anatase of TiO2. However, for TiO2/AC and TiO2/AN samples, some new diffraction peaks were observed in their XRD patterns. The new diffraction peaks at about 27.4°, 31.7°, 45.4°, 56.5° and 66.2° were observed along with the anatase phase peaks for TiO2/AC sample, which is attributed to the (111), (200), (220), (222) and (400) planes of NaCl (JCPDS No. 75-0306), respectively. At the same time, for TiO2/AN sample, new diffraction peaks at about 29.4°, 31.8°, 35.4° and 42.5° were observed along with the anatase phase peaks and they may belong to the planes (104), (006), (110) and (202) of NaNO3 (JCPDS No. 72-1213), respectively. It is worth noting that NaNO3 and NaCl were generated by the reactions between Na+ and the anions in the dopants NH4NO3 and NH4Cl, respectively, where Na+ comes from the precursor NaOH used in the preparation of TiO2. In addition, two diffraction peaks of NH4NO3 (JCPDS No. 74-0972) were observed at 22.8 ° and 27.8° for (111) and (210) planes, respectively. These give the evidence that NH4NO3 was doped successfully into the crystal structure of TiO2, including N5+ (NO3−) and N3− (NH4+), which is consistent with the conclusion of XPS analysis discussed later. It may be one of the reasons for the improvement of the photocatalytic activity of TiO2/AN sample because NO3− and NH4+ can trap photogenic electrons (e−) or photogenic holes (h+) to prevent e−/h+ pairs recombination and this helps to promote the charge separation. Based on the Scherrer’s formula and XRD peak at about 25.3° of (101) plane, the average crystallite sizes of TiO2, TiO2/U, TiO2/AC and TiO2/AN samples were calculated, and they were 19.9, 16.1, 14.2 and 11.0 nm, respectively. These results showed that the average particle size of TiO2/AN sample is less than that of other three samples. Thus, it illustrates that NH4NO3 doping can inhibit better the crystal growth of anatase TiO2, which helps to improve the photocatalytic activity of TiO2.
Fig. 2(b) displays the Raman spectra of TiO2, TiO2/U, TiO2/AC and TiO2/AN samples. Raman peak shifts at about 145, 397, 516, 639 cm−1 stem from the characteristic Raman peaks of anatase phase [36, 40, 41], demonstrating that the main phase structure of the prepared samples was anatase. No peak attributed to nitrogen-containing phases was detected in the doped TiO2 catalysts, indicating that nitrogen was highly dispersed on the TiO2 surface. It can be observed that the peak at about 145 cm−1 for the doped TiO2 samples became wider in the following order TiO2 < TiO2/U < TiO2/AC < TiO2/AN, suggesting that their particles size decreases correspondingly and the results of Raman analysis are in good agreement with the XRD results (see Fig. 2(a)).
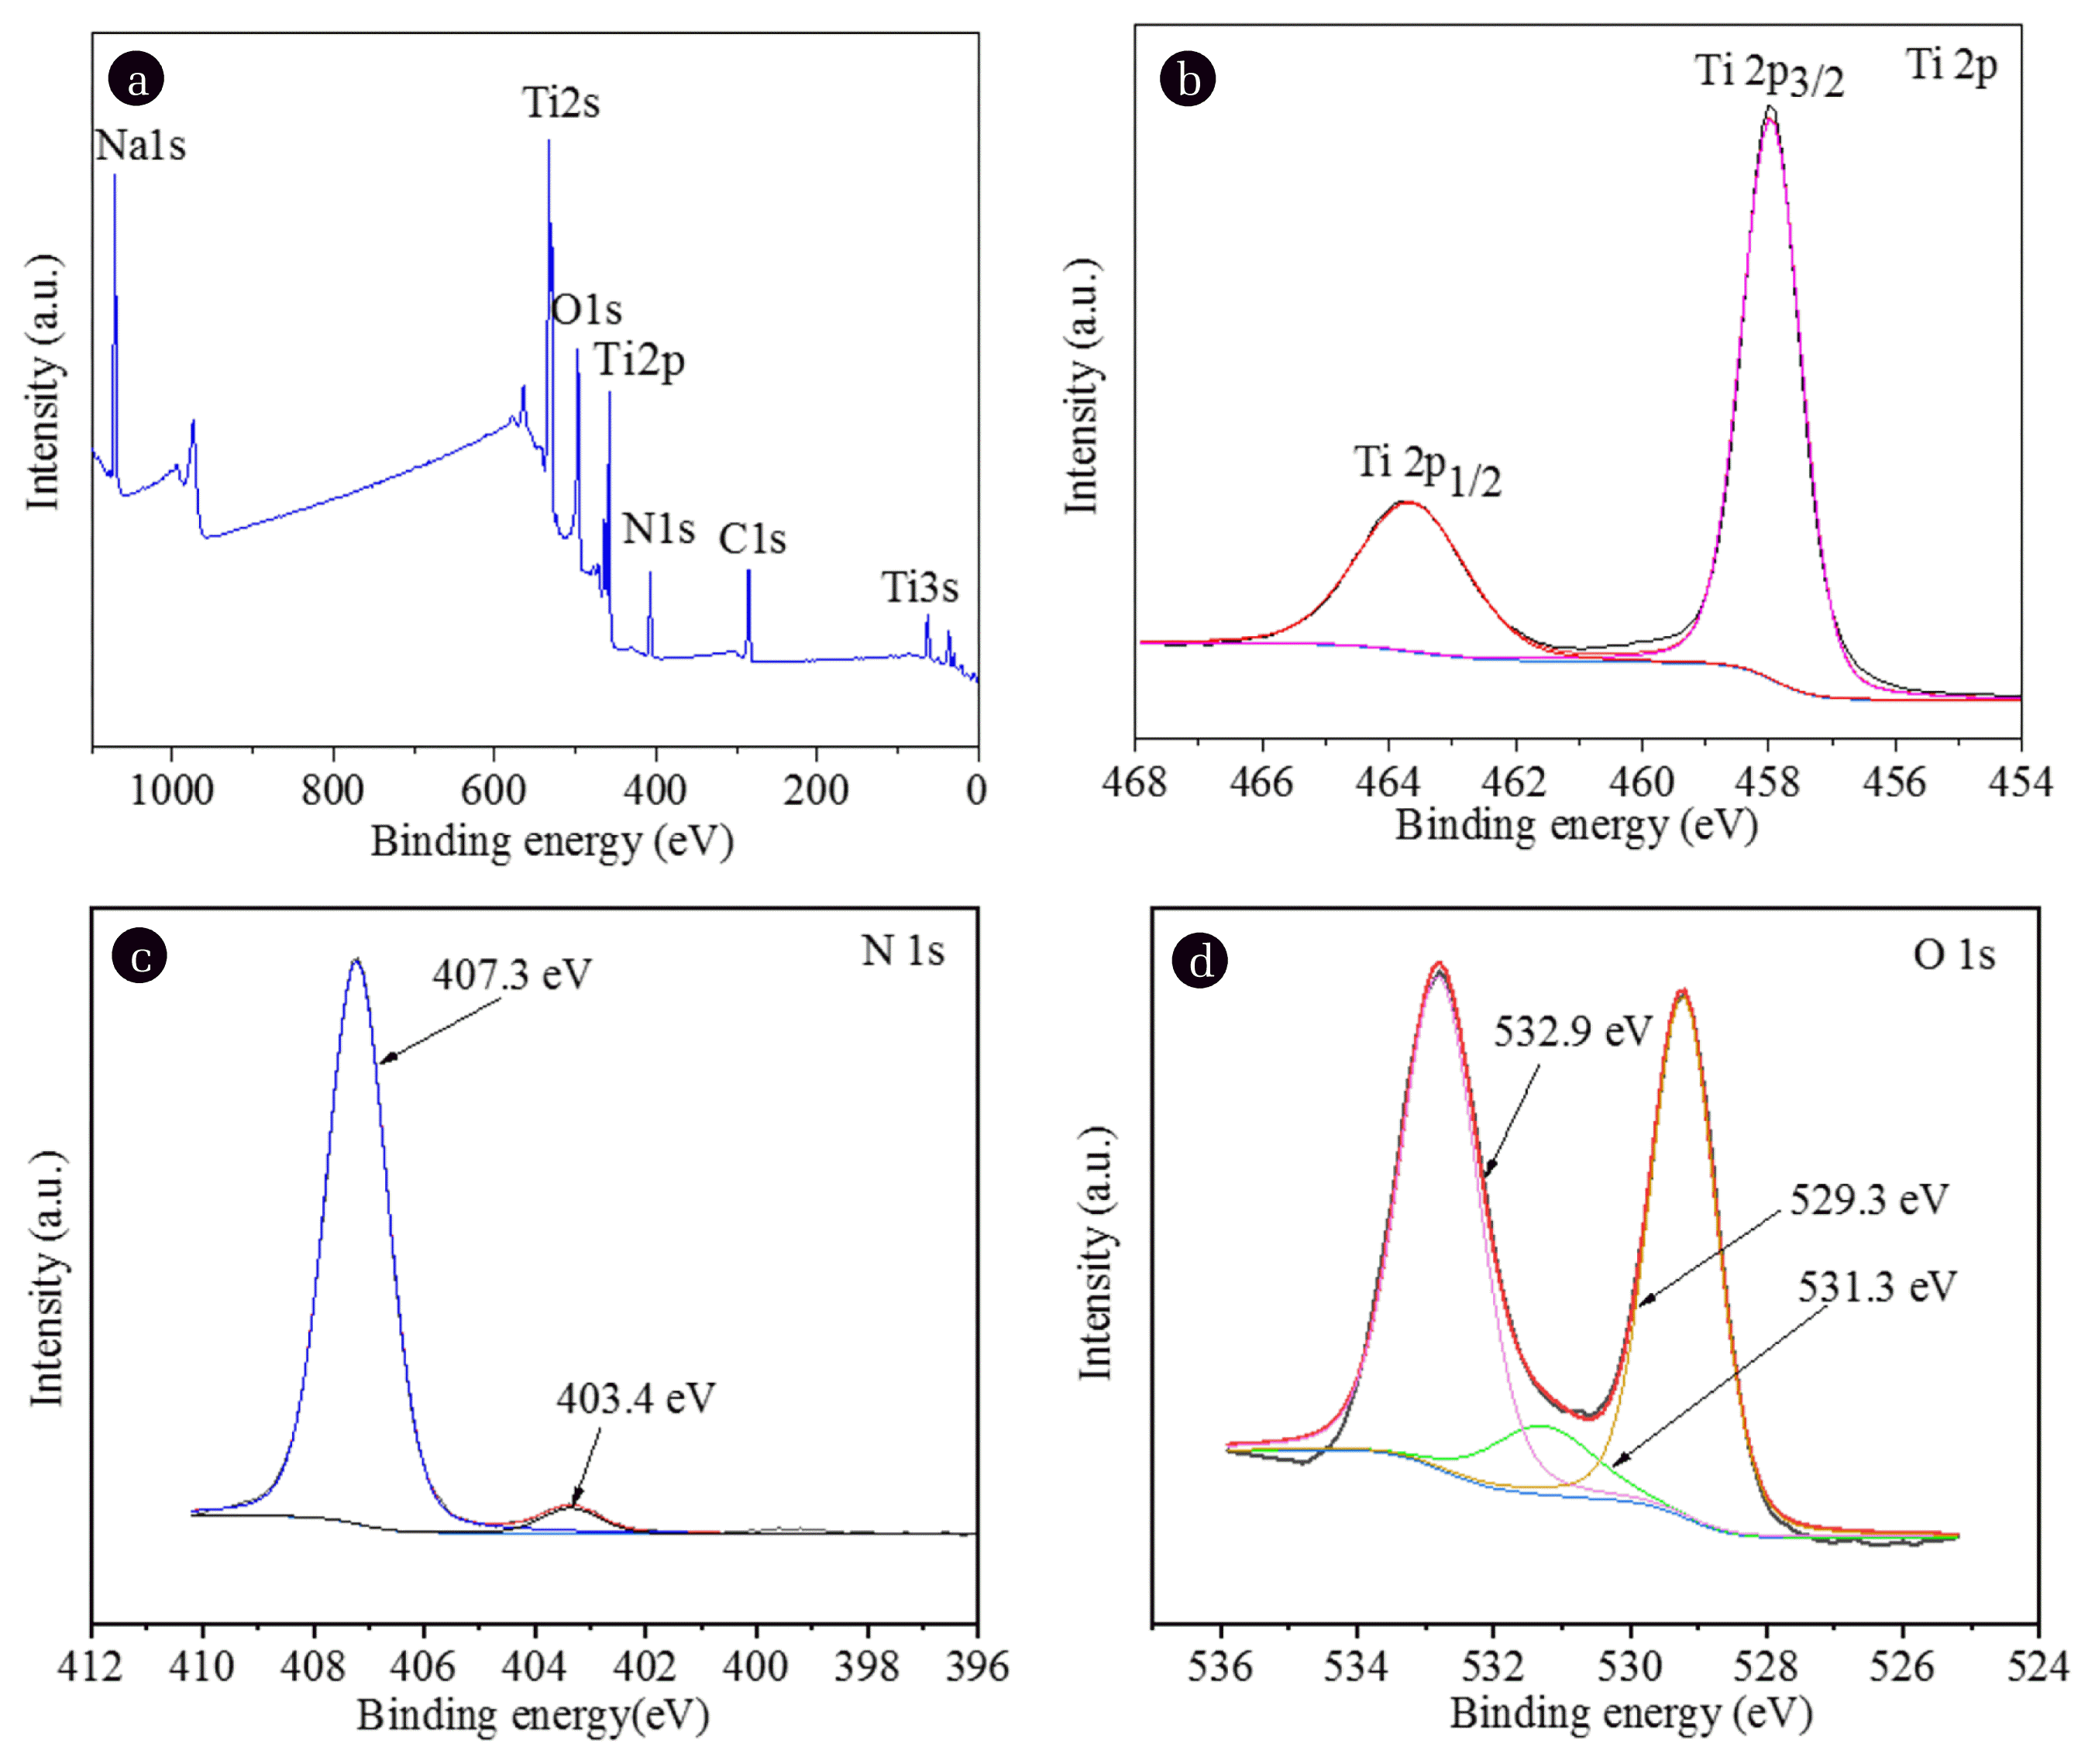
The surface composition and chemical states of elements in the NH4NO3-doped TiO2 sample were further characterized by XPS and shown in Fig. 3. Fig. 3(a) presented the XPS full spectrum survey of the sample and shows that the species like C, N, O, Ti and Na are predominantly present in the wide XPS spectrum. Taking the C 1s peak (286.4 eV) as a benchmark, the obtained binding energies were corrected. The C 1s peak may come from exterior hydrocarbon from XPS instrument itself [1]. Based on the XPS data, the atomic concentrations of Ti, O, Na and N for the TiO2/AN sample were estimated to be about 9.8, 47.8, 12.5 and 9.2 atom%, respectively. Na 1s peak at about 1,071.3 eV comes from the precipitant NaOH used during the synthesis of TiO2 [42]. As shown in Fig. 3(b), two peaks located at 458.1 and 463.9 eV in Ti 2p XPS spectrum belong to Ti 2p3/2 and Ti 2p1/2, respectively. The two peaks have slightly lower binding values than those of classical spectrum of Ti4+ in TiO2 [43], suggesting NO3− doping has negligible effect on the chemical valence status of Ti. Fig. 3(c) indicates that two N 1s peaks are observed at 407.32 eV and 403.35 eV, implying that there are two kinds of doped N species. The peaks at 407.32 eV is assigned to the binding energy of N5+ in NO3− ions, which confirms that NO3− can be incorporated into the TiO2 lattice, the other at 403.35 eV is attribute to N3− in NH4+. The relative magnitude of their peak areas suggested that N5+ is main N doping species. As shown in Fig. 3(d), the XPS spectra of O 1s can be fitted into three different peaks at binding energy values of 532.9, 531.3 and 529.3 eV corresponding to surface chem-isorbed oxygen, oxygen vacancies and lattice oxygen respectively. The peak at 532.9 eV belongs to O atoms of NO3− ions, demonstrating successful preparation of NO3−-doped TiO2.
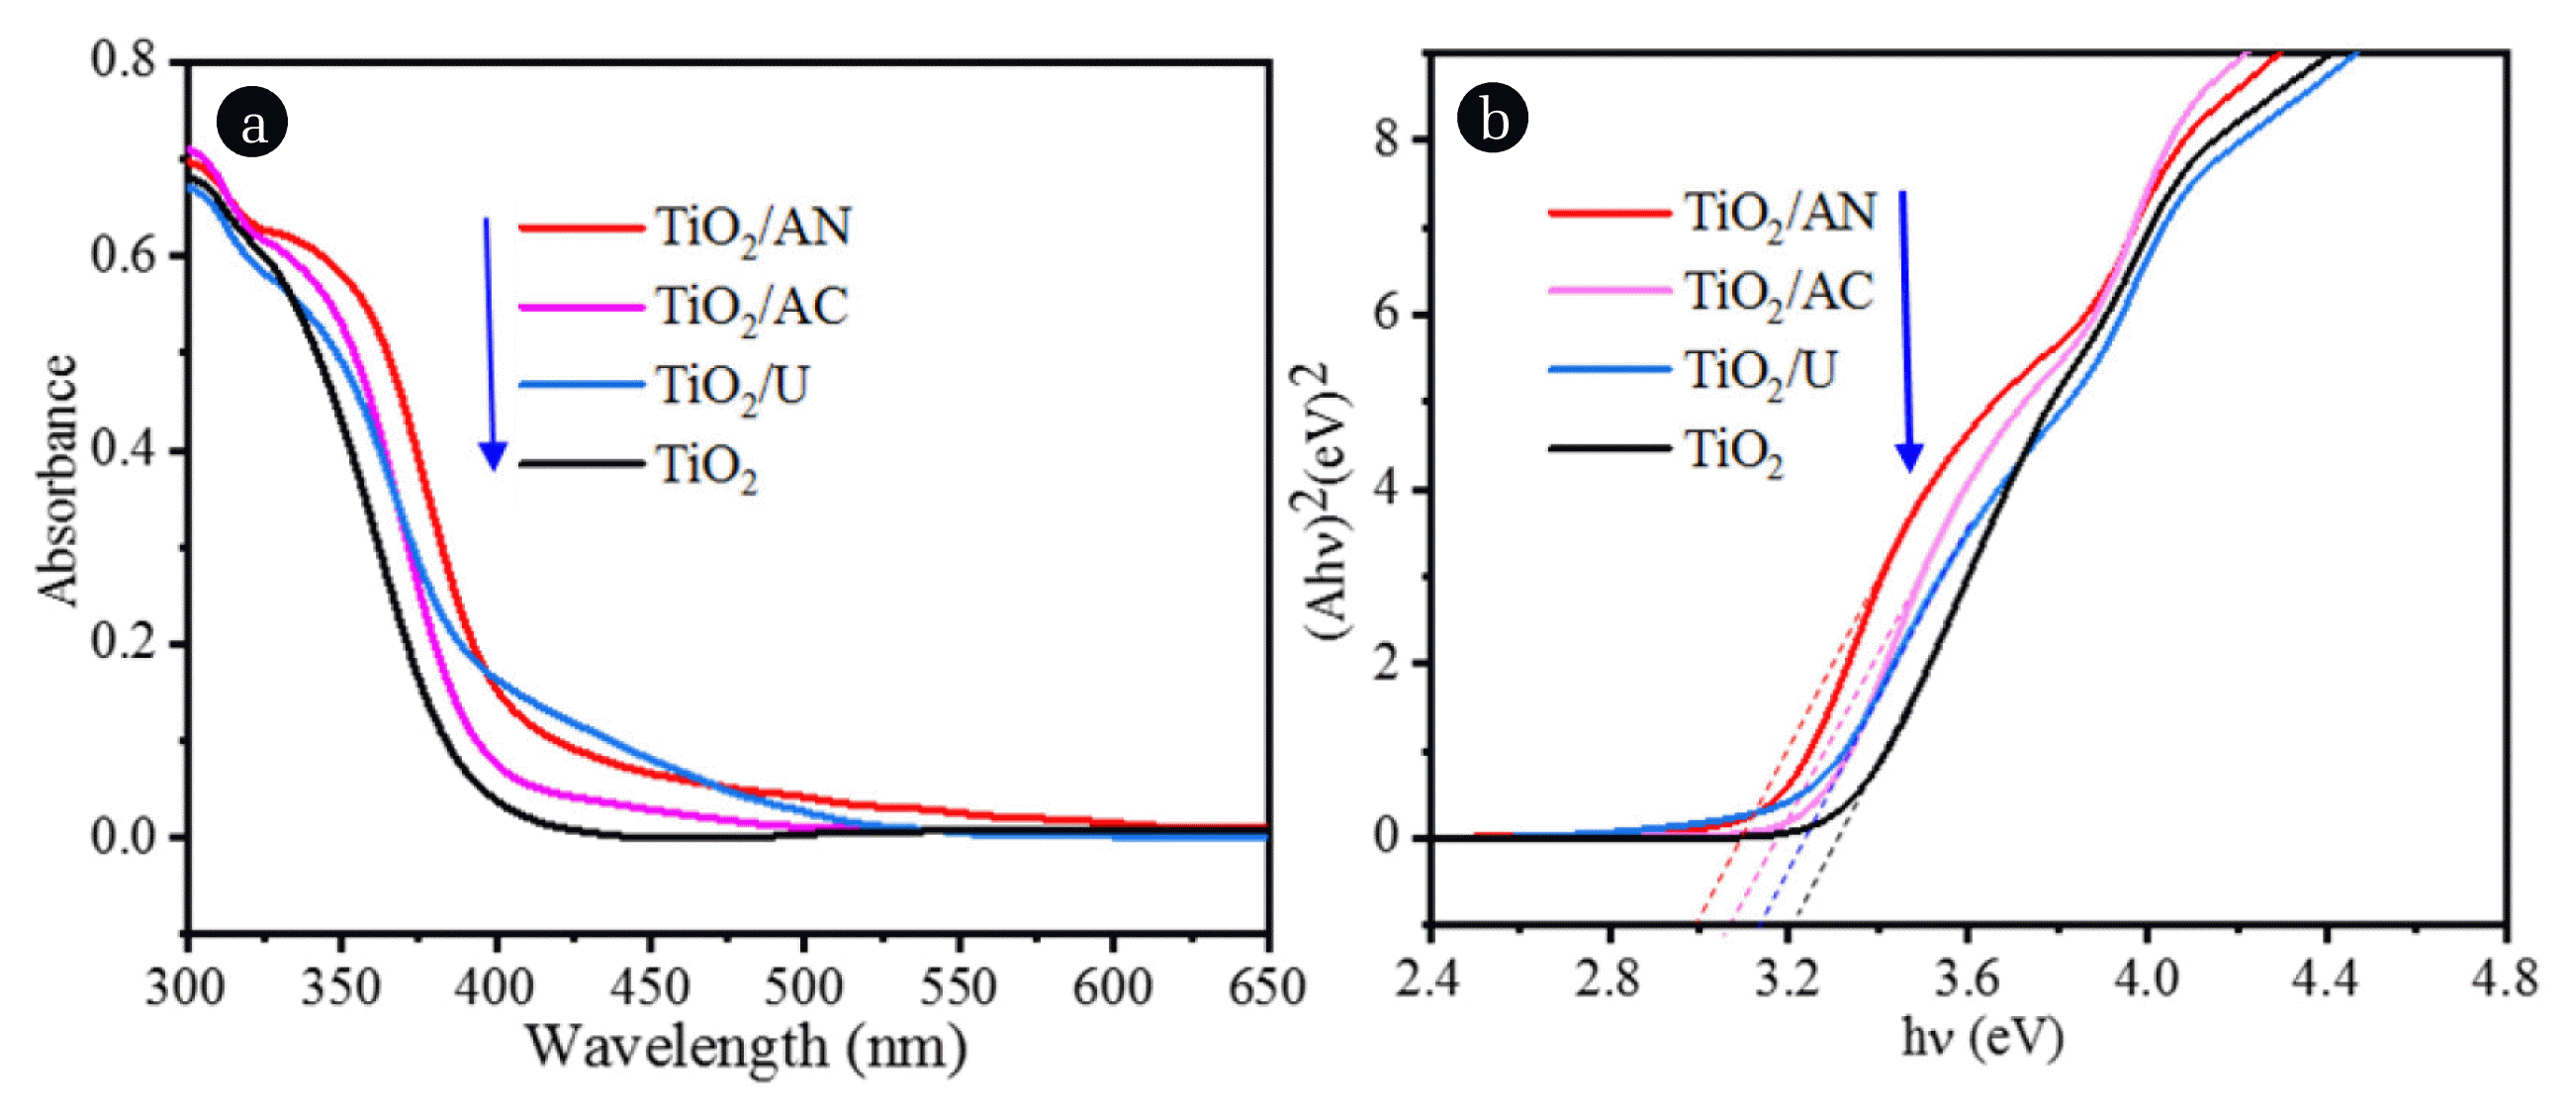
UV–Vis diffuse reflectance spectra (UV-Vis-DRS) of as-synthesized samples are indicated in Fig. 4. A weak absorption band between 400 and 520 nm was found for TiO2/U, TiO2/AC and TiO2/AN, suggesting that the light absorption performance of TiO2/U, TiO2/AC and TiO2/AN is better than that of TiO2. On the other hand, the forbidden band width values (Eg) for TiO2, TiO2/U, TiO2/AC and TiO2/AN can be estimated using a Tauc plot based on the UV-Vis-DRS data, and the corresponding values are 3.22, 3.15, 3.10 and 3.01 eV, respectively. Therefore, N-doping can narrow the band gap of TiO2 and enhance its performance for photocatalytic degradation of FLU, especially for TiO2/AN. The same result was also found for urea or thiourea-doped TiO2 prepared using the sol–gel technique, and the shift of the light absorption profile in N-doped TiO2 may be associated to the presence of manifold surface states close to the valence band edge [35].
3.2. Photocatalytic Activity
3.2.1. Comparison of photocatalytic activity of N-doped TiO2 with different nitrogen sources
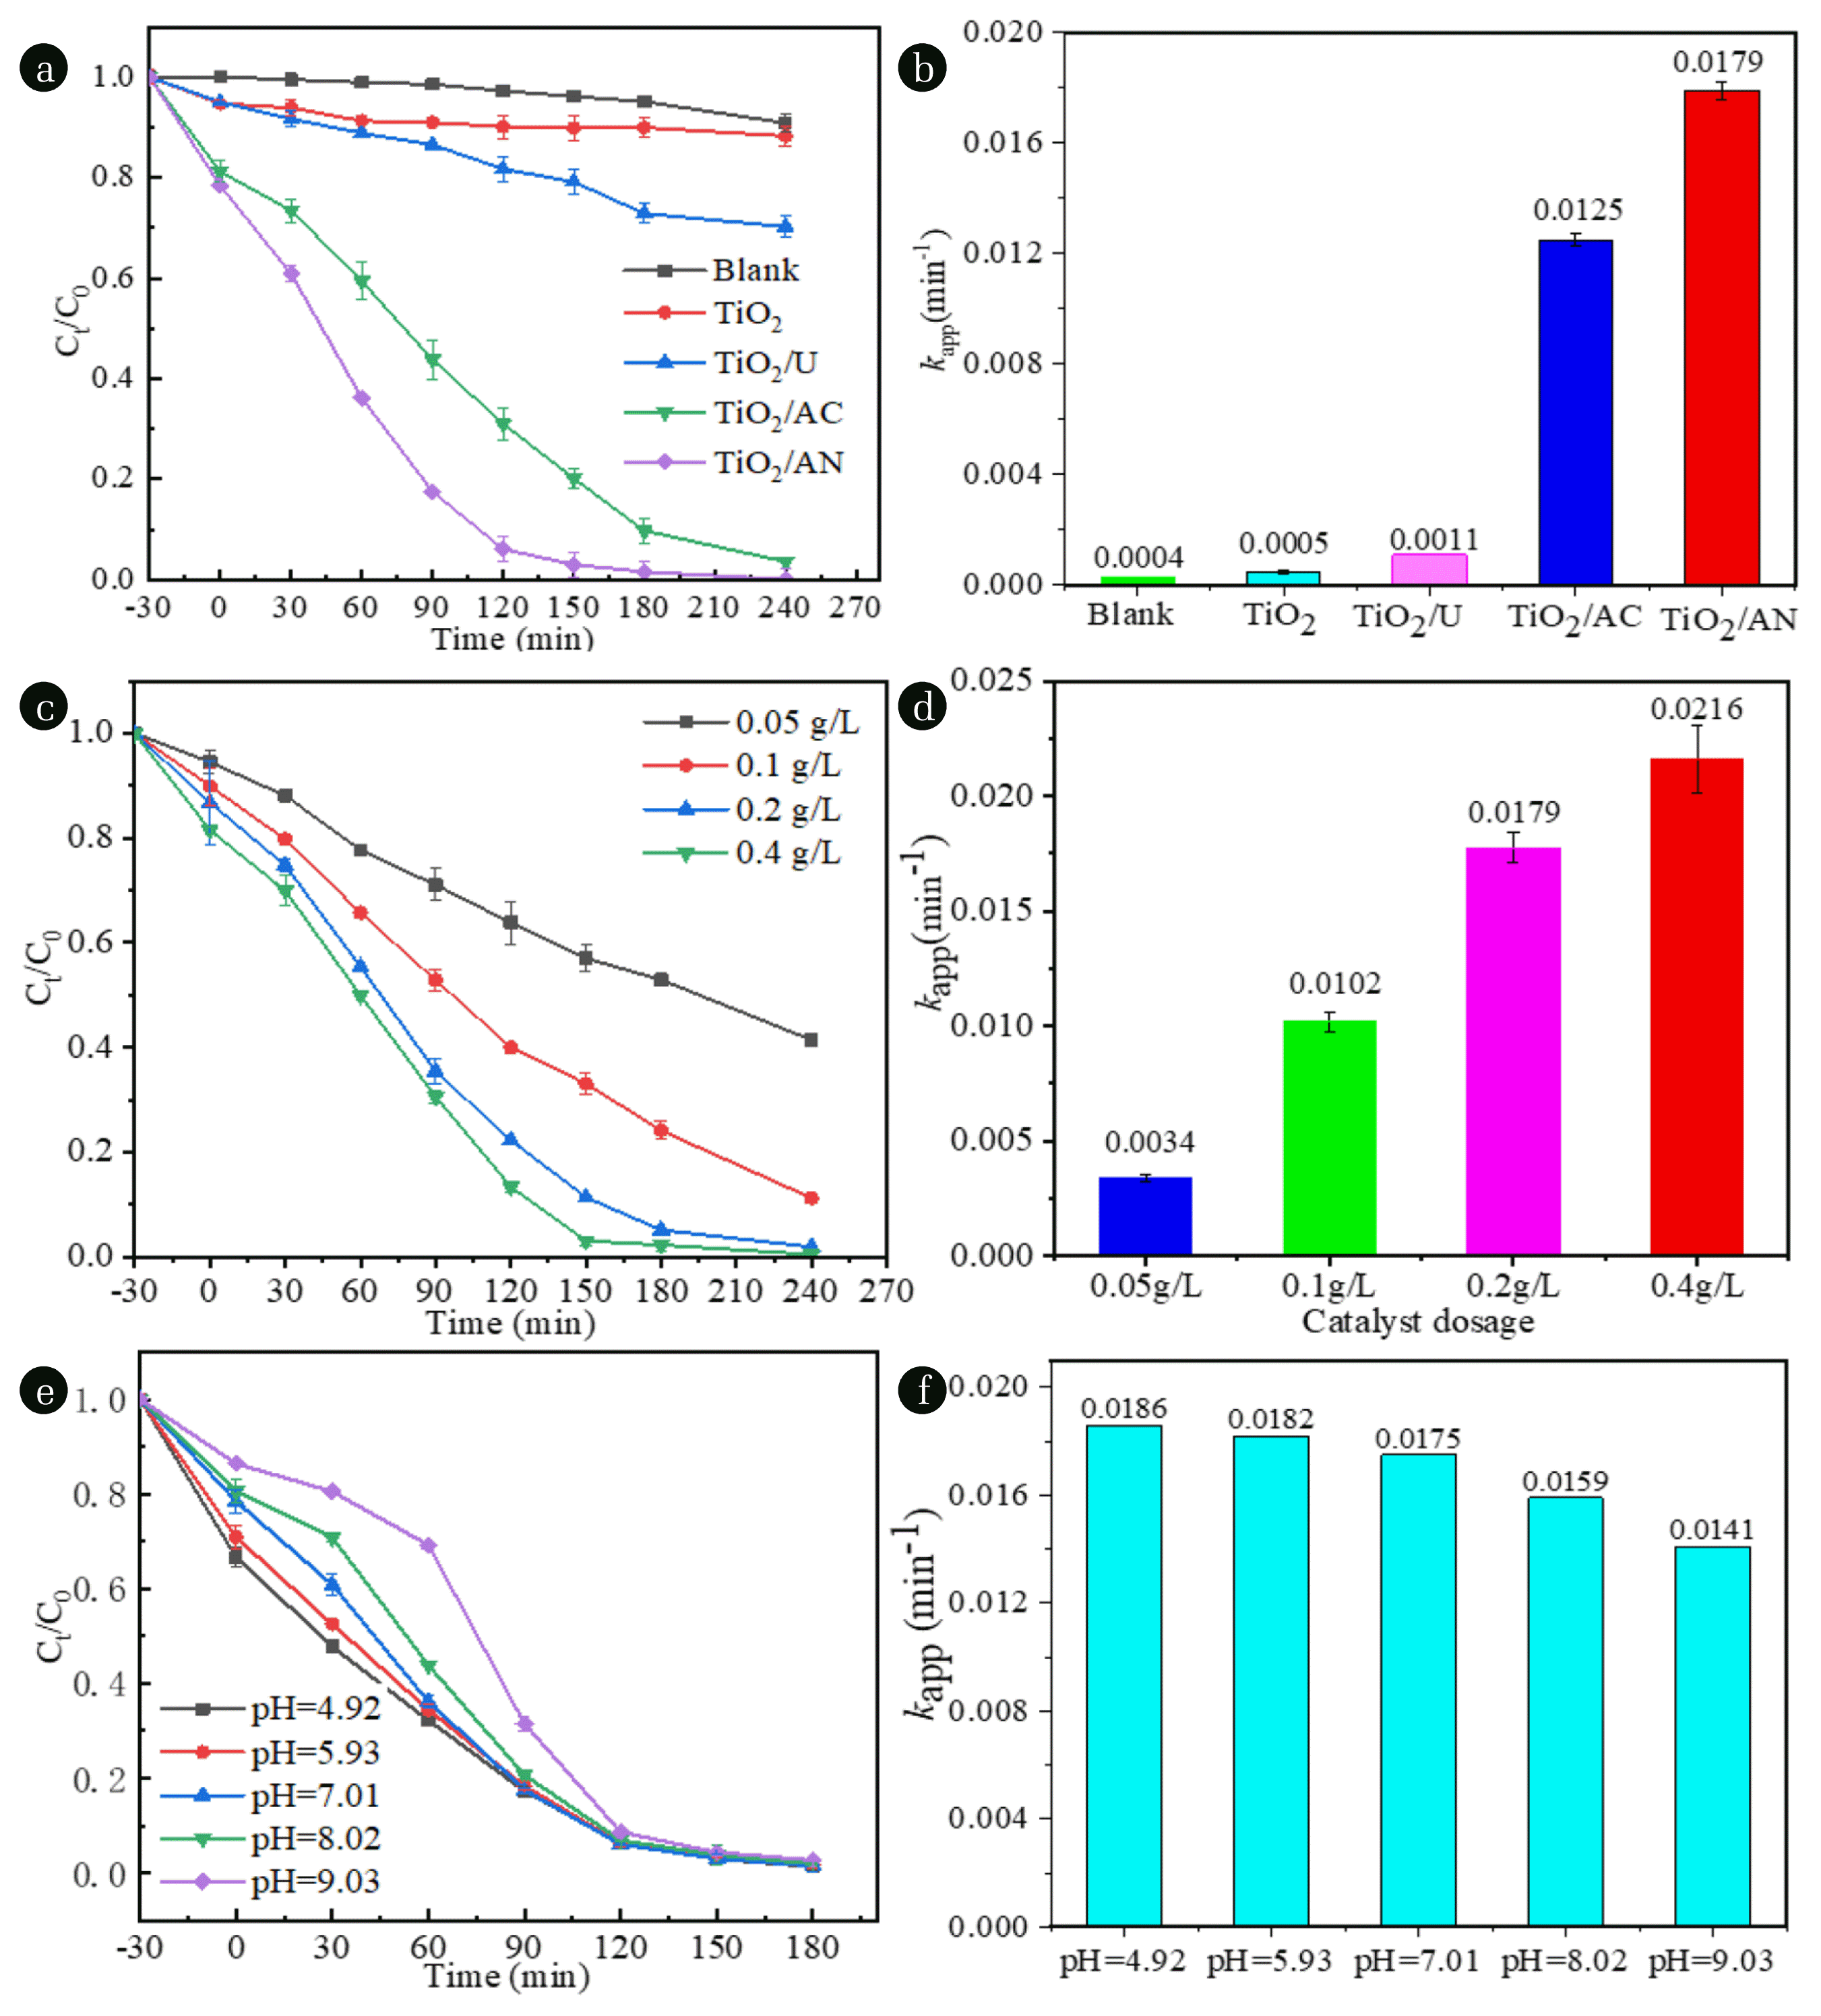
The efficiencies for FLU degradation using TiO2, TiO2/U, TiO2/AC or TiO2/AN as photocatalyst are displayed in Fig. 5(a). When pure TiO2 was used as catalyst, the removal efficiency of FLU is only about 12% after 4 hours of illumination, while the corresponding values for TiO2/U, TiO2/AC and TiO2/AN are about 25%, 98% and 100%, respectively. This result indicated that all of three N-doped TiO2 samples show higher photocatalytic performance than pure TiO2 for FLU removal, and the order of FLU removal efficiency for different photocatalysts is as follows: TiO2/AN > TiO2/AC > TiO2/U > TiO2. Meantime, it can be seen from Fig. 5(b) that the calculated apparent first-order rate constants (kapp) in the presence of TiO2/AN catalyst is about 35, 16 or 1.4 times higher than that of pure TiO2, TiO2/U or TiO2/AC, respectively, where the kapp values could be obtained from the slope of regression line by plotting −ln(Ct/C0) vs. irradiation time (t). These results suggested that TiO2/AN sample exhibits the highest photocatalytic activity in the removal process of FLU. This may be because that two different valence states of nitrogen (N5+ and N3−) exist in this catalyst and prefer to capture photogenerated electrons, resulting in a reduce of recombination rate of the photogenerated electron and hole pairs and hence an improvement of the degradation efficiency of FLU. It should be noted that the first 30 minutes in the degradation efficiency curves of Fig. 5(a) (Abscissa from −30 to 0 min) is actually a dark adsorption process without light illumination. It can be seen from Fig. 5(a) that the adsorption rates of FLU by TiO2 and TiO2/U were less than 5% after adsorption equilibrium, while that for TiO2/AC or TiO2/AN was about 18% or 23%, respectively. This result indicated that the stronger the catalyst adsorbs FLU in the solution, the higher its photocatalytic degradation ability to FLU. However, in general, the adsorption ability of several catalysts involved in this work on FLU in solution was not strong, which suggests that the main effects of TiO2/AN and TiO2/AC on the removal of FLU are their photocatalytic performance, and the adsorption effect is relatively smaller. In addition, a direct photolysis experiment without adding any catalyst was also performed, and the result indicated that the degradation efficiency of FLU was less 7% after 4 hours of illumination (marked as “Blank” in Fig. 5(a)). Thus, the contribution of direct photolysis to degradation of FLU is negligible.
3.2.2. Effect of TiO2/AN dosage on photocatalytic degradation of FLU
Fig. 5(c) and (d) show the effect of TiO2/AN catalyst dosage (dosage c = 0.05, 0.1, 0.2 and 0.4 g L−1) on the FLU degradation process. Fig. 5(c) indicates that the FLU removal efficiency increases with increasing the dosage of catalyst. Obviously, this enhancement in removal efficiency was due to an increase of the number of active sites on the used photocatalysts. In addition, their kapp values for initial dosages of TiO2/AN (0.05, 0.1, 0.2 and 0.4 g L−1) were observed as 0.0034, 0.0102, 0.0179, and 0.0216 min−1, respectively (Fig. 5(d)). It can also be found that the kapp is nearly proportional to the dosage of catalyst and the fitting equation can be expressed as kapp = 0.0062c − 0.0023 (R2 = 0.982). Considering that when the catalyst dosage was 0.2 g L−1, a near complete removal of FLU was achieved after 4 hours of irradiation, the TiO2/AN dosage was kept at 0.2 g L−1 for FLU degradation in subsequent experiments.
3.2.3. Effect of initial pH on photocatalytic degradation of FLU
Fig. 5(e) and (f) show the effect of pH (pH = 4.92, 5.93, 7.01, 8.02 and 9.03) on the FLU degradation. Fig. 5(e) indicates that the removal efficiency of FLU at the initial stage of degradation decreases with increasing the solution pH from 4.92 to 9.03. However, when the degradation time reaches 3 hours, regardless of the initial pH value, the degradation rate of FLU exceeds 90% in all five experiments. Moreover, the kapp values for the different initial pH were obtained as 0.0186, 0.0182, 0.0175, 0.0159 and 0.0141 min−1, respectively (see Fig. 5(f)). Based on the above results, it can be inferred that the initial pH has only little effect on photocatalytic degradation of FLU when TiO2/AN was employed as a photocatalyst.
3.2.4. Mineralization analysis
TOC determinations were carried out to evaluate the mineralization of FLU degradation when TiO2/AN was used as a photocatalyst. The results are displayed in Fig. S1. The TOC removal rate was found to be 81.2% after 4 h of irradiation. However, the TOC removal is relatively lower compared to the removal efficiency of FLU, suggesting that some intermediates were generated during FLU degradation, which will be discussed later.
3.3. Photocatalyst Stability
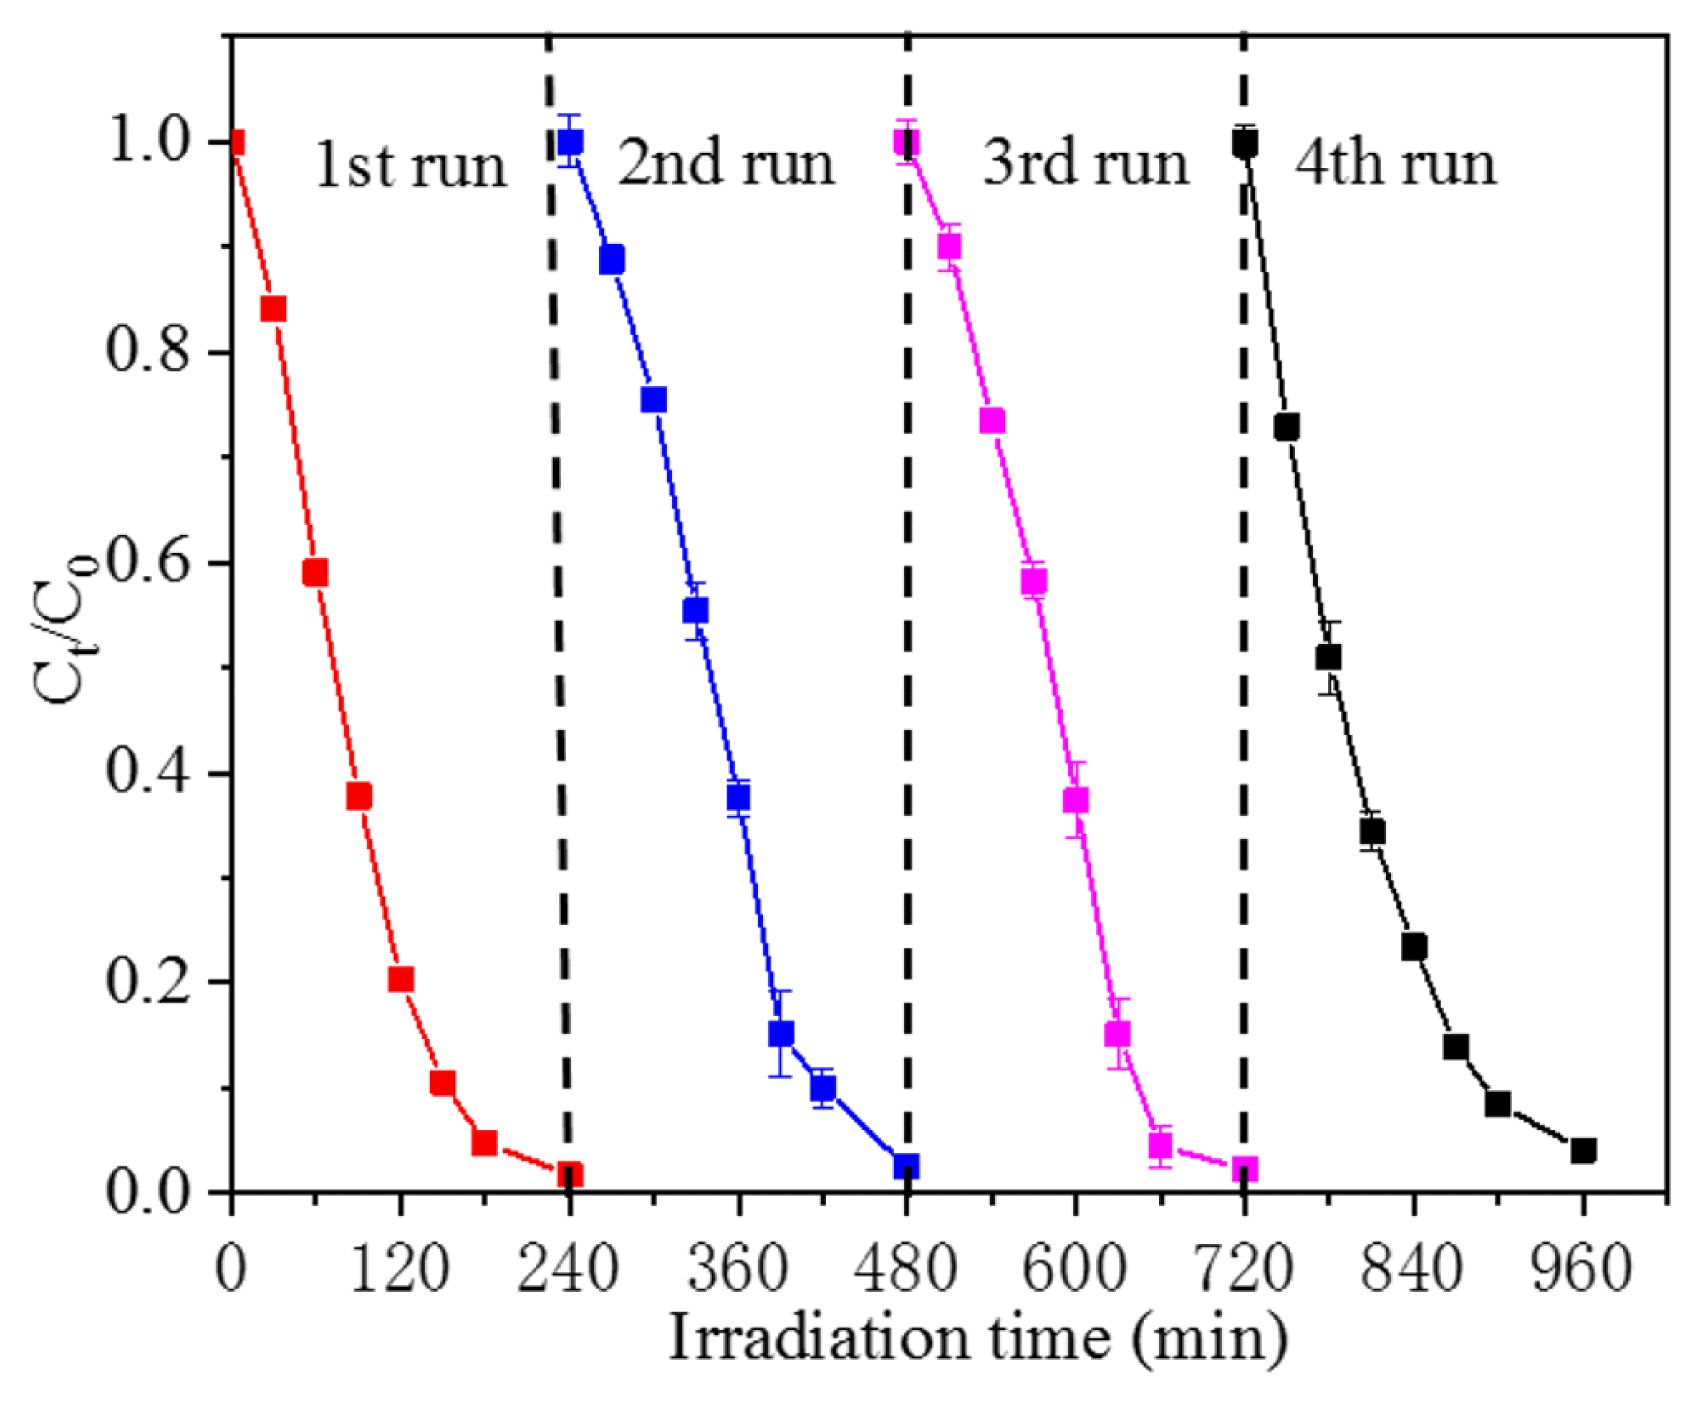
Four recycling experiments for degradation of FLU were performed to assess the photocatalytic stability and reusability of the TiO2/AN catalyst. The specific method of reusing TiO2/AN catalyst is as follows: 50 mL of FLU solution (10 mg L−1) and 10 mg fresh catalyst was added to the reaction vessel, and the suspension was left to equilibrium adsorption for 30 min in the dark and then subject to 500 W Xe light irradiation for 4 hours. FLU degradation was monitored at prescribed time intervals and the first cycle was completed. The catalyst was collected by centrifugation and then washed with ultrapure water three times. After washing, the water was removed as much as possible, only the catalyst solids were left and the fresh FLU reaction solution of 50 mL was added to the reaction tube, followed by the second run and this procedure was repeated for three cycles. The results are depicted in Fig. 6. FLU was almost completely removed by using TiO2/AN as catalyst after 4 hours irradiation at the first cycle, and FLU conversion efficiency remained at 91.8% with TiO2/AN catalyst after four cycles. The reduction in catalytic performance of TiO2/AN catalyst may originate from the catalyst loss due to washing process. Thus, the photocatalytic degradation of FLU by TiO2/AN was affected slightly during four consecutive runs under 500 W Xe light irradiation, indicating good photocatalytic stability of the TiO2/AN catalyst.
3.4. Role of Reactive Species in the Photocatalytic Degradation of FLU
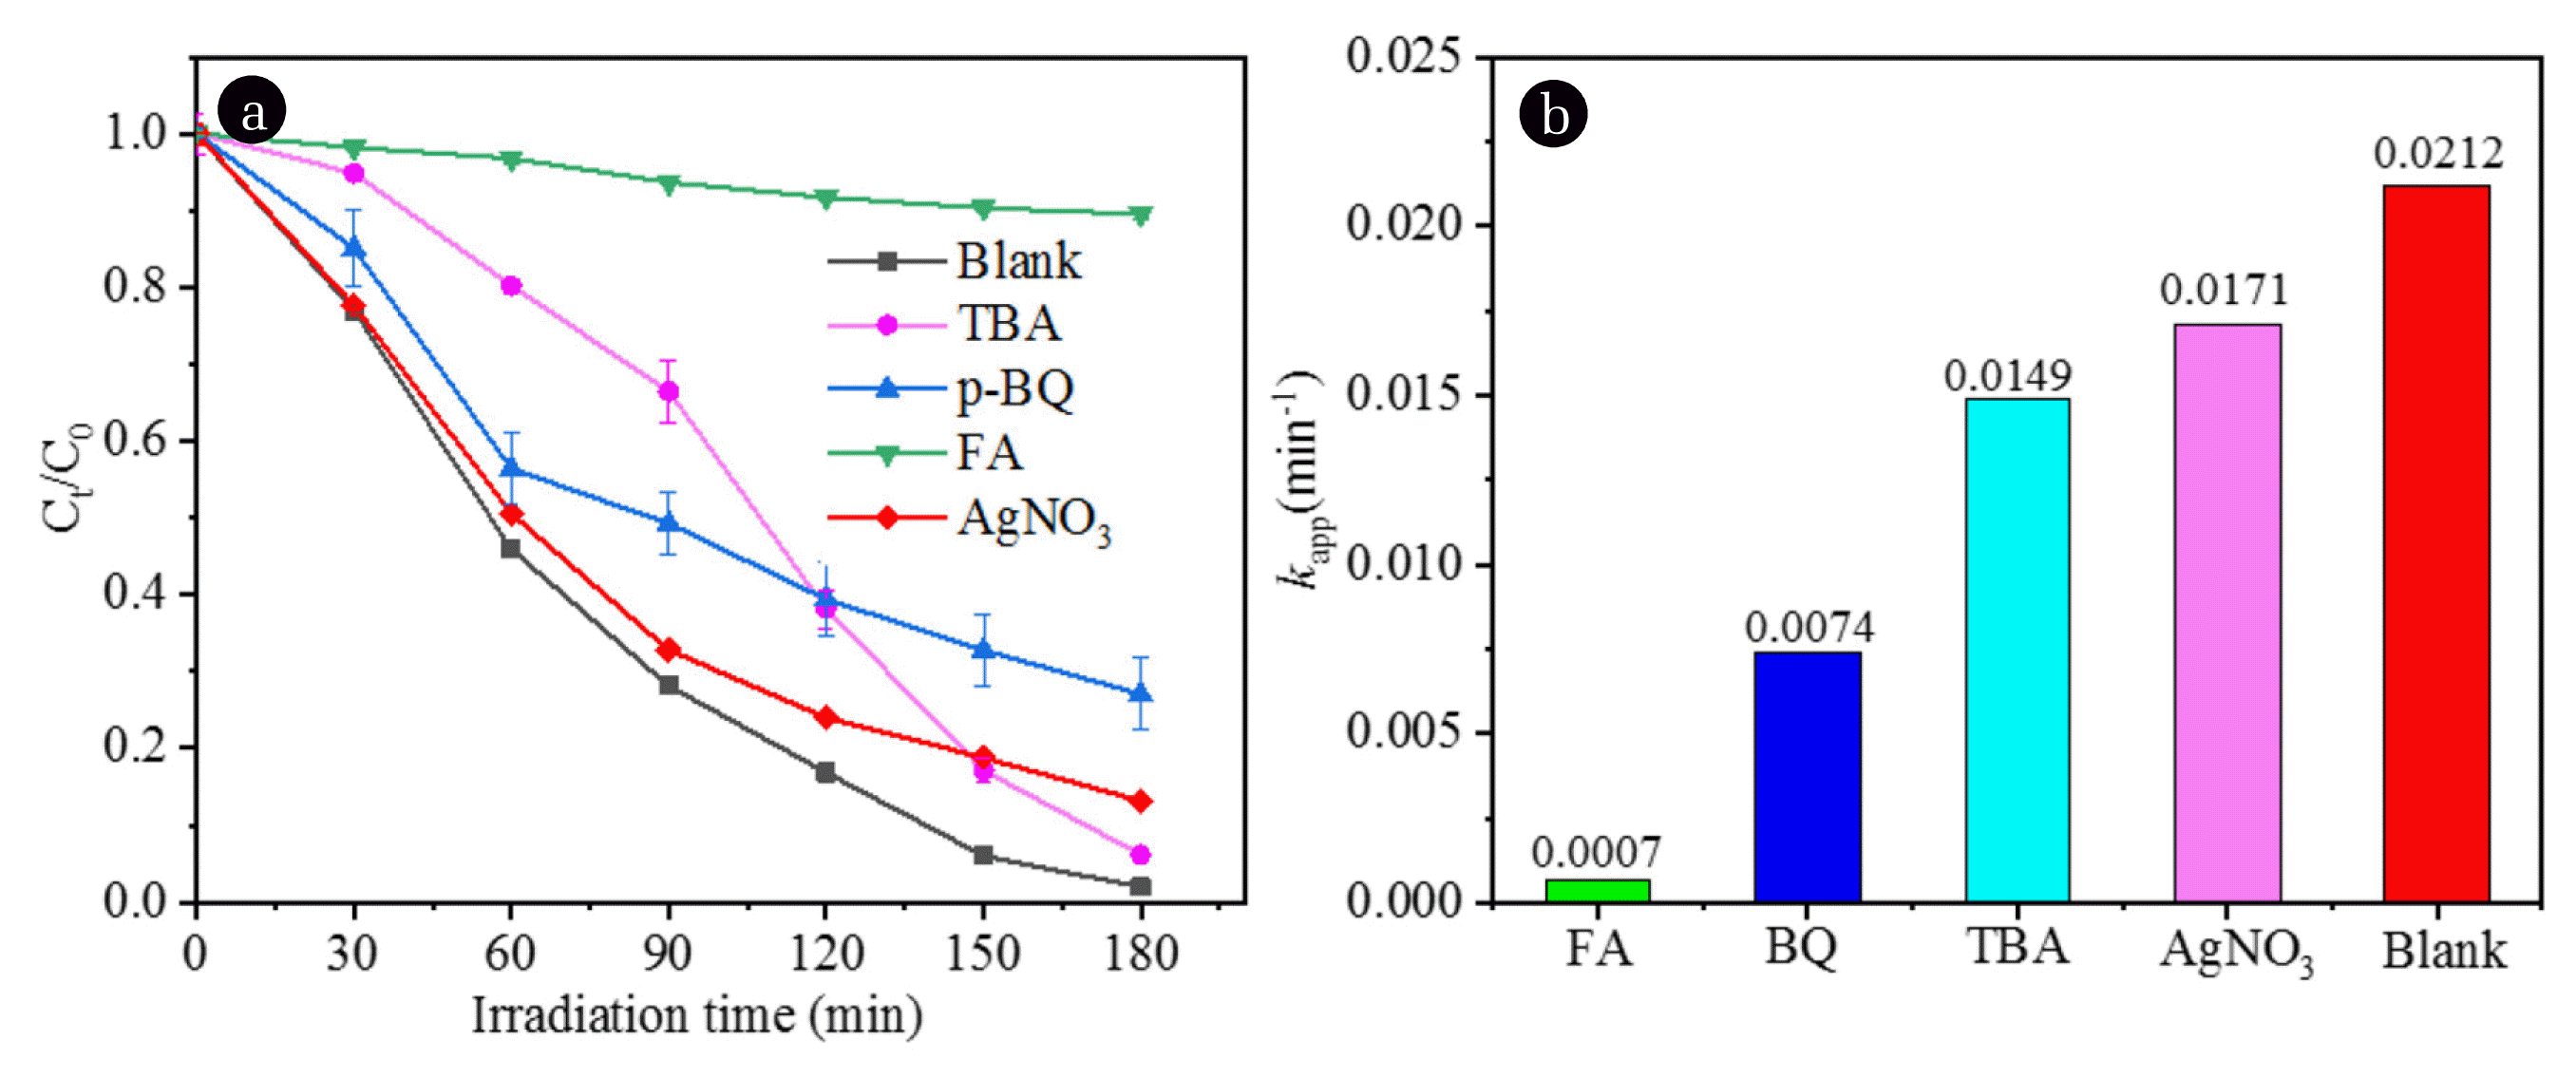
The reactive species quenching tests were performed to distinguish the major reactive components including •OH, O2•−, photogenerated holes (h+) and photogenerated electron (e−) during the photocatalytic degradation process of FLU with TiO2/AN as catalyst. In the experiments, TBA, p-BQ, FA and AgNO3 were used as scavenges to quench the related active species [37–39] and were separately introduced into the photocatalytic system (TBA for only free •OH, p-BQ for O2•−, FA for both h+ and total •OH, AgNO3 for e−, respectively). As shown in Fig. 7(a), the removal of FLU was all inhibited by the addition of these scavengers separately in the FLU solution. Compared with the blank test, the addition of AgNO3 in the FLU solution has slight inhibitory effect on the removal of FLU. However, the removal of FLU was obviously inhibited by the addition of FA and stronger inhibitory effect were also both observed after the addition of TBA and p-BQ. Their kapp values for photocatalytic degradation of FLU with or without scavenger were also calculated and displayed in Fig. 7(b). As observed in Fig. 7(b), the efficiency for photocatalytic degradation of FLU was inhibited in the order of FA > p-BQ > TBA > AgNO3. These experimental results indicated that both h+ and •OH are major reactive species in this photocatalytic degradation system and O2•− also play an important role, while e− play negligible roles.
3.5. Identification of Degradation Intermediates and Reaction Pathways
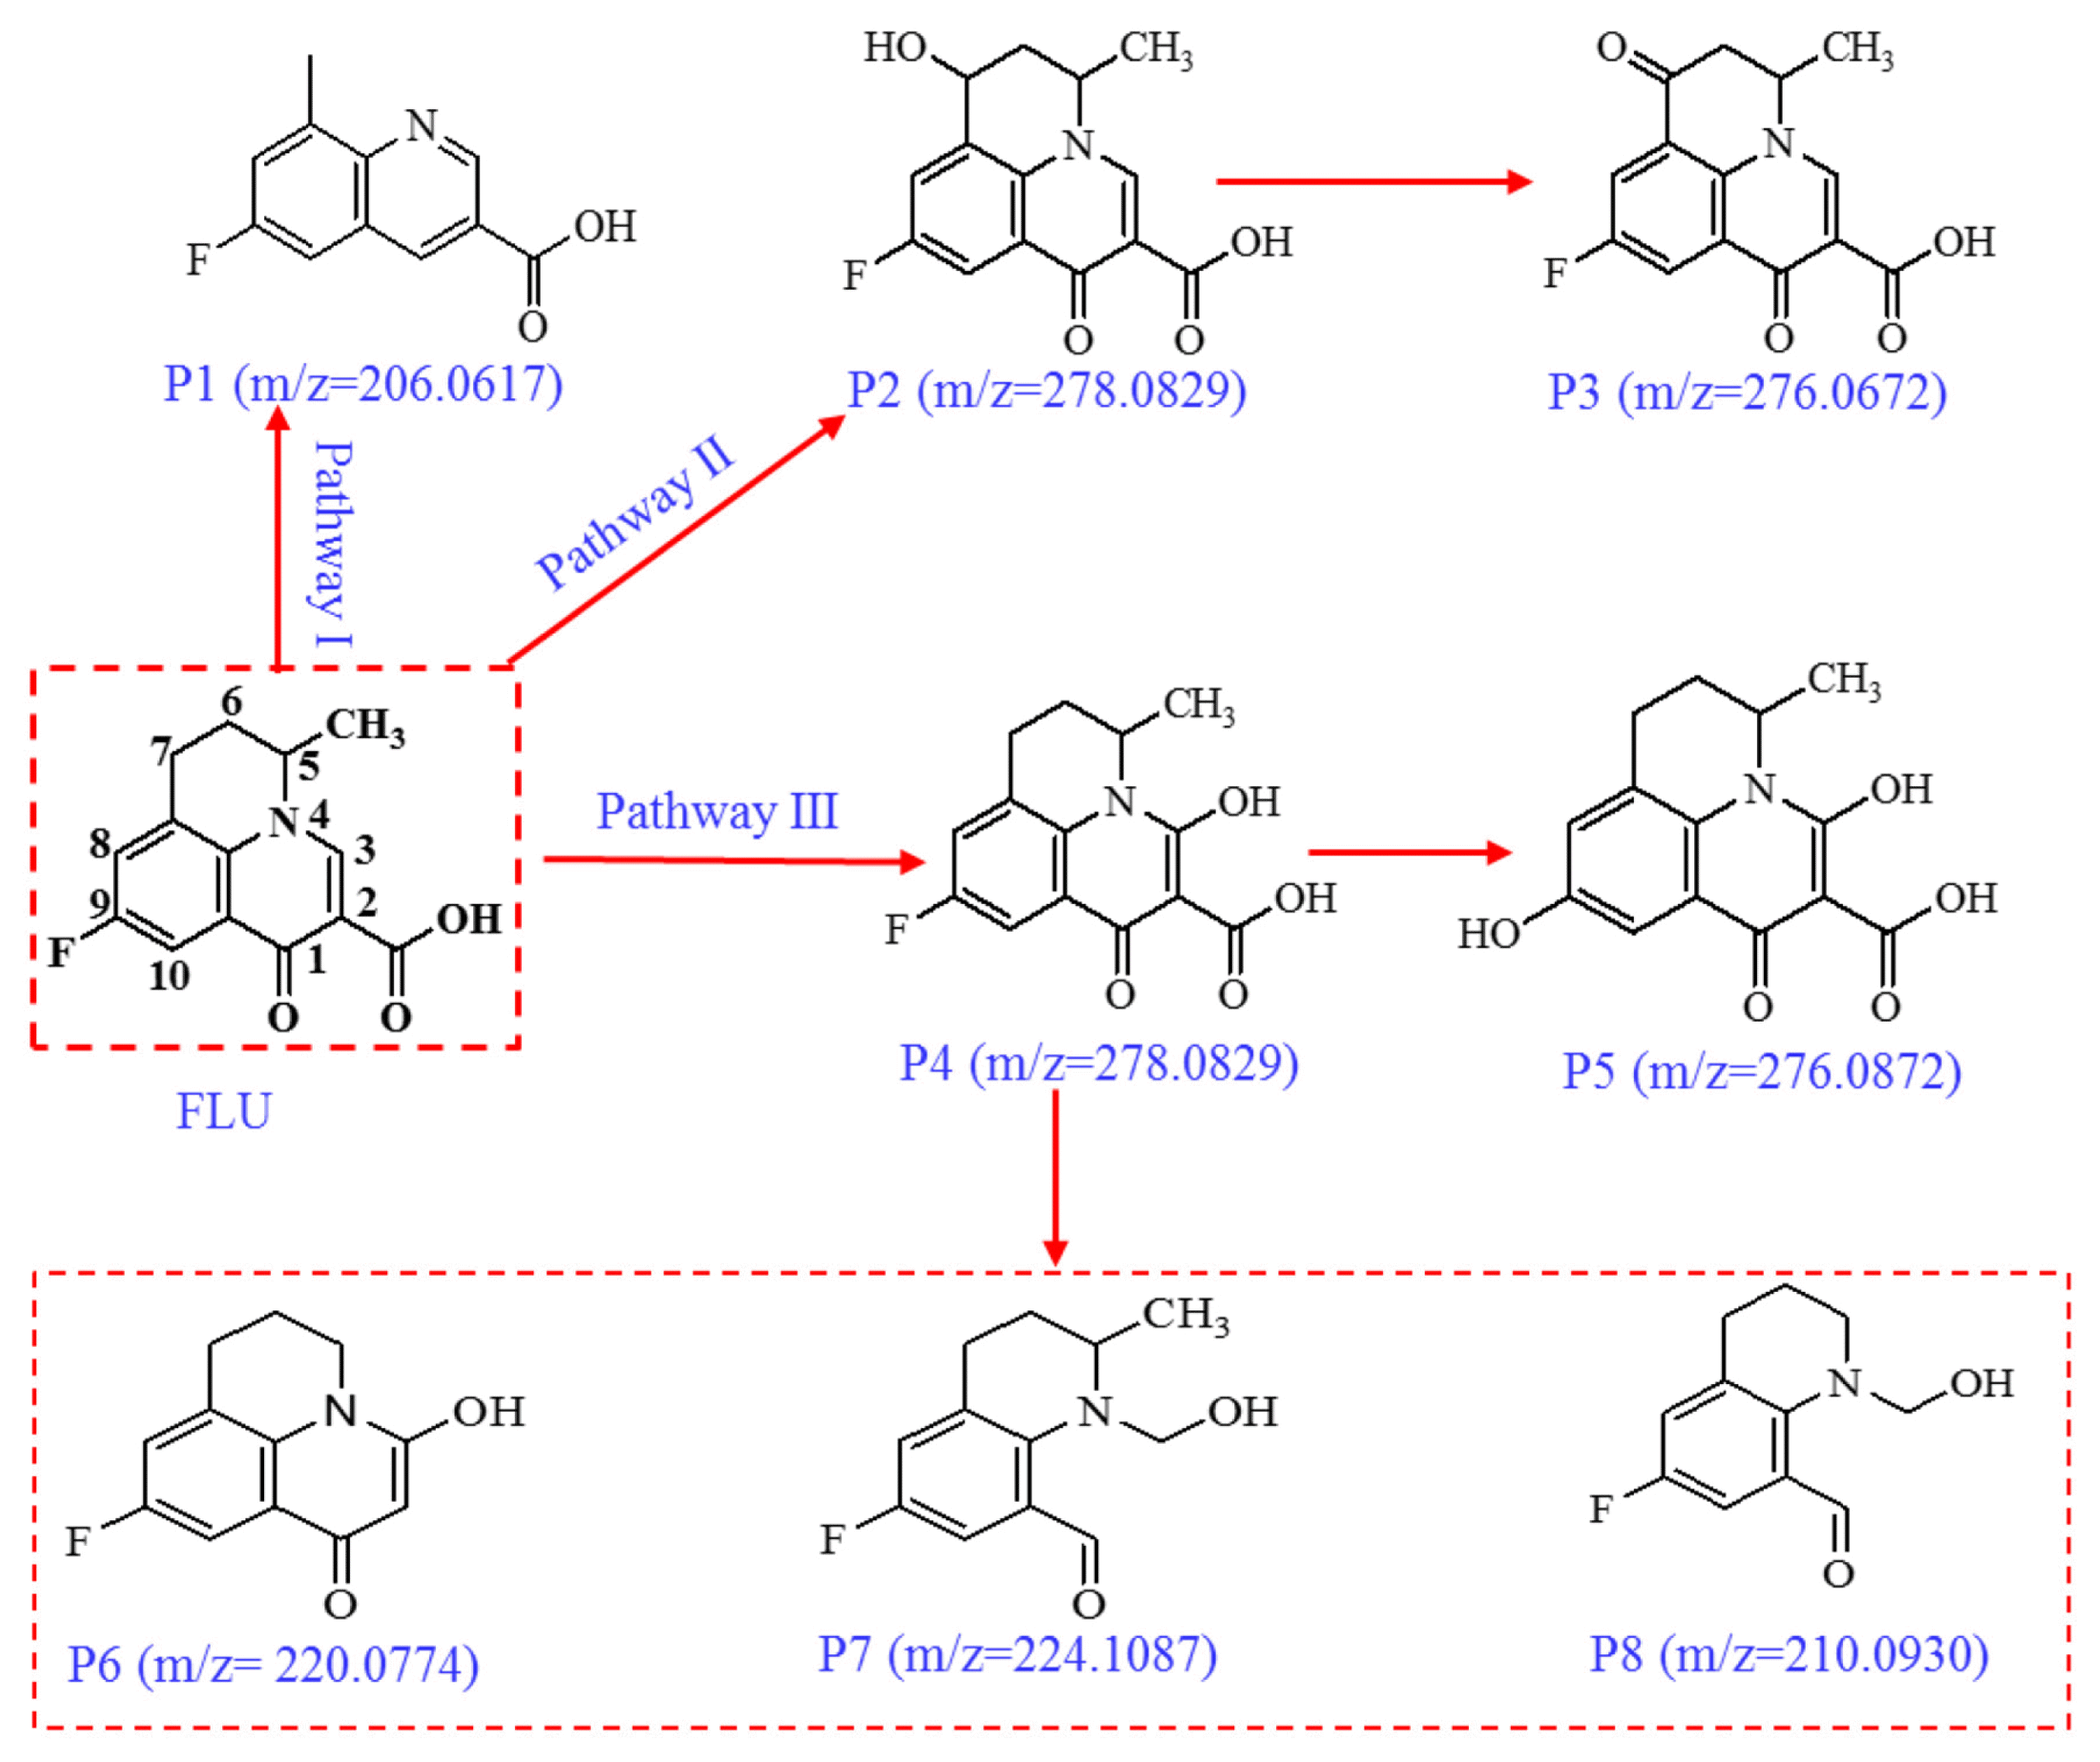
The primary intermediates for photocatalytic degradation of FLU were determined by employing the MS2 scan technique included in LC-TOF-MS. Based on MS data analysis, eight plausible degradation intermediates were detected in the positive mode. Fig. S2 indicates the proposed molecular structures of these intermediates and their fragmentation patterns. Table S1 summarizes their MS data and corresponding retention time. It can be found that small errors exist between the calculated and experimental m/z for these suggested molecular formulas. Therefore, the structural assignment for these intermediates is highly reliable, which makes it possible to propose the pathways for photocatalytic degradation of FLU.
Three plausible pathways for photocatalytic degradation of FLU employing TiO2/AN as photocatalyst were proposed based on the geometric structures of the identified degradation intermediates and displayed in Fig. 8. In the first pathway (pathway I), a propane molecule was removed from the upper saturated heterocyclic ring, resulting in formation of the degradation intermediate P1, which occurs most probably due to attack of h+ on the saturated ring of FLU. The intermediate P1 was also detected in the previous report on direct photolysis of FLU in water [44]. The next pathway (pathway II) was initiated by the attack of •OH at C7 position of the saturated ring, leading to the formation of hydroxylated intermediate P2. The subsequent hydrogen abstraction of P2 produces another intermediate P3. The intermediates P2 and P3 were also found in the recent study on oxidative degradation of FLU using K2FeO4 as oxidant [45]. The third pathway (pathway III) was also triggered by •OH attack, but the attack position is most likely to be on the C3 atom of FLU according to the theoretically calculated electron densities of FLU and our previous research [36, 45], and the resultant intermediate P4 is the isomer of P1. Subsequent substitution of fluorine atom by •OH may occur for P4, resulting in the formation of dihydroxylated intermediate P5. In addition, P4 can also undergo further decarboxylation, demethylation, the opening of the quinolone ring or their combination to yield the intermediates P6, P7 or P8, respectively. The intermediates P4, P6, P7 and P8 were also identified in a recent report [45]. It should be noted that the above decarboxylation processes are likely to occur by a photo-Kolbe pathway with the direct participation of h+ as shown by the reaction (RCOO− + h+ → RCOO• → R• + CO2), while the opening of the quinolone ring may be initiated by the attack of superoxide radical (O2•−) on the C2–C3 double bond of the quinolone ring.
3.6. Toxicity Evaluation
The ECOSAR program [46] was used to predict acute and chronic toxicities of FLU and proposed degradation intermediates (P1~P8) to fish, daphnids and green algae, and the results are summarized in Table S2. It should be noted that the predicted toxicity data of P1 were marked with “*” in the output result, suggesting that it might be too insoluble to predict the toxicity effect. Therefore, the predicted toxicity data of P1 are not listed in Table S2. It can be seen from Table S2 that FLU has chronic toxicity to three test organisms (1 mg L−1 < ChV ≤ 10 mg L−1) according to the Globally Harmonized System of Classification and Labelling of Chemicals, while the degradation intermediates of FLU don’t show toxicity in general. Thus, NH4NO3-doped TiO2 could be employed as an adequate catalyst for the photocatalytic degradation of FLU in water and wastewater.
3.7. Comparison with Previous Studies
The photocatalytic degradation of FLU in the aqueous phase have been investigated employing commercialized or modified TiO2 photocatalysts [8, 35, 47–49]. A comparison for photodegradation of FLU between the present study and these reports was made and is displayed in Table S3. The degradation efficiencies of FLU in these researches using pure anatase TiO2, thiourea-TiO2, urea-TiO2, graphene-TiO2 or TiO2/ZnO/Sepiolite catalysts were found to be in the range of 55~100% in 60~240 min of solar-simulated irradiation or UV irradiation, and the TOC removal efficiencies ranged over 35.8~74%. While in the present study, the efficiencies for FLU or TOC removal reached 100% or 81.2 % respectively after 4 h of irradiation. In general, the results of this study are comparable to literature studies.
4. Conclusions
In this study, three N-doped TiO2 photocatalysts were synthesized by a simple two-step method using Ti(SO4)2 as Ti source and CO(NH2)2, NH4Cl or NH4NO3 as N source, respectively. The XRD and XPS observation confirmed the incorporation of NO3− ions into the lattice of TiO2 in TiO2/AN sample. The TiO2/AN catalyst exhibited the highest photocatalytic performance in the photocatalytic degradation of FLU under simulated sunlight irradiation and the mineralization rate of FLU reached 81.2 % after 4 h of irradiation. The quenching experiments showed that the active species playing an important role in the photocatalytic degradation of FLU are h+ and •OH. Hydroxylation, decarboxylation, demethylation, ring opening and fluorine substitution were several main degradation patterns for FLU in water. The intermediates for photocatalytic degradation of FLU involving TiO2/AN catalyst show relatively lower toxicities to fish, daphnids and green algae than FLU generally. Further research on the photocatalytic degradation of other fluoroquinolone antibiotics using TiO2/AN catalyst is currently underway. Moreover, the use of more other nitrogen sources to prepare N-doped TiO2 catalysts with high activity and stability is also under consideration.