1. Introduction
The water resources contamination with arsenic (As) has been studied worldwide [1, 2]. Due to severe health concerns associated with arsenic polluted water, maximum contaminant level was changed from 50 to 10 ppb in 2001 by United States Environmental Protection Agency (EPA) [3]. Therefore, arsenic removal from water is getting more attention to combat health related issues and environmental problems as well. Several techniques including membrane separation techniques including nanofiltration and reverse osmosis were used to eliminate 90–95% of arsenic from water but at high pressure achieved by high energy consumption[4, 5]. Although ultrafiltration (UF) requires less energy and runs at lower pressures but low molecular weight pollutants cannot be removed without enhancing their size. In micellar enhanced ultrafiltration (MEUF) technique, surfactant addition is required to form micelles of dissolved aqueous pollutants above their critical micelles concentration (CMC), and consequently removed by UF. Researchers studied this technique, because of its higher removal efficiency and lower energy consumption [6–8].
The MEUF process can be mostly influenced by various operating parameters, so, there is a need of hour to explore the effect of those variables to evaluate the process performance. In literature, effect of various operating parameters including, molecular weight cut-off (MWCO), As concentration and pH of feed solution, molar ratio of surfactant to arsenic, membrane material, types of surfactants and other co-occurring inorganic solutes on the removal efficiency (RE) of arsenic was investigated experimentally, [9–11]. Previously, most of the MEUF process optimization studies were conducted by considering one-parameter-at-a-time during experiments that is an expensive and time-consuming strategy. Therefore, artificial neural network (ANN) modeling appears as an alternative technique for optimization and control of MEUF process [12]. ANN networks are capable to store and process the information with distributed memory without empirical studies of the process and after learning they can make decision by commenting on similar events as literature studies showed their applications in various environmental engineering systems [13–16].
In literature few studies were conducted for MEUF process optimization using different modeling techniques. The As removal from aqueous solution through MEUF using binary system ion-exchange model presented that predictied and experimental results were well agreed [5]. Assessment of MEUF performance and influence of operational pareametrs for removal of pharmaceutical contaminants from wastewater was made successfully by applying a statistical experimental design, response surface methodology [17, 18]. The removal of zinc from wastewater through MEUF was modeled effectively using ANN modeling technique [12] and RSM was employed to improve the separation process of cadmium and zinc [19]. The flux decline for eosin dye separation was quantified using resistance in series model [20], fuzzy modeling and simulation for lead removal provided acceptable results for MEUF optiminzation [21].
MEUF optimization using experimental, and ANN modeling techniques for As removal from aqueous solution was not found in the literature as per author’s knowledge. In this study experimental dataset was used to evaluate the As RE of MEUF process from aqueous solution. The experimental studies were carried out by varying operational conditions such as time, pressure, molar ratio of CPC to As, As concentration and pH of feed solution. The aim of this study was to propose the best model for MEUF process optimization that can provide an economical, fast and environmental friendly alternate to the expensive and laborious experiential work.
2. Material and Methods
2.1. Materials and Design of Experiment
Sodium arsenate (Na2HAsO4.7H2O) with purity of 99% was purchased from Junsei Chemicals, Japan. The cationic surfactant was cetylpyridinium chloride (CPC) 98% pure was procured from DAEJUNG CHEMICALS & METALS, South Korea with purity of 98%. The pH adjustment and cleaning process was performed using chemicals including, sodium hydroxide beads with assay above 97% and hydrochloric acid with purity above 35% were also obtained from DAEJUNG CHEMICALS & METALS, South Korea. Polyacrylonitrile based cross flow UF membrane with 0.055 m2 effective surface area and 10 kDa MWCO used in experiments was procured from SYNOPEX MEMBRANE FILTER, South Korea and 5 micron cartridge filters were also obtained from the same supplier. The characteristics of UF are presented inn Table 1. ACF made of carbon impregnated pleated polyester was purchased from 3M Company, China. The deionized water was used during experiments, including solutions preparation and cleaning process.
The schematic drawing of lab-scale MEUF system is depicted in Fig. 1, which comprises of (1) mixer, (2) feed water tank, (3) valve, (4), (5) feed and cleaning pumps, respectively, (6) UF, (7) reject water circulation (8) MEUF product water tank. A cross-flow type filtration was performed using UF where rejected solution is recirculated in to the feed tank, whereas, product water was collected separately. The pH of solution was measured by Multifunction meter CX-505, Elmetron, Poland. CPC was analyzed through UV/VIS spectrophotometer at 372 nm wavelength, while arsenic was measured using inductively coupled plasma-optical emission spectrometry ICP-OES technique (720-ES, Varian), US EPA Method 6010 at 1200W power, plasma gas flow 15 L/min, auxiliary gas flow 1.5 L/min, nebulizer gas flow 0.75 L/min. The cleaning of UF membrane was perfomed by using deionized water followed by 0.1 M NaOH solution, and reflushing with deionized water. Similarly, cleaning of membrane was performed with 0.5% HCl and flushed with distilled water. The RE of As was considered as measured response and calculated by using Eq. (1).
Cp and Cf are metal concentration in the product and feed water while RE represents percentage RE.
2.2. Experimental Data Preparation
The arsenic removal conditions were optimized by changing MEUF parameters; time (10–60 min), pressure (1.5–2.5 bar), molar ratio of CPC to As (3 to 10), As concentration of feed solution (1 to 3 Mm) and pH of solution (7 to 8.5). The data was obtained from an experimental work under aforementioned operating conditions for As removal from aqueous solution using MEUF technique. In ANN modeling time (T), pressure (P), molar ratio of CPC to As (CPC/As), arsenic concentration of feed solution (As) and pH of solution were considered as input parameters while As RE (0.55 to 0.99), was used as output parameter. The learning capacity of a model depends upon the size of training dataset. Experimental data contained 96 rows that were divided randomly into training (70%), validation (15%) and testing (15%) for ANN modeling. MATLAB R2017b was used for ANN modeling.
2.3. Artificial Neural Network (ANN) Modeling
ANN a black box technique is a computer based algorithm that processes the information similar to the nervous system of human body. Neuron is a central element that is used to receive, process, and transmit information after creation, and configuration of the network then after training, and validation, model can predict the target results [22]. In processing an input (x), is multiplied by a specific random value known as weight (w) and a bias value (b) is also added. A resulting input of a neuron is weighted input (xw) is that is summed up (n = xw + b) and then evaluated using a transfer function to provide final output [23]. The output values are compared with real values to find the difference between them as error that helps in weights and biases updation during training using appropriate learning algorithm to get the minimum error [24].
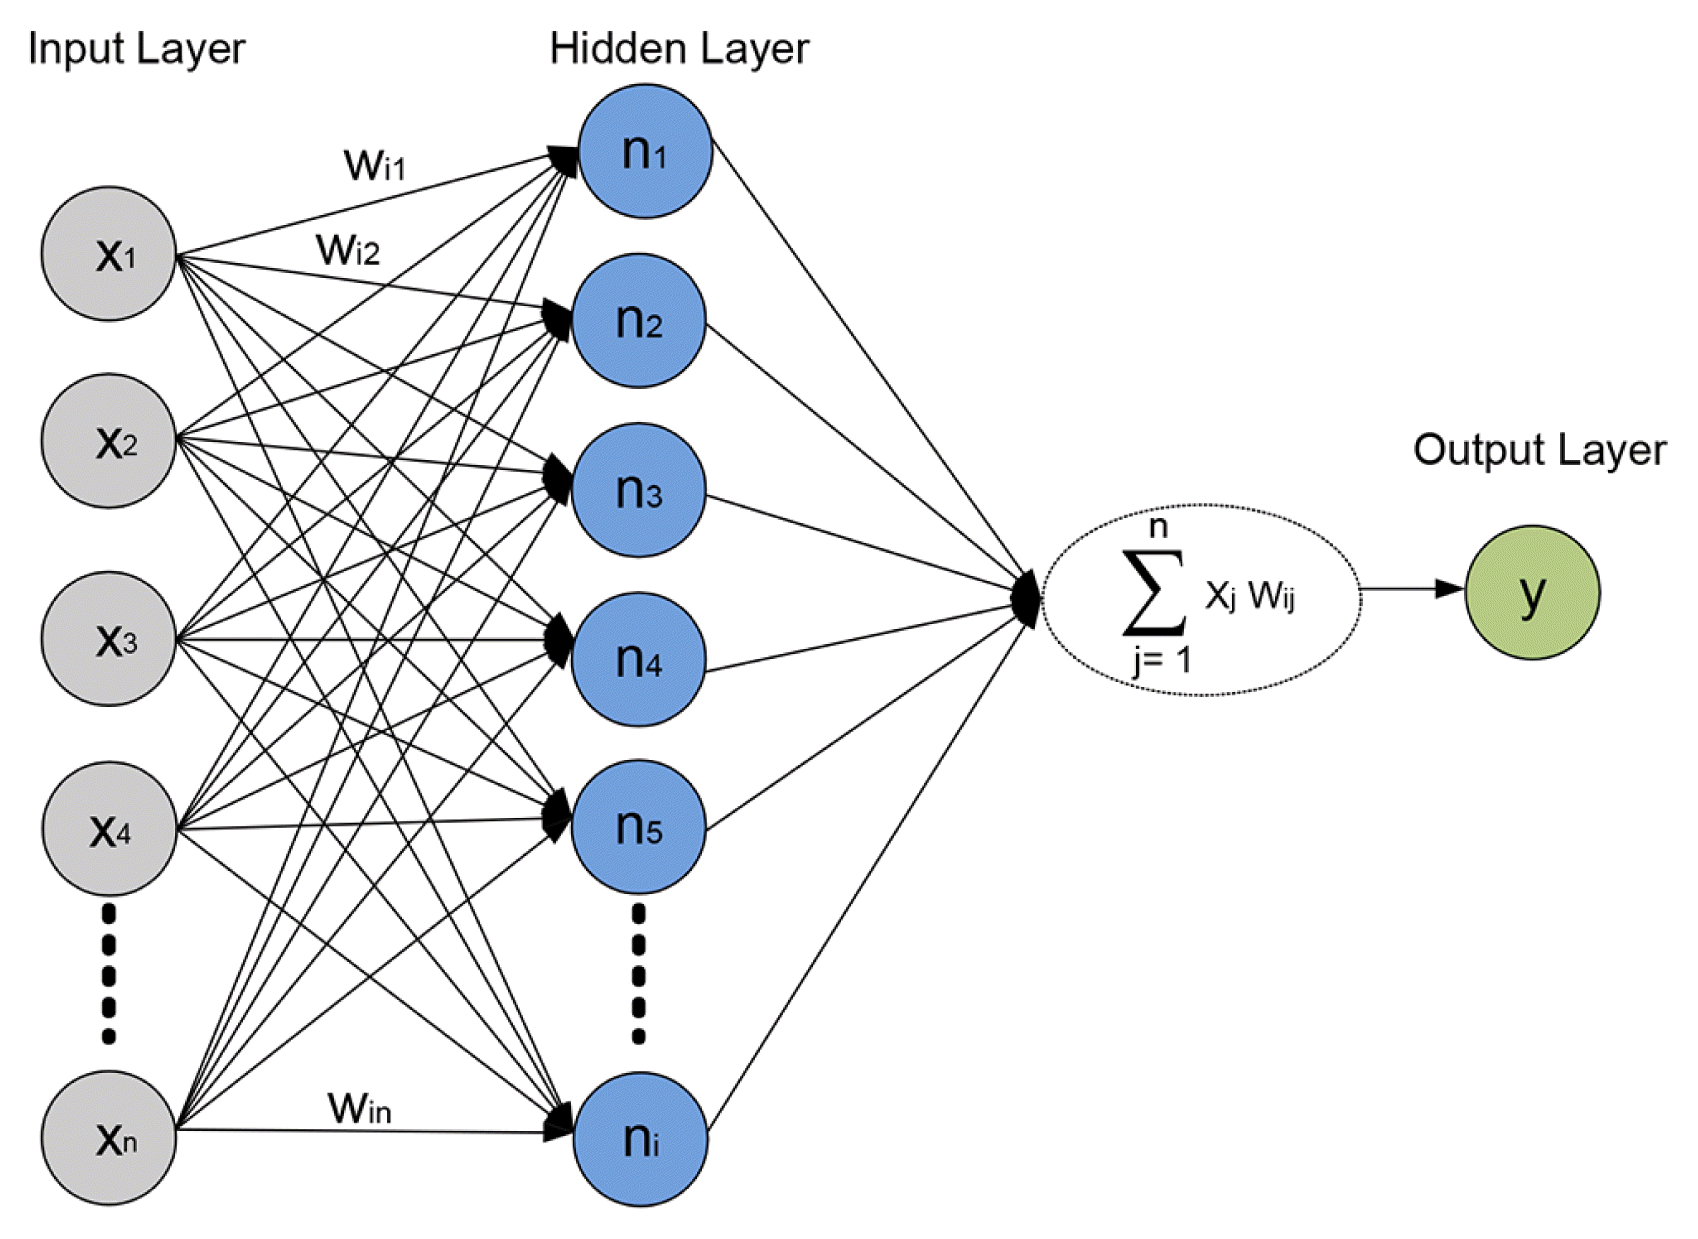
ANN is consisted of an input, hidden and output layer as shown in Fig. 2. The inputs are represented by x1, x2… xn and output by Y. Feedforward back propagation learning technique is commonly used because in this technique propagation of total loss back into ANN model minimizes the loss [25]. As modeling performed through different stages including training, validation and testing therefore, dataset was divided into three sets as mentioned. Initially proposed model was trained and validated using validation dataset in order to tune hyperparameters. Then proposed model used to test the performance of the trained network for unseen testing dataset.
2.4. Model Performance Criteria
In this study, two performance measures used to evaluate models predicted results. The mean square error (RMSE) Eq. (2) and coefficient of determination (R2) Eq. (3) were used as statistical values for evaluation of a model that are described below [13].
In these equations ‘n’ represents the number of experimental values and
and
presented model predicted and their corresponding experimental values, respectively.
3. Results and Discussion
The experimental studies were performed by considering each operating parameter one by one while others were kept constant. In the following section experimental and ANN modeling results are presented with respect to As removal from aqueous solution using MEUF technique.
3.1. Experimental Studies
3.1.1. Effect of pressure
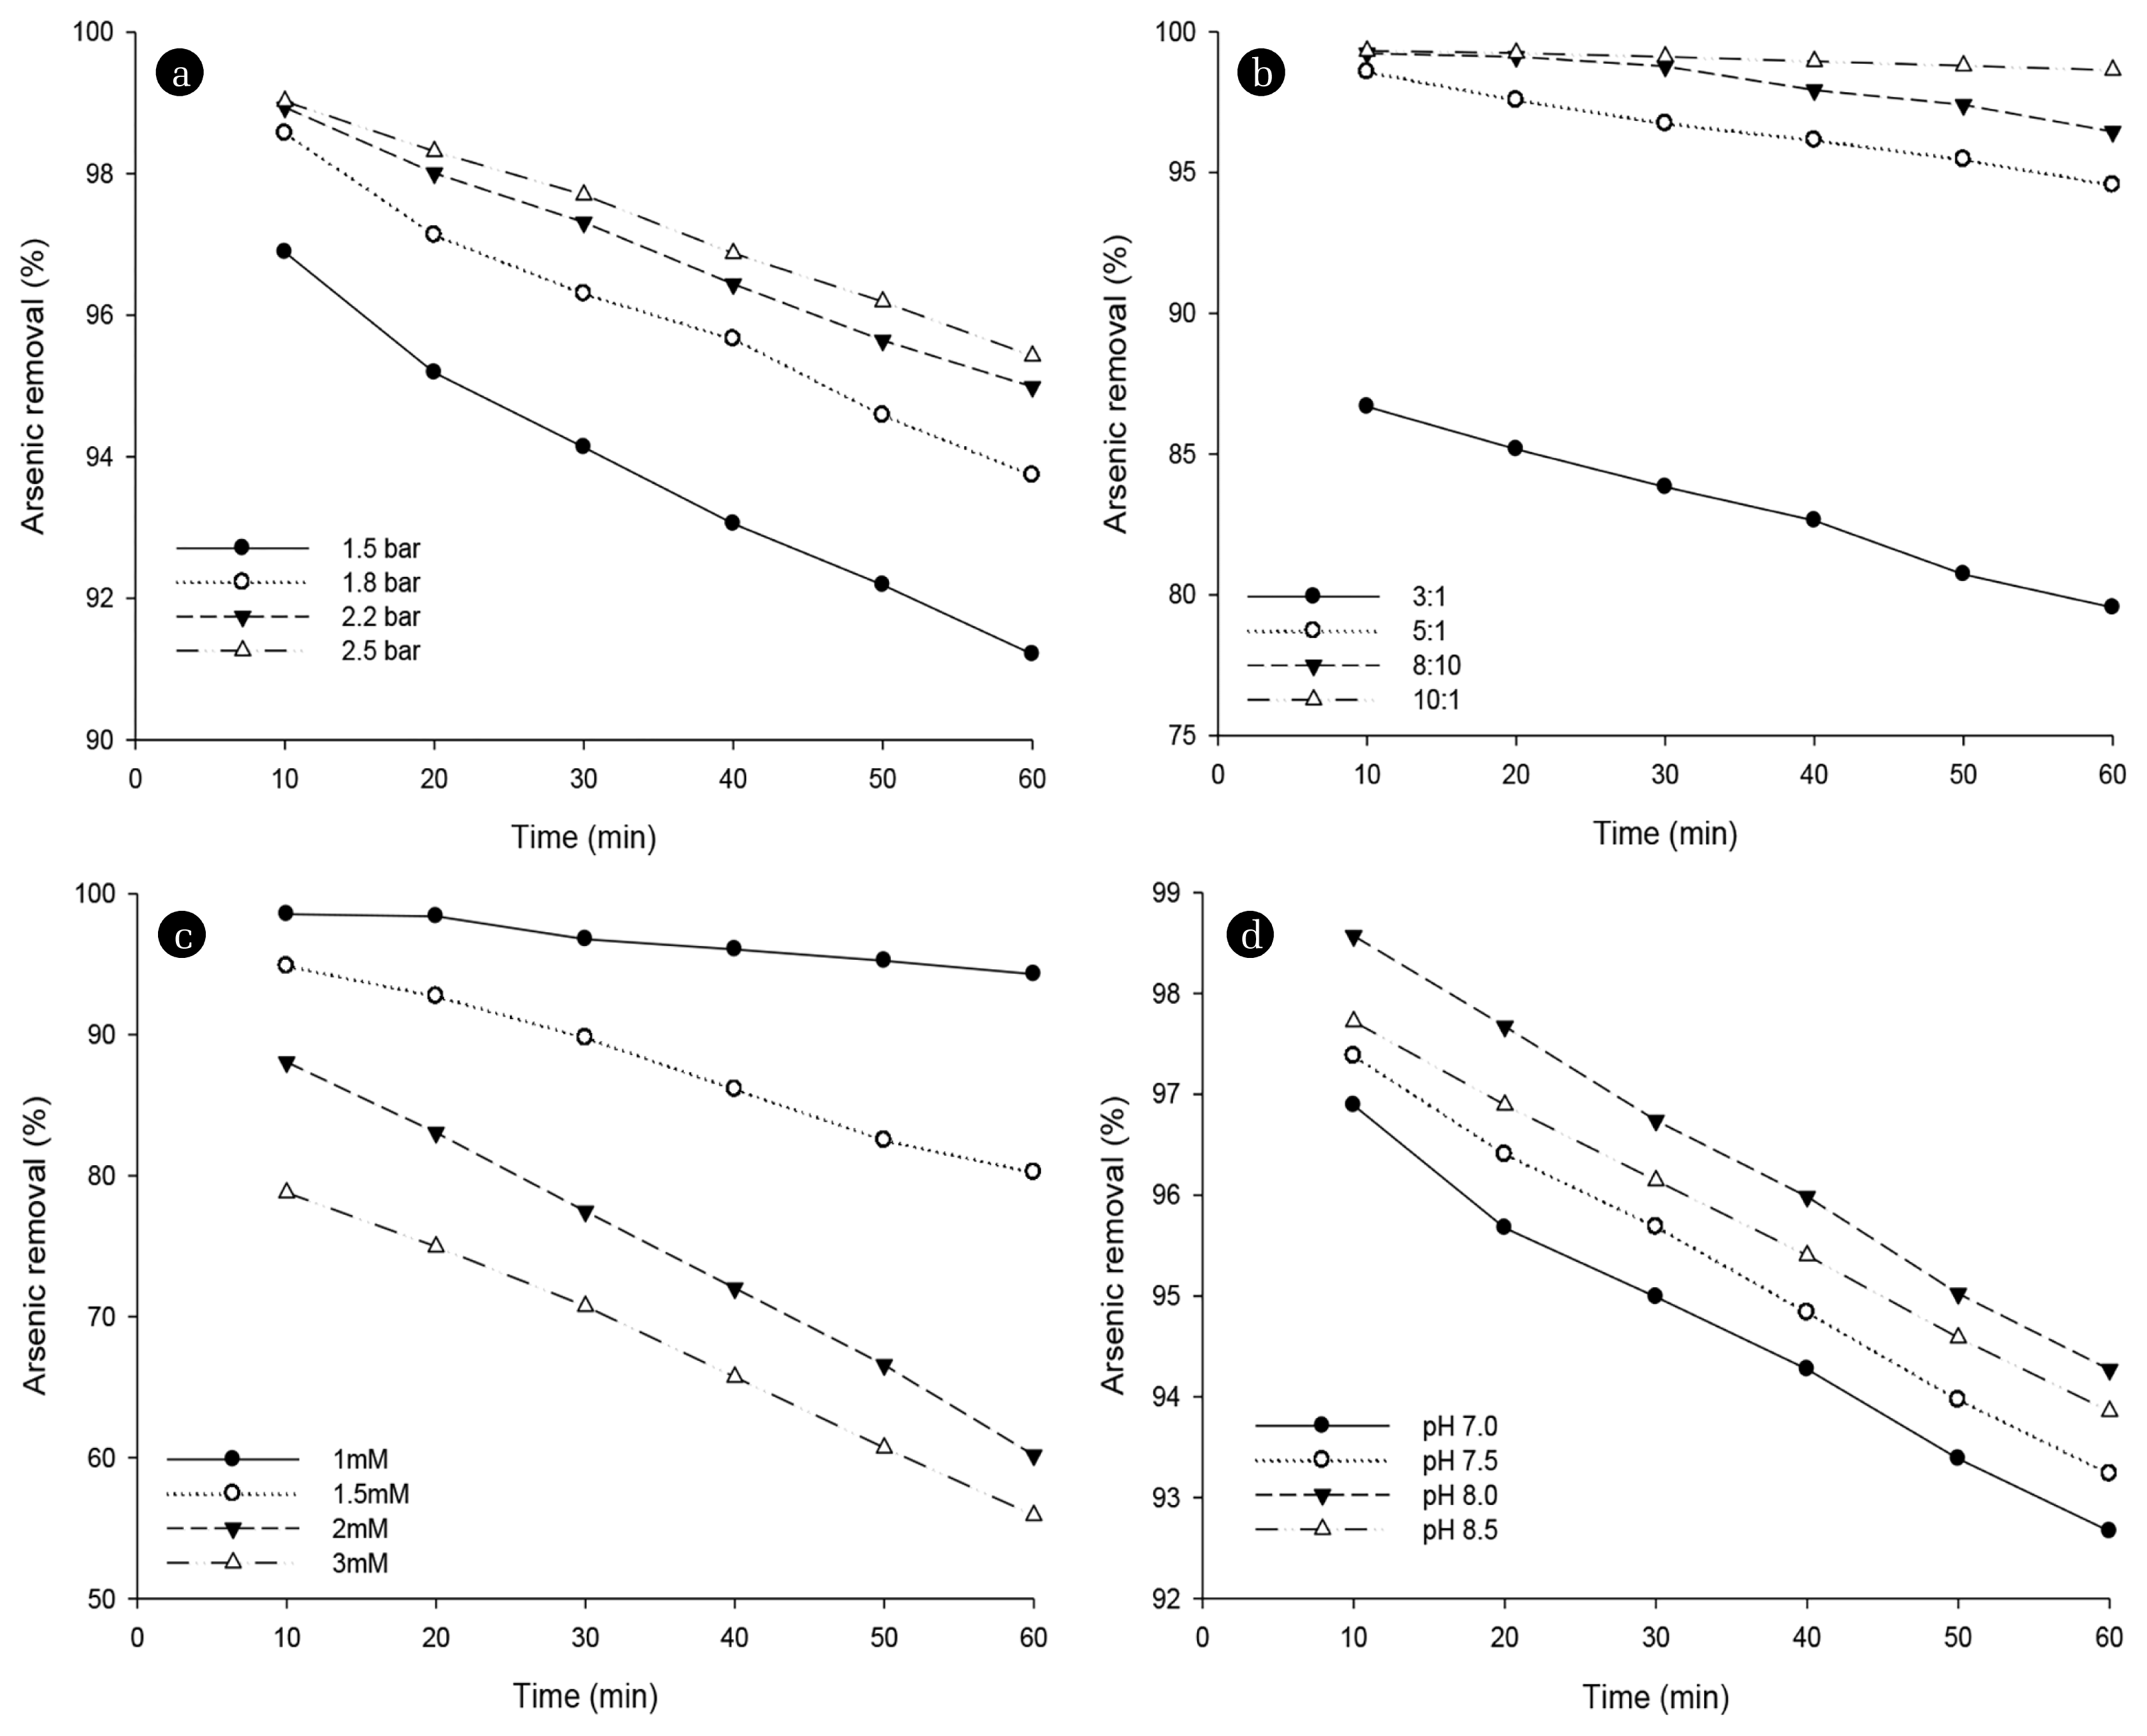
The experimental studies were tested for As removal from aqueous solution as presented in Table 2, these values of pressure were selected on the basis of previous studies [6, 26–29]. Average As removal percentage as shown in Fig. 3 (a) was 92.87, 96.13, 97.01 and 97.20% at pressure of 1.5, 1.8, 2.2 and 2.5 bar, respectively, at molar ratio of CPC to As 5:1. The similar results regarding effect of pressure were presented for other heavy metals including, chromate, nickel and cadmium removal from aqueous solution [26–29]. It is evident that high pressure causes to increase the gel layer thickness on membrane surface and eventually removal of metal micelle complex was higher. On the contrary, concentration polarization happens because of high pressure that results in reduction of permeate flux [26–29]. Experimentally observed optimum pressure was 1.8 bar for As removal from aqueous solution at molar ratio of 5:1 without any adjustment of pH.
3.1.2. Effect of molar ratio of CPC to arsenic
Number of experiments were performed to investigate the effect of molar ratio of CPC to As at fixed pressure as evaluated previously. As presented in Fig. 3 (b), average removal of arsenic was 99.00, 98.15, 96.51% for a molar ratio of 10:1, 8:1, 5:1, respectively but at molar ratio of 3:1 average arsenic rejection was dropped to 83.09%. An improvement in As removal was noted corresponding to an increase in CPC to As ratio. This improvement occurred due to more micelles formation at higher CPC concentration, which increases the available micelle surface area for attracting arsenic ions electrostatically. Previously done studies supported these results [26–30]. The optimum molar ratio was noted as 5:1 that provides 96.13% average removal of arsenic at 1.8 bar pressure without any pH adjustment.
3.1.3. Effect of initial arsenic concentration
Experiments were conducted using different As concentrations of feed solution such as 1, 1.5, 2 and 3 mM at CPC concentration of 5 mM. In this case average As RE was 96.12% for 1 mM concentration of As while 87.25%, 74.55% and 67.80% rejection was found for As concentration of 1.5, 2 and 3 mM, respectively as presented in Fig. 3(c). Arsenic removal decreases with increasing As concentration of feed solution [11, 30, 31] and similar trend for other heavy metals including cadmium, chromium and nickel was presented in the literature [28]. The concentration of arsenic in product water was increased proportionally to As concentration of feed solution because lesser micelle surface area was available to adsorb higher metal concentrations electrostatically [26]. The 1 mM initial arsenic concentration was found optimum as it provides higher RE of arsenic 96.12% while other parameters were kept constant.
3.1.4. Effect of pH on arsenic removal
Series of experiments were performed to explore the effect of pH on As removal from aqueous solution. It was observed that arsenic removal was slightly increased by pH up to 8.0 as in Fig. 3 (d), but above that no increase in As RE was observed. As previously reported that As(V) species were found neutral at pH 1.0 while between pH 2.22 to 6.98, they change from neutral to mono-anionic form. Further, at a pH value of 6.98, mono-anionic to di-anionic dissociation happened. Hence, maximum As removal takes place at pH value of 8, due to the likely binding of di-anionic arsenate to the micelles [9, 11].
The removal of As is proportional to the pH value of feed solution. At lower pH, As has to compete with H+ ions during adsorption onto the micelles surface. Therefore, in the acidic environment, adsorption of As onto the micelle surface was decreased that ultimately reduces RE as similar results presented in the literature for cadmium and copper removal [28, 29]. On the other hand, binding of functional groups with H+ at higher pH easily dissociated, and the deprotonated functional groups can bind with arsenic [9, 11]. Consequently, the influence of pH dependent on the type of metals and categorically on the competiotion between metal and H+ ions during adsorption onto the micelles.
3.1.5. Experimental results discussion
During experimental studies of MEUF process at various operating parameters, it was noted that optimum conditions for As removal from aqueous solution were found as pressure of 1.8 bar, CPC to As molar ratio was 5:1, As concentration of feed solution of 1 mM at pH 8.0. The experimental optimization of MEUF required much time, expensive, laborious work and hazardous to the environment as used chemicals were drained to wastewater stream. Resultantly, it is need of hour to find an alternate to minimize experimental studies to make future studies easier and more reliable for optimization of such type processes. For this purpose, ANN studies were considered for modeling of MEUF process used for As removal from aqueous solution as described in below sections.
3.2. ANN Modeling Results
3.2.1. Pre-assessment of experimental data
The As removal conditions were optimized by changing MEUF parameters; time (ranges 10–60 min), pressure (ranges 1.5–2.5 bar), molar ratio of CPC to As (ranges 3–10), As concentration of feed solution (1–3 mM) and pH of solution (7 to 8.5). The data was obtained from an experimental work under aforementioned operating experimental conditions for As removal from aqueous solution using MEUF technique. In ANN modeling time (T), pressure (P), molar ratio of CPC to As (CPC/As), arsenic concentration of feed solution (As) and pH of solution were considered as inputs and output was the RE of As. The learning capacity of a model depends upon the size of training dataset. Experimental data contained 96 rows of which randomly 68 were selected for training, 14 rows were used for validation and 14 rows chosen for testing in ANN modeling.
3.2.2. Topology of ANN model
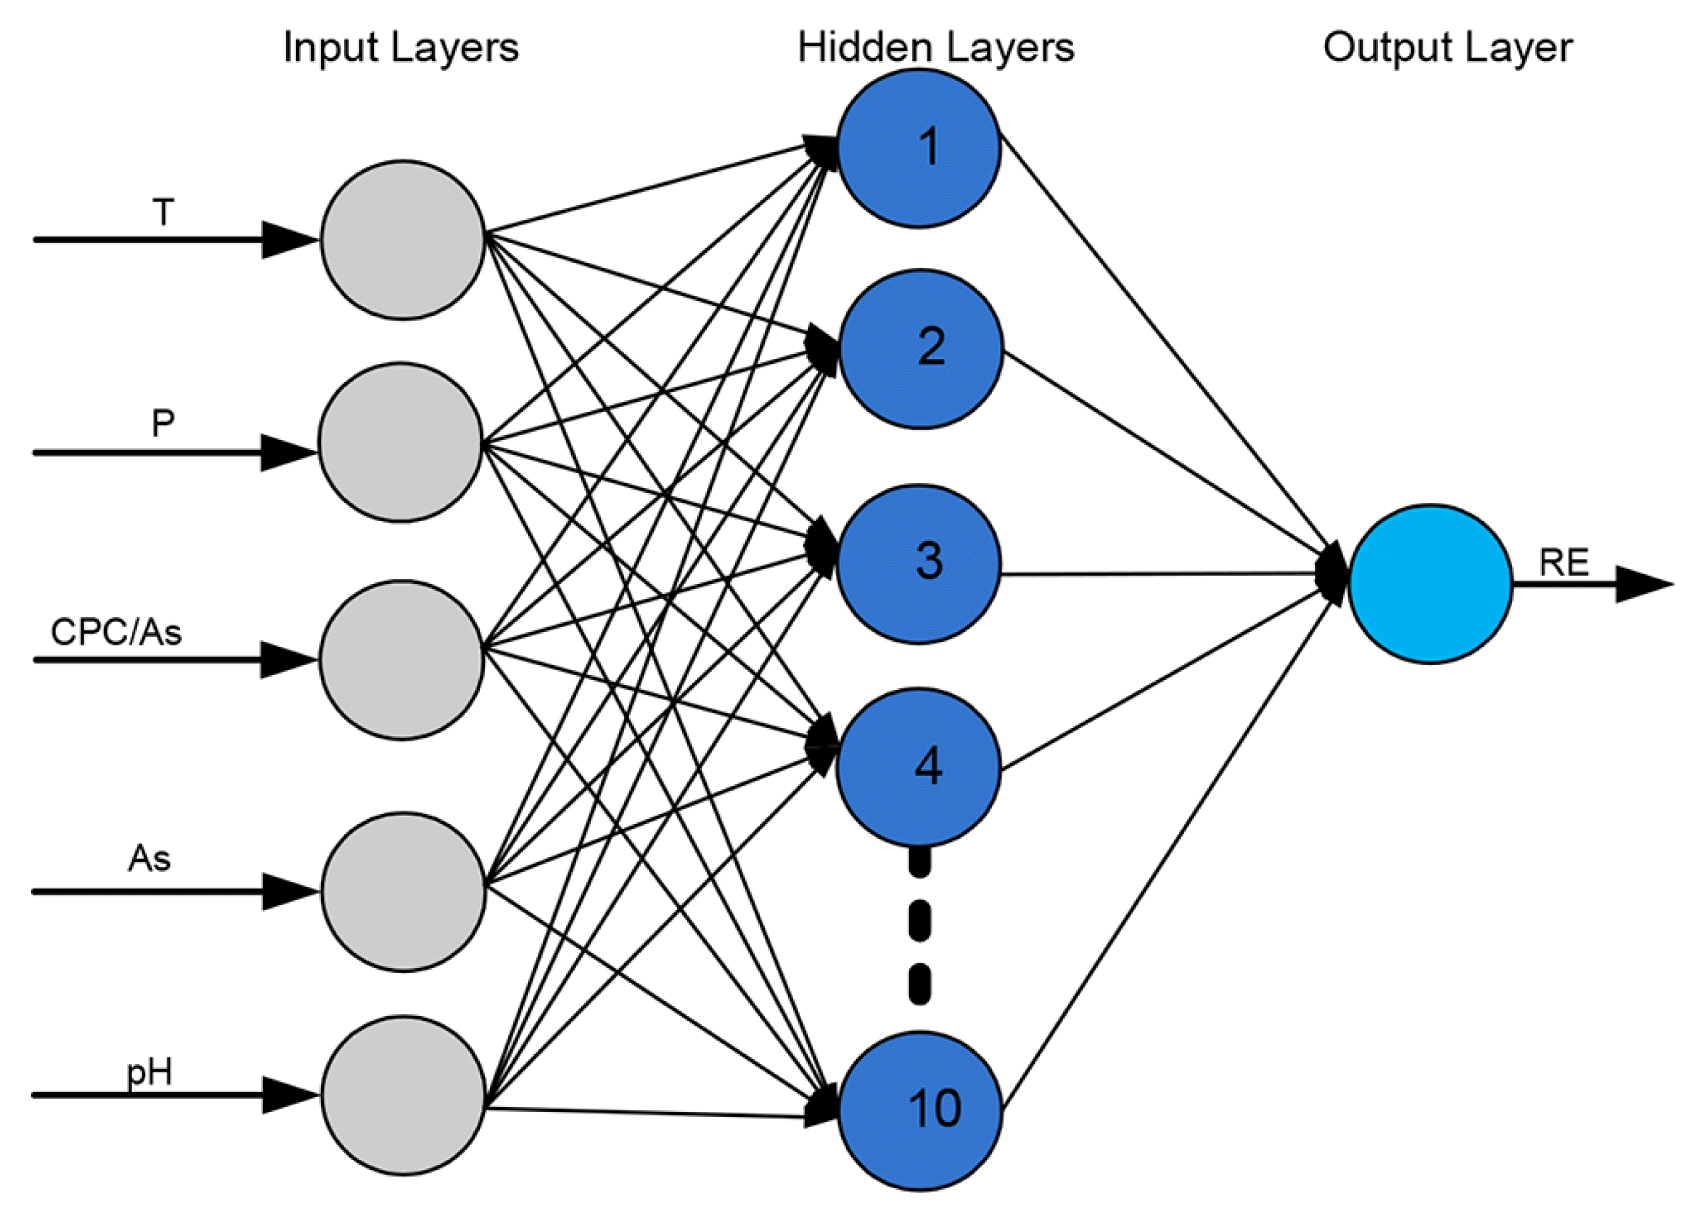
The number of neurons in the hidden layer were varied from 2–50 to find optimum number of neurons. Each topology was checked thrice using RMSE values as performance criteria. ANN models provided the best results by using Levenberg-Marquardt algorithm with 10 neurons in the hidden layer. Through trial and error method, it was noted that (5-10-1) is the best ANN topology as presented in Fig. 4. The optimal architecture of ANN for best prediction of As removal using MEUF process from aqueous solution was observed by considering 5 variables input layer; 10 neurons in a hidden layer; and one variable output layer (5-10-1).
3.2.3. ANN model prediction results
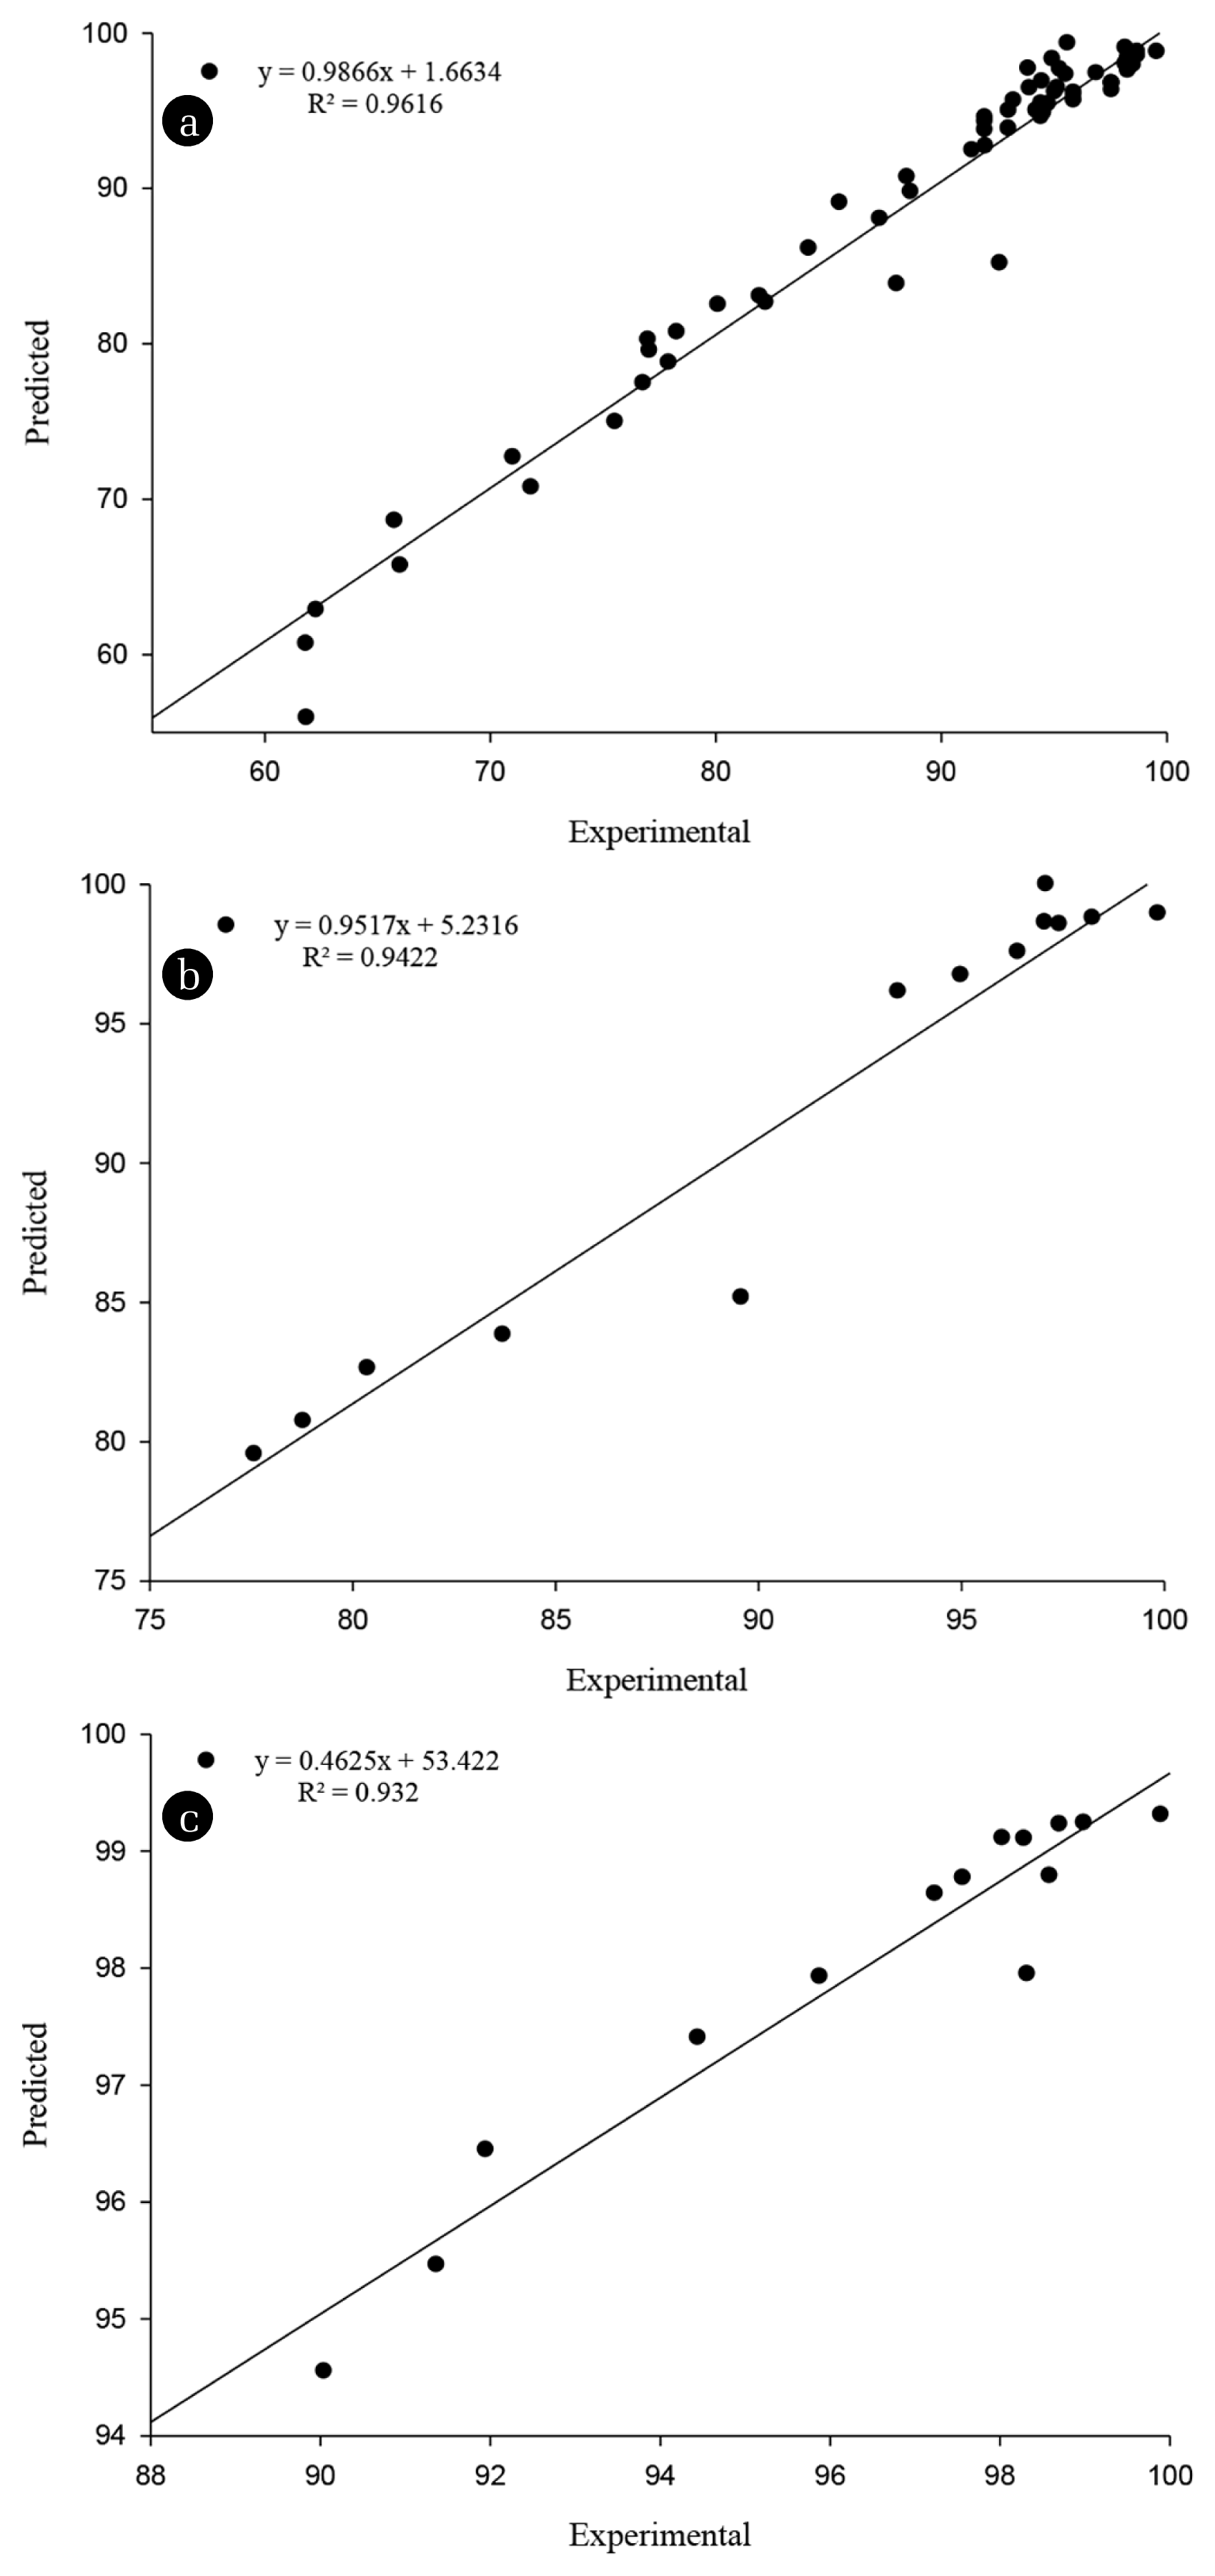
ANN model prediction results were evaluated on the basis of performance criteria parameters such RMSE and R2. The R2 values provided information on general error between experimental and model prediction results. The good fit between measured and predicted values is improbable to occur, would have R2 = 1 [13].
The experimental and ANN model predicted results are presented in Fig. 5. It depicts that ANN model predictions are close to the experimentally measured results; thus, proposed ANN model might be an alternate to laborious, expensive and environmentally hazardous experimental method used for optimization of MEUF process. The proposed ANN model presented very good results with R2 = 0.932 for testing dataset. The consistency between the ANN predictions and experimentally measured results may increase the reliability of proposed ANN model for the prediction of As removal from aqueous solution. The results indicated that ANN model can be used to predict As RE of MEUF process without any empirical study that acquires long time and an expensive option.
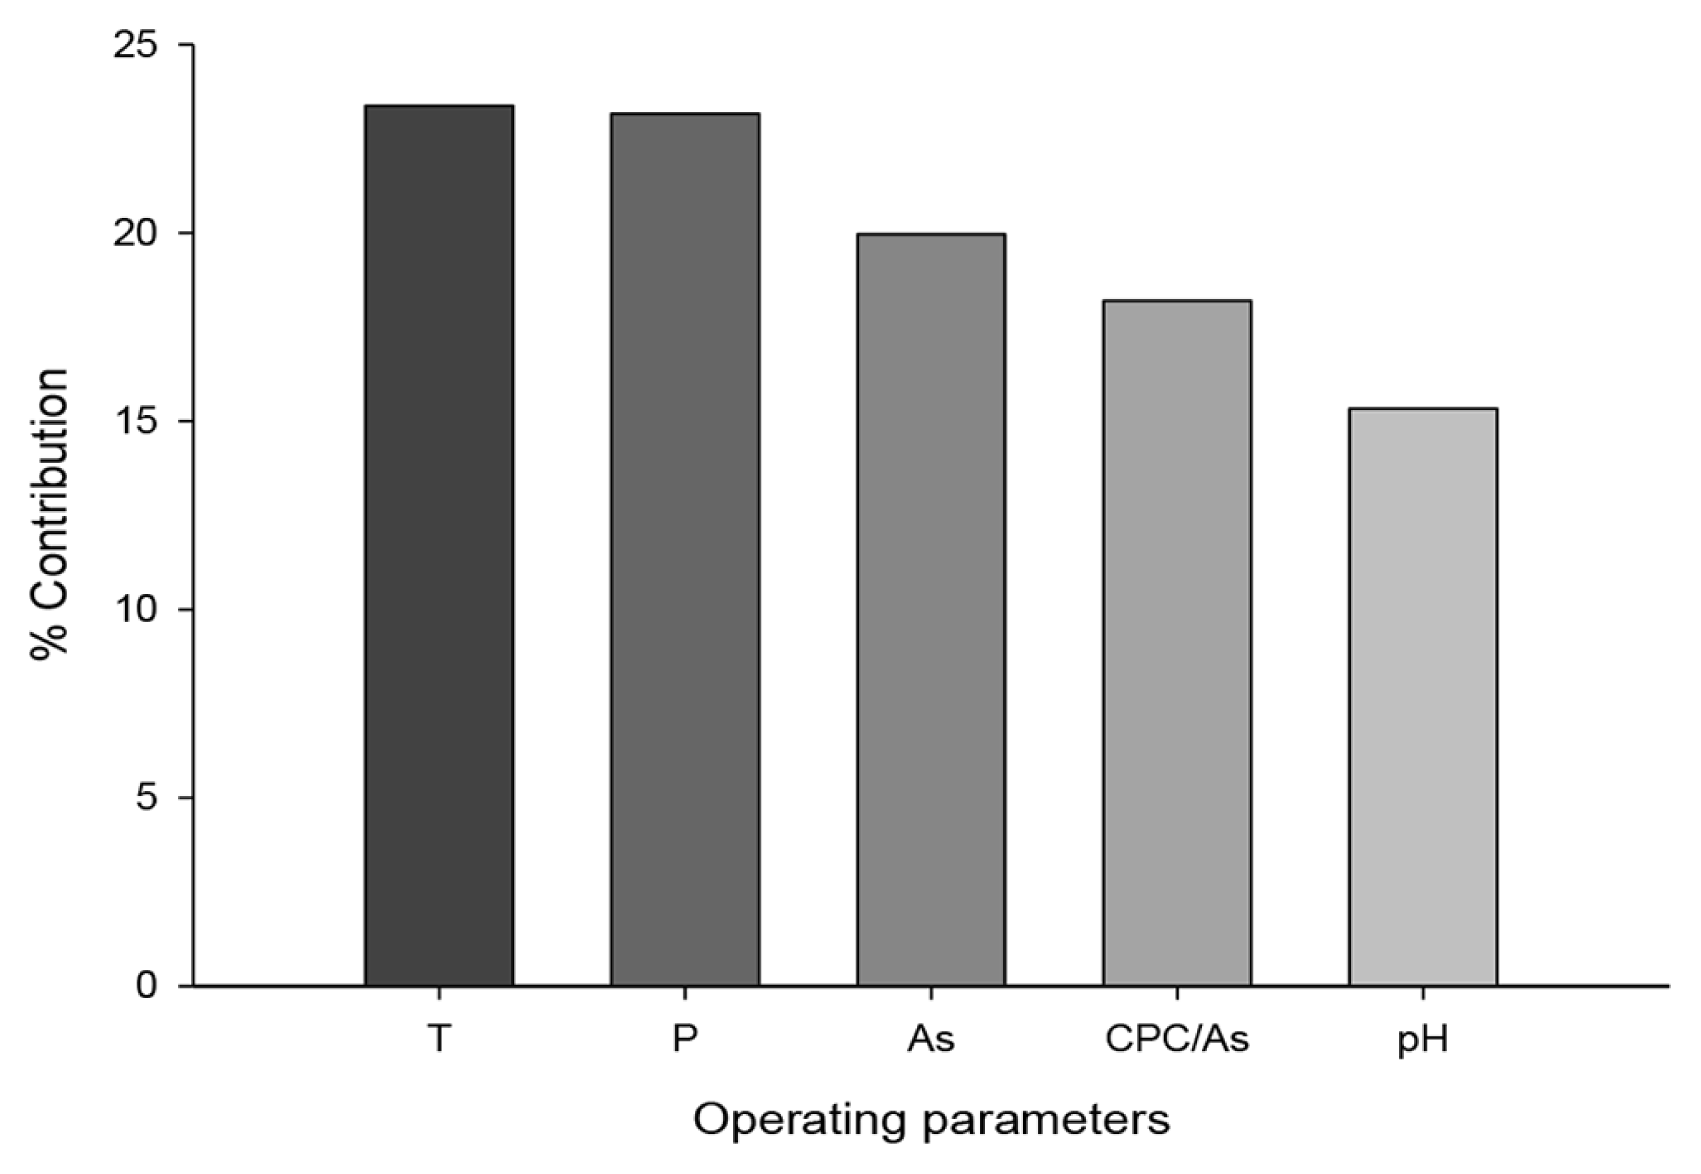
A percentage contribution was performed to check the significance of operating parameters including time (T), pressure (P), As concentration of feed solution (As), molar ratio of CPC to As (CPC/As) and pH. It was noted that all considered operating parameters were significant in this MEUF study for As removal from aqueous solution as shown in Fig. 6, including, time, pressure, As concentration of feed solution, molar ratio of CPC to As and pH were significant for this study as noted, 23.37%, 23.16%, 19.96%, 18.19 and 15.33%, respectively. Although time and As concentration of feed solution showed relatively high significance than other operating parameters but does not have a prominent importance as compare to other parameters. In further studies even more operating parameters can be considered for better understanding of MEUF process for As removal from aqueous solution.
4. Conclusions
Micellar enhanced ultrafiltaion of As-contaminated aqueous solution through experimental and ANN modeling techniques was investigated. Optimum parameters for As removal from aqueous solution were noted as pressure of 1.8 bar, CPC to As molar ratio was 5:1, As concentration of feed solution 1 mM at pH 8.0. The proposed ANN model successfully traced the behavior of As RE versus time, pressure, As concentration of feed solution, molar ratio of CPC to As and pH value. The predictive capability of the ANN model (R2 = 0.932 for testing dataset) was comparable with experimental results. The proposed ANN model might be an alternate to the laborious, expensive and environmentally hazardous experimental methods used previously for the optimization of MEUF process. Results indicated that a well-trained ANN model can be used to optimize As RE of process without any empirical study. Percentage contribution confirmed that all the operating parameters are important in MEUF process. Hence, we can recommend the extension of ANN model to other ultrafiltration applications for further insight where only tuning of the hyperparameters can be helpful to trace the input-output relationship of complex processes.


