1. Introduction
A combined sewer is one in which the sewer system is used to transfer, and to eliminate, sewage and rainfall. The ratio of the combined sewers of the national total of sewers is about 46%, by the year 2009 [1]. During a rainfall, the flow rate increases in the combined sewer, when the increased flow is transported to the sewage treatment plant through the interceptor. The overflow that exceeds the capacity of the interceptor enters the water body.
These combined sewer overflows (CSOs) include various pollutants. In particular, as the shear force rises, due to the increased sediment in the rain, the sediment rises into resuspension, and the CSOs overflows rise, and the pollution load of the water body is aggravated [2]. Sediment exists in the combined sewer in a large amount. The sediment causes the reduction of velocity by poor gradient, broken sewers, and deposition. This is generated by the structure passing through into the sewer, and wastes used in the sewer being deposited. However, though the sediment in the combined sewer needs to be removed, there is still no appropriate alternative.
As a solution of the problem generated due to the inflow into the water body of CSOs, a first-flush storage tank (FST) could be installed at the end portion of the sewer. This tank would be provided by the Ministry of Environment, for the standard of sewerage [3]. A FST installed in the combined sewer region reduces the overflow load and reduces storm runoff for flood disaster prevention. The design and operation of the FST is easy. However, a wide site is needed, and there is a limit on the selection of place. The FST capacity is designed based on the rainfall intensity of 2 mm/hr, and CSOs generated after a rainfall flow out to the stream.
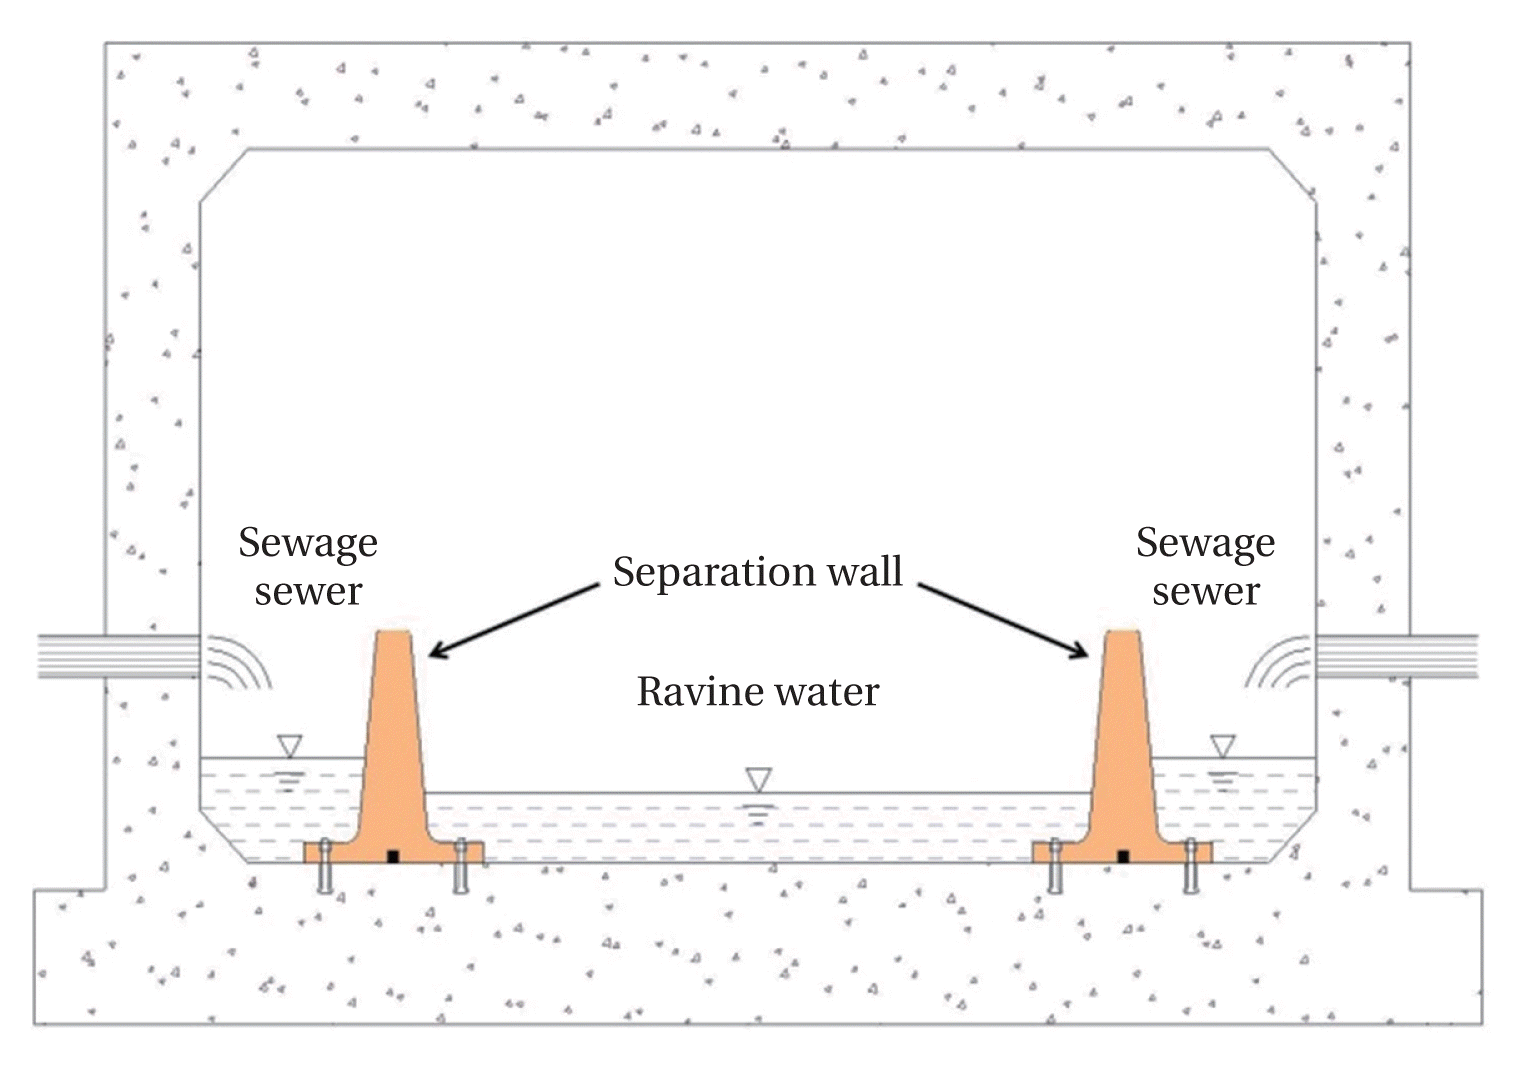
A separation wall is a polyethylene product considering reuse, such as waste plastics and vinyl, etc. [4]. Its role is to separate the sewage and rainfall in the combined sewer. In the dry season, the sewage is intercepted by the interceptor, and the ravine water is designed to enter the stream [5].
This research was carried out to analyse the effects of CSOs control, so that it selected two sampling spots with, and without, separation wall, in the combined sewer selected. By surveying the sections deposited with the sediment, the relationship of the CSOs and sediment is evaluated, to utilize a separation wall for the reduction of sediments.
2. Materials and Methods
Two survey sites were selected: Daesacheon and Gwaryecheon in outfalls of the sewer in Daejeon City, with and without separation walls, respectively. Daesacheon is a branch of the Daejeon stream, and has a basin area of 1 km2. The outfall is composed of one box size, and is separated by two sewage points and one ravine water point, respectively. Gwaryecheon is a branch of the Yudeung stream; the basin area is 7 km2. The outfall is composed of two boxes, and an FST is installed near the outfall. The capacity of the FST is 1,720 m3, based on the rainfall density of 2 mm/hr [6].
Monitoring was carried out two times during dry periods, and three times during wet periods. The sediment was surveyed two times after, and before, rainfall. Fig. 1 shows the measured point and area in the target region, and Fig. 2 shows the separation wall installed in Daesacheon.
2.1. Measurement of the Water Quality and Flow
The measurement of the flow was made by velocity-section method. A velocity meter of propeller type was used for the flow velocity, and depth of water was measured with a plastic ruler. The analysis items were biochemical oxygen demand (BOD), chemical oxygen demand (COD), suspended solids (SS), total nitrogen (TN), and total phosphorus (TP), according to the Korean standard methods [7].
2.2. Surveying Method of the CSOs
The total overflow was calculated, by multiplying the flow and the period at the start and end points, by the overflow time, during a rainfall. Sampling intervals were 3 hr in the dry period, and from 5 to 10 min in the wet period. The effective rainfall at the sampling point was calculated by dividing the overflow by the basin area. The event mean concentration at overflow intervals was calculated by dividing the summation of multiplying flow with concentration, and time by total overflow. The overflow load was calculated by multiplying overflows by event concentration. Two calculation equations are as follows:
where, Qi = flow, Ci = concentration, and Δti = interval time at wet period.
3. Results and Discussion
3.1. Control of the BOD Overflow Load
In the Daesacheon spot, the control of the separation wall was analyzed by using the assumed value for non-installation of the separation wall and the measured one for its installation, respectively. The pollution loads with and without the separation wall, and for the dry and wet periods were calculated. The relative load amount generated only for the overflow period was compared.
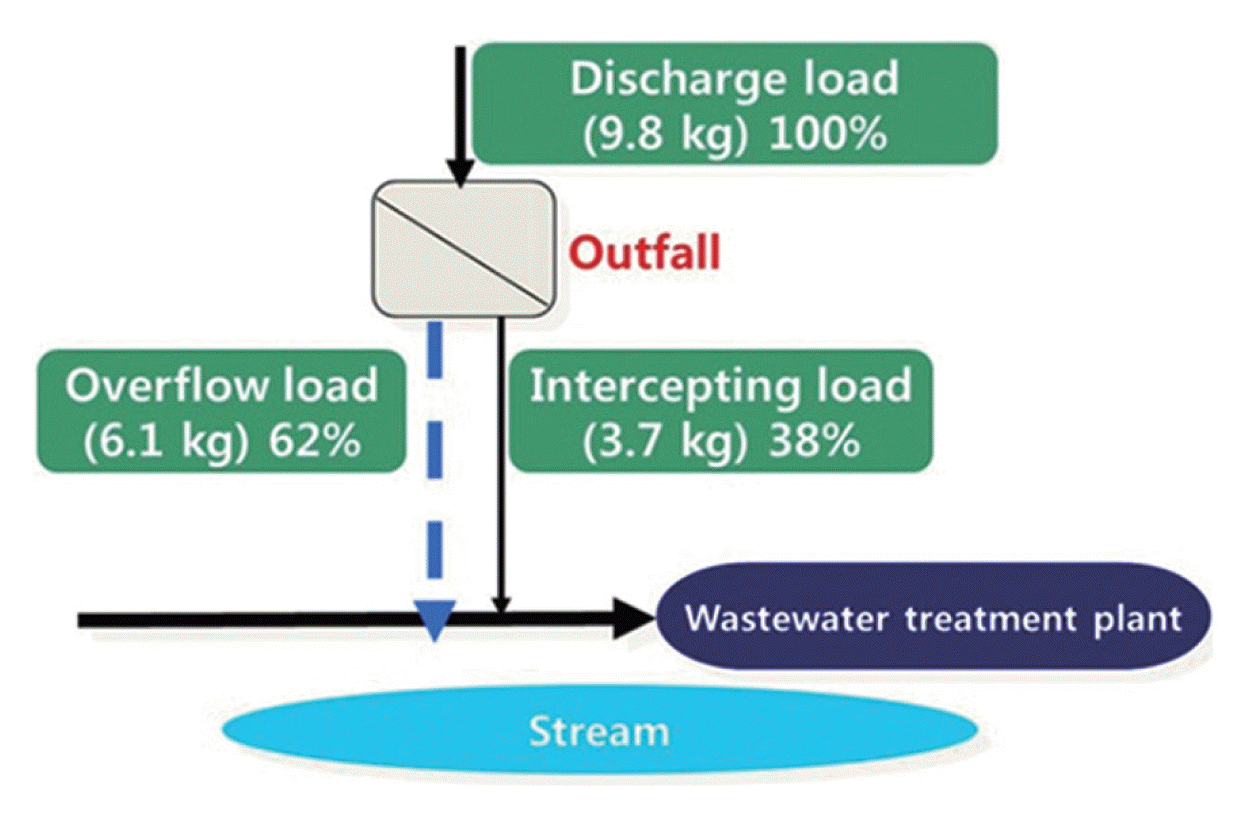
The control of the overflow pollution load by separation wall in the Daesacheon point was 22% in a rainfall intensity of 0.42 mm/hr, as intercept load of 23.4 kg BOD of the discharge load 106 kg BOD, while it was 33% for the conditions: rainfall intensity, 0.22 mm/hr; discharged load, 39 kg BOD; and intercept load, 19 kg BOD. In the rainfall intensity, 0.11 mm/hr, it was 38% for the discharged load 9.8 kg BOD, and intercept load of 4 kg BOD. The smaller the rainfall intensity, the higher the control is. According to the past investigation [8] in the same spot, when the rainfall intensity was 1.5 mm/hr and overflow time 11 min, the control showed 52% with a BOD load. Table 1 shows the maximum effects of the overflow pollution load from the separation wall installed at Daesacheon. Fig. 3 shows its schematics.
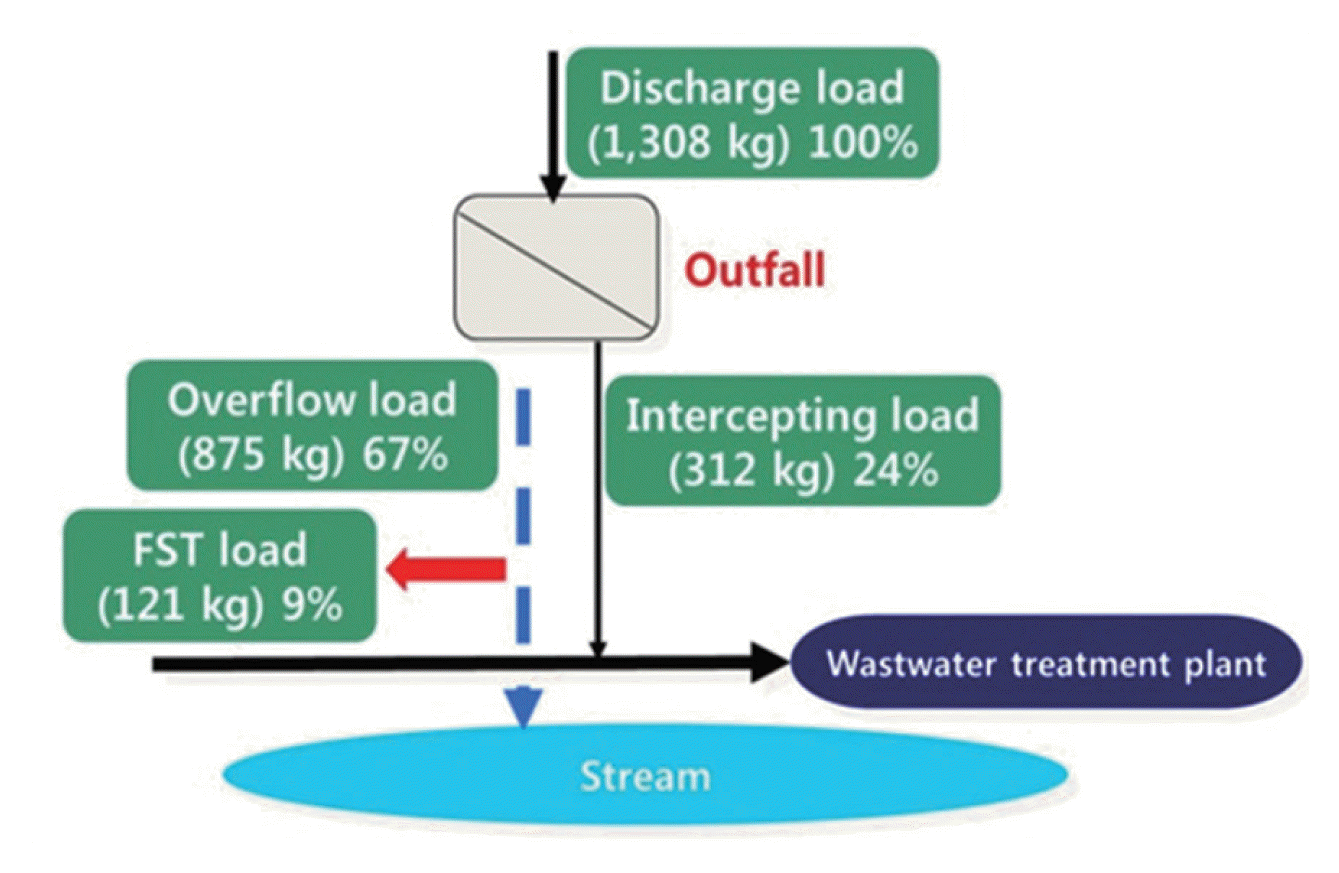
When considering the storage load according to the FST, compared with the intercepting load, the overflow pollution load of the Gwaryecheon spot in rainfall intensity of 4.19 mm/hr shows 14,459 kg BOD for the discharged load, and 1,137 kg BOD for the intercept load (201 kg BOD for FST), which shows 8% control (FST, 2%). When the rainfall intensity is 4.76 mm/hr, it shows 7,571 kg BOD for the discharged load, and 739 kg BOD for the intercept load (169 kg BOD for FST), which shows 10% control (FST, 2%). When the rainfall intensity is 1.00 mm/hr, it shows 1,308 kg BOD for the discharge load, and 433 kg for the BOD intercept load (121 kg BOD for FST), which shows 33% control (FST, 9%).
Table 2 shows the maximum control of the overflow pollution load in the Gwaryecheon spot, and Fig. 4 shows a schematization of it. In the final analysis, if a separation wall is installed in a sewer Box, the control will be improved much more than an FST, which has only 2%–9% control, because the stream water from the rainfall can be separated, and the flow into the storage tank will be decreased.
3.2. Sediment Load Runoff in CSOs
The Jung-gu Office managing Daesacheon announced that they never dredged sediments in the sewer, after a separation wall was installed in the year 2000. There was nearly no sediment in the sewage line, as proved by an on-site confirmation in the sewage line, but a little sand was accumulated in the storm line.
At Gwaryecheon, where the FST was installed, the sediment already existed. The sediment amount was measured in the constant section two times before and after a rainfall, in order to measure the mass of the sediment by the CSOs.
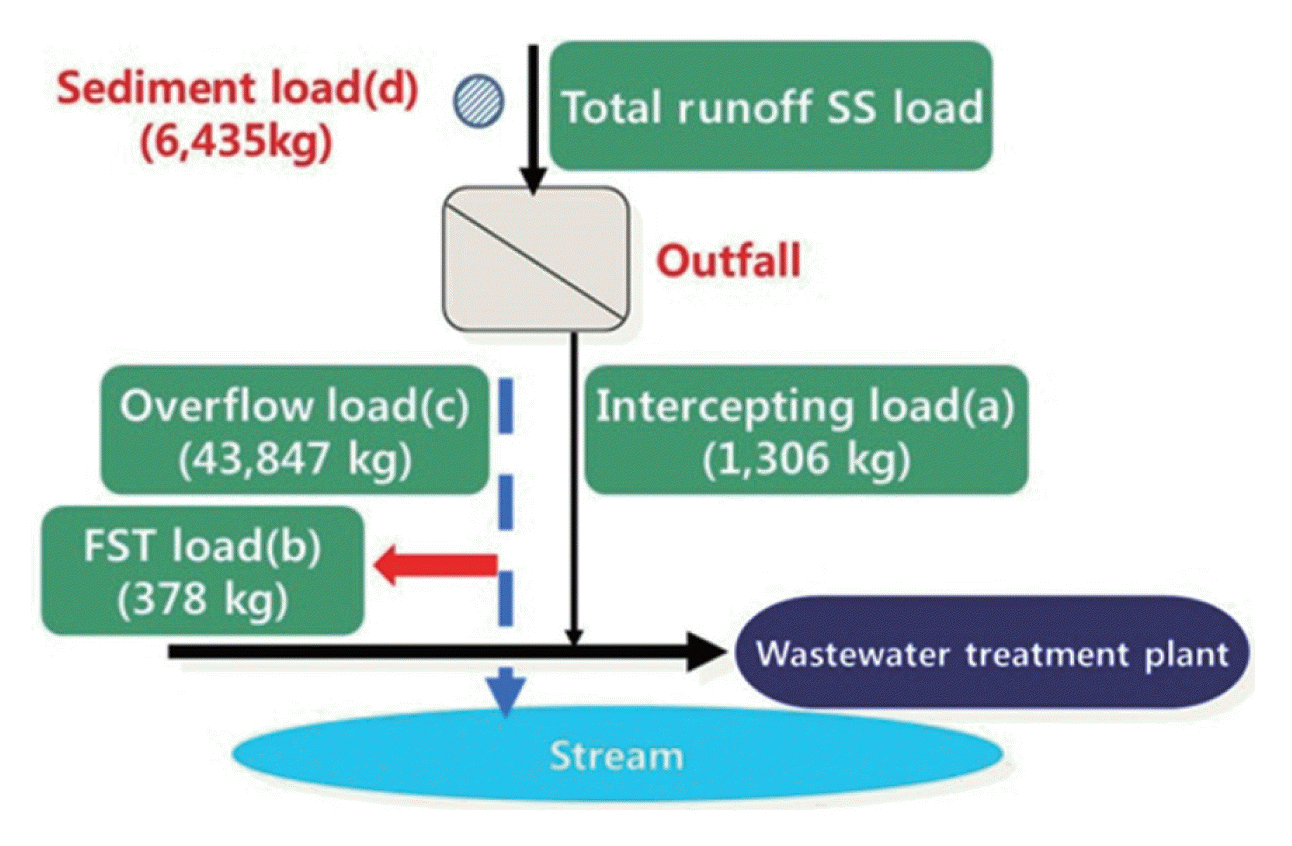
Table 3 compares the amount of sediment in the rainfall before, and after, a rainfall. Fig. 5 shows the case of the first measuring, to help understanding. The deposit amount was calculated by measuring the length and width of the sewer, the depth of the sediment section, and using the trapezoidal composition method. The sediment amount of the first investigation and the second investigation was 7.8 and 3.3 m3, respectively. The deposit amount measured the section of one of the two boxes, by runoff during a rainfall. Each showed 6,435 and 2,617 kg by dry weight, for the first and second time, respectively. Total solid (TS) concentration of the constant volume sediment collected from the field used the ratio of sediment for the total runoff SS load. In other words, the values were 28% and 23% for each rainfall. If one calculates the amount of the deposit in one box of 6,435 kg, the amount of the deposit in the two boxes would be 6,435 kg × 2, or 12,870 kg. This value would be divided by the sum of the intercept SS (1,306 kg), FST SS (378 kg), and CSO SS (43,847 kg).
In the Gwaryecheon sewer, the actual measured length of the sewer was 10% of the total sewer, because the sediment length of the total interval was too long. In this case, the ratio of sediment runoff load for the total runoff SS load was not high. But the ratio including results of the total length will be higher than the short length of the sewer. According to other research, the runoff ratio of the sediment showed about 50%–87%, in a different combined sewer area [9]. Therefore, in the Gwaryecheon case, it is expected the runoff ratio of sediment would be 50%, as the form of CSOs.
3.3. Change of Velocity on the Sediment
In a dry period, the average velocities of the sediment interval at Gwaryecheon in the first and second measurements were 0.28 and 0.31 m/s, respectively. These values were less than 0.8 m/s, which is the standard velocity [3]. As a result, the suspended solid of sewage was deposited as sediments, in the low interval velocity. To maintain the velocity higher than 0.8 m/s as a relationship with CSOs, the increase of velocity by the separation wall was estimated, as in Table 4.
The average velocity of the sediment interval was calculated to be about 1.01 m/s by the velocity-area method, under the condition with the separation wall. The velocity increase was about 3.4 times higher than the existing velocity. The structure change of the sewer with a poor slope was difficult. The velocity through the separation wall will reduce the generation of the deposited sediments. The separation wall was more effective than the FST installed to reduce CSOs. The control of CSO in the combined sewer installed with separation wall will be higher for the area with big ravine water being generated, and the sediment section with a low slope of sewer, a possible area for sand and scrub to enter, etc.
4. Conclusions
The control of the BOD overflow load was more than 38% in the Daesacheon point, with a separation wall, during a rainfall of 0.11 mm/hr. The maximum control of the BOD overflow load was 24% in Gwaryecheon, without the separation wall, during the rainfall of 1.0 mm/hr. Also, the control of the BOD overflow load was 9% only in the FST. The control would be increased, if a separation wall would be installed in Gwarycheon. Discharged sediment deposited on the sewer in the Gwaryecheon point, without the separation wall, was about 23% to 28% of the total suspended solid during the rainfall. An average velocity of sewage in the presence of sediment was about 0.30 m/s; if the separation wall was installed, it was expected to be about 1.01 m/s, which is 3.4 times more than the same conditions, resulting in the reduction of the sediment deposit.


