Seasonal variation of assimilable organic carbon and its impact to the biostability of drinking water
Article information
Abstract
The seasonal effects on the biostability of drinking water were investigated by comparing the seasonal variation of assimilable organic carbon (AOC) in full-scale water treatment process and adsorption of AOC by three filling materials in lab-scale column test. In full-scale, pre-chlorination and ozonation significantly increase AOCP17 (Pseudomonas fluorescens P17) and AOCNOX (Aquaspirillum sp. NOX), respectively. AOC formation by oxidation could increase with temperature, but the increased AOC could affect the biostability of the following processes more significantly in winter than in warm seasons due to the low biodegradation in the pipes and the processes at low temperature. AOCP17 was mainly removed by coagulation-sedimentation process, especially in cold season. Rapid filtration could effectively remove AOC only during warm seasons by primarily biodegradation, but biological activated carbon filtration could remove AOC in all seasons by biodegradation during warm season and by adsorption and bio-regeneration during cold season. The adsorption by granular activated carbon and anthracite showed inverse relationship with water temperature. The advanced treatment can contribute to enhance the biostability in the distribution system by reducing AOC formation potential and helping to maintain stable residual chlorine after post-chlorination.
1. Introduction
Biodegradable organic matters (BOM) is a fraction of natural organic matters which can be utilized by bacteria as a source of energy and carbon [1]. The significant bacterial regrowth and reduction of BOM have been reported at the end of the distribution system in many utilities, and this indicates that bacterial regrowth can occur by consuming these BOM in drinking water distribution systems [2–4].
There are two kinds of parameters to quantify the BOM in water. One is biodegradable dissolved organic carbon (BDOC) which can directly determine the carbon concentration of BOM from the difference between initial DOC and final DOC during incubation [5]. However, it may not be appropriate to determine the low concentration of BOM in drinking water system due to the relatively high detection limit of 0.1–0.2 mg/L [6, 7]. The other parameter is assimilable organic carbon (AOC) which is easily available organic substrates and can be converted to bacterial biomass [8]. AOC is considered as a better indicator of bacterial regrowth potential of drinking water because the bioassay can directly measure the newly formed bacterial biomass as a result of BOM assimilation in water, and it is very sensitive with the low detection limit of 10 μg/L [6, 7, 9–11]. Many studies have suggested various criteria for biostability of drinking water in distribution systems based on the AOC concentrations. The best known criterion was suggested by van der Kooij [8]. He recommended that very low AOC level of < 10 μg acetate-C/L be maintained to achieve biostability (HPC < 100 CFU/mL) without residual disinfectants. For chlorinated distribution systems, many studies suggested the higher AOC level of 40–135 μg acetate-C/L as a guideline for biostability [7, 12, 13].
For reducing the AOC concentration, it is important to understand the variation of AOC and the influencing factors in drinking water treatment processes. The oxidation processes including ozonation and chlorination is well known to increase AOC concentration, and the increased AOC can be removed by attached bacteria in the biological filters [3, 13–21].
Especially, biological activated carbon (BAC) process, generally referred to as the combination of ozonation and granular activated carbon (GAC) filter, is considered the most effective way to remove BOM in water [15, 22]. In some cases, however, it has been reported that AOC concentration of BAC effluent was higher than the AOC concentration before ozonation [4, 13, 23, 24]. Without sufficiently high bacterial activity, BAC filter cannot remove all of the AOC produced by ozonation, and the advanced treatment may worsen the biostability of the drinking water. The bacterial activity can be influenced by seasonal variations of water temperature and operational conditions [25, 26]. So, the AOC removal can seasonally fluctuate, meaning that biostability of drinking water can be threatened in some periods. Previous researches have already reported that the variation of AOC and BDOC in the drinking water treatment processes seasonally differed, especially in the biological filtration processes. Some studies showed that removal of AOC and BDOC by BAC filter was high in summer but no removal was detected in winter [23, 27]. On the contrary, other studies reported that BAC filter showed no impact or better tolerance to low temperature for AOC removal while AOC removal by rapid filter drastically decreased in winter [13, 24, 28, 29]. These different results make it difficult to understand the mechanism of AOC removal by biological filters. BAC filter can remove dissolved organic matter (DOM) by combined action of adsorption and biodegradation [22]. In full-scale treatment, however, it is difficult to distinguish the contribution of biodegradation from that of adsorption for DOM removal in BAC filtration. In addition, there is little information about the effect of temperature on AOC adsorption by various filling materials although adsorption can be an important mechanism for AOC removal.
On the other hand, the formation of AOC by oxidation can also be seasonally affected since the reaction rate between oxidants and organic matters can be significantly affected by temperature [30, 31]. However, there is lack of study on the AOC formation by pre-chlorination while many studies have focused on the AOC formation by ozonation. In this study, therefore, the seasonal variation of AOC concentration was monitored in full-scale drinking water treatment processes including pre-chlorination, post-ozonation and biological filtration processes. The adsorption of AOC by three filling materials was also studied in the lab-scale column test at different water temperatures to elucidate the different mechanism of AOC removal by rapid filter and BAC filter.
The purposes of this study are 1) to understand the seasonal variation of AOC in full-scale drinking water treatment process; 2) to investigate influencing factors, e.g., temperature, pH, algal biomass, oxidant dose and retention time on the AOC variation in each process; 3) to compare the different mechanism of AOC removal by season in rapid filtration and BAC process; and 4) to evaluate the effect of advanced treatment on the biostability of drinking water.
2. Materials and Methods
2.1. Study Sites and Sampling
This study was carried out at Y water treatment plant (YWTP) in Seoul, Korea. YWTP is located in downstream of the Han River in Seoul. The treatment process of the YWTP consists of conventional and advanced water treatment processes (Fig. S1). The conventional process includes pre-chlorination, coagulation-sedimentation, and rapid filtration (dual media of anthracite/sand). The advanced process consists of ozonation and BAC filtration, and post-chlorination follows the advanced process. BAC filter is filled with coal based GAC and the EBCT (empty bed contact time) is 15 min (Table 1). In this study, the biologically active BAC filter was distinguished from the virgin GAC filter without biological activity in the column test.
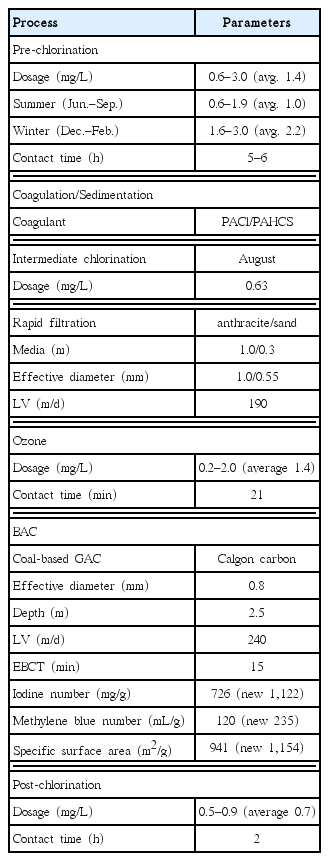
Design and Operational Parameters of YWTP
Pre-chlorination was applied at the intake of the raw water, and additional pre-chlorine was applied in the receiving well. The contact time with chlorine was about 6 h including the retention time in the receiving well (30 min) and in the pipeline from intake station to the receiving well (5–6 h). Generally, the dosage of pre-chlorination was low in summer to reduce disinfection by-products (DBPs) formation and high in winter for breakpoint chlorination of ammonia in the raw water. During the summer cyanobacterial bloom, pre-chlorination was replaced by intermediate chlorination to reduce the odor problem by algal cell disruption. The ozone dosage was determined by the feedback system to maintain the residual ozone concentration of 0.05 mg/L in the effluent of the ozone reactor. The samples were taken from the intake station at the Han River and effluents of each process once a month at YWTP from April 2013 to March 2014.
The samples were collected in 1 L pre-baked amber glass bottles, and 1 mL of 3% sodium thiosulfate was added to quench residual chlorine and ozone. All glassware including glass bottles, vials, filtering supports and funnels were baked at 550°C for 2 h before sampling. Glass fiber filters (GF/F, 47 mm, Whatman) to remove particulate matters were baked at 480°C for 2 h and pre-rinsed by filtering through 2 L of deionized water.
2.2. Small Column Test
Double walled glass columns (OD 9 cm, ID 7 cm, L 46 cm) were used to compare the AOC adsorption by filling materials, i.e., GAC, anthracite and sand (Fig. S2). The water temperature in the columns and the reservoir were kept constant at 5, 15, 25°C by water bath circulators. 500 g of virgin filling materials were autoclaved and filled into each column. Each column was backwashed with air and water after filling, and sterilized again by circulating hot water (70°C) into the water jacket of the columns for 1 h. After adjusting the target temperature of the columns and reservoirs, adsorption test was conducted. Ozonated water, which had been stored in a reservoir overnight at the target temperature, flowed continuously into each column by a peristaltic pump. EBCT of each column was 15 min. The water samples were taken from the inflow and outflow of each column. Removal efficiencies of total organic carbon (TOC) and AOC in each column were compared.
2.3. AOC Analysis
2.3.1. Pure-culture strain AOC method
To understand the formation and removal of different fractions of AOC in full-scale drinking water treatment processes and to evaluate biostability by comparing with previously reported criteria, two pure-culture strain AOC method was applied according to Standard Method 9217 [9]. Pseudomonas fluorescens P17 (P17; KTCT 12028, corresponding to ATCC 49642) and Aquaspirillum sp. NOX (NOX; KTCT 12027, corresponding to ATCC 49643) were used. The turbid samples including raw water and the water from receiving well and sedimentation basin were filtered through pre-baked GF/F to remove particulate matters. The prepared samples were pasteurized at 70°C for 30 min in a water bath and were inoculated with P17 and NOX together with mineral salt water. After mixed well, the inoculated samples were divided into nine 40 mL pre-baked glass vials with open top caps. The sample vials were incubated at 15°C, and three vials were taken out on day 7, 8, 9, respectively and the bacteria were enumerated by the spread plate method with R2A agar. The plates were incubated at 25°C for 5 d and then colonies on the plates were counted. The average colony counts of P17 and NOX of three consecutive days were converted into carbon concentration by multiplying the carbon conversion factor of each strain. AOCP17 and AOCNOX concentrations were calculated by the following Eq. (1) and (2), and AOC was shown by the sum of AOCP17 and AOCNOX (3).
2.3.2. Flow cytometric AOC method
To compare the AOC adsorption by different filling materials for the same ozonated water, the more realistic and faster flow cytometric AOC method was applied for small column test samples according to modified method of TECHNEAU 3.3.1 [32]. Stock inoculum was prepared with a natural bacterial community of raw water. Ozonated water was filtered with a pre-rinsed 0.2 μm PES membrane, and inoculated with raw water filtered with a 5 μm membrane filter and mineral salt solution. The inoculated water was incubated at 30°C for 5 d. After confirming no more growth of bacteria, the incubated sample was used as a stock inoculum.
100 mL of water samples were filtered with a pre-rinsed 0.2 μm PES membranes to remove microorganisms and interfering particles present. The filtered samples were re-inoculated with the prepared stock inoculum and mineral salt solution, resulting in final concentration of about 1 × 10⁴ cells/mL. The inoculated samples were divided into three 40 mL baked glass vials with open top caps, and were incubated at 30°C for 5 d.
The bacterial concentrations of incubated stock inoculum and water samples were determined by flow cytometric method according to the Swiss food book method 333.1 [33]. 1 mL of the samples was stained with 10 μL of SYBR green I (1:100 dilution in DMSO, molecular probes) and incubated in a heating block at 37°C for 20 min in the dark. The total cell count was measured with a flow cytometer (BD Accuri C6), and the AOC concentration was calculated by the following Eq. (4).
2.4. Biological Analysis
The water samples were collected into sterilized plastic bottles including sodium thiosulfate. Heterotrophic plate counts (HPC) were enumerated by the pour plate method with R2A agar. The plates were incubated for 7 d at 28°C.
To analyze attached bacterial biomass, media were collected from the top, middle, bottom of the rapid filter and the BAC filter using a core sampler. The collected medium samples were then placed in sterilized plastic bottles and mixed well. 1–2 g of wet media was added to 50 mL of sterilized phosphate buffered saline (PBS), which was then sonicated for 5 min to detach the bacteria. The detached bacterial concentration in PBS was determined according to the HPC analysis method with R2A agar. 3–4 g of media was baked at 110°C for 2 h, and the ratio of dry weight and wet weight of media was calculated from the difference of weight before and after baking. The attached bacterial concentration was calculated by the following Eq. (5).
Algal cells of raw water were counted with a microscopic method with a Sedgwick-Rafter chamber.
2.5. Chemical Analysis
Samples for TOC were homogenized with an ultrasonic homogenizer (BANDELIN SONOPULS, HD2200) to break particulate matters, and samples for DOC were filtered with pre-baked GF/F. TOC and DOC were analyzed with a TOC analyzer (Ionics, Sievers 820) equipped with inorganic carbon remover. The residual chlorine was measured with a Hach pocket chlorine colorimeter.
2.6. AOC Formation Potential (AOCFP) and Chlorine Demand
500 mL volumetric flasks were filled with the sample water and 2 mg/L of chlorine was added to the samples. Initial chlorine concentration was defined as the residual chlorine concentration when the same amount of chlorine was added to 500 mL of ultrapure water. The chlorinated sample water was decanted into two 125 mL baked amber glass bottles without headspace and sealed with teflon lined caps. Then the sample bottles were incubated at 25°C for 7 d. After incubation, residual chlorine was measured and the remaining samples were quenched with sodium thiosulfate not to form AOC anymore. The AOC concentration of the samples before and after incubation was analyzed according to the flow cytometric method described above.
AOCFP and chlorine demand were calculated from the difference of AOC concentration and residual chlorine before and after incubation, respectively.
3. Results and Discussion
3.1. The Variation of AOC in Drinking Water Treatment Processes
The variation of AOC showed different trends from those of TOC and DOC in the drinking water treatment processes (Fig. 1). TOC and DOC were reduced by coagulation-sedimentation and BAC filtration. After pre-chlorination and rapid filtration, a small amount of TOC was reduced by precipitation of particulate matters in the pipes and receiving well, and by filtration of particles, but DOC could not be reduced (paired t-test, p-value: TOC 0.017, < 0.001, DOC 0.730, 0.569). Post-ozonation and post-chlorination did not significantly affect TOC and DOC concentrations (paired t-test, p-value: TOC 0.310, 0.237, DOC 0.072, 0.398) (Table S1).
The variation of annual average of TOC, DOC (a) and AOCP17 and AOCNOX (b) in the drinking water treatment processes at YWTP. The error bar indicates standard deviation. And, the box chart shows the annual variation of AOC (c) and specific AOC (d) in each process. The two error bars in the box chart indicate 10th and 90th percentiles. The three lines and dots in the box chart indicate the 25th, 50th, 75th percentile, and the annual average.
On the contrary, AOC increased significantly after pre-chlorination and ozonation, and it was reduced by rapid filtration as well as coagulation-sedimentation and BAC filtration (Fig. 1). After chlorination and ozonation, AOC increased without DOC change. This means that those oxidation processes could not mineralize DOC but convert non-biodegradable organic matters into biodegradable compounds.
The variation of AOC was determined primarily by AOCP17 in the conventional treatments from raw water to rapid filtration while the variation of AOC in the advanced treatments was consistent with the variation of AOCNOX (Fig. 2). AOCP17 increased mainly by pre-chlorination and AOCNOX increased mainly by ozonation. A high increase of AOCNOX by ozonation was reported by many previous research studies [15, 18, 21].
The variation of AOC, AOCP17 and AOCNOX concentrations in each process at YWTP.
P17 and NOX are known to have different nutritional availability. As P17 has a great nutritional versatility, it can grow on a variety of carbohydrates, alcohols, aromatic acids and amino acids, but cannot utilize some carboxylic acids including oxalate, formate, glycolate, and glyoxylate, which are well known as ozone by-products [34]. Whereas, NOX is able to take advantage of using a wide range of carboxylic acids, but cannot assimilate carbohydrates, alcohols or aromatic acids [35].
The growth patterns of P17 and NOX after chlorination and ozonation suggest that organic compounds produced by chlorination and ozonation be different. Ozone is a stronger oxidant than chlorine, and can produce more oxidized compounds with very low molecular weight, including carboxylic acids which can be used by NOX [36, 37]. Chlorine can also split DOM, but the size and characteristics of fragments may not be preferred by NOX [38, 39].
On the other hand, specific AOC level (AOC/DOC) showed different trend from absolute AOC concentration in drinking water treatment (Fig. 1). Raw water showed much higher AOC concentration than BAC filtrate and finished water, but specific AOC level of raw water was similar to that of BAC filtrate and finished water. Also, the effluent of coagulation/sedimentation had higher specific AOC level than pre-chlorinated water while it had lower absolute AOC concentration than pre-chlorinated water. This could be ascribed to more effective removal of refractory DOC relative to AOC in the coagulation/sedimentation and the BAC processes.
3.2. The Seasonal Effect of Pre-chlorination on AOC
The variation of AOC by pre-chlorination was different by season. After pre-chlorination, the AOC concentration in the receiving well increased from winter to early spring while it decreased during summer (ANOVA, p = 0.005) (Fig. 2 and 3). AOC concentration can increase with water temperature because the reaction rate between chlorine and organic compounds increases with temperature [3]. In this study, however, AOC concentration in the receiving well showed negative relation with temperature (Fig. 3). This seasonal variation of AOC after pre-chlorination in YWTP could be related to temperature dependent bacterial activity in the pipeline with relatively long retention time of 6 h from the intake station to the receiving well. In winter, the oxidation reaction between chlorine and organic matters could remain active up to the end of the pipeline because the reaction rate was slow. This could result in a continuous increase of AOC in the receiving well without consumption of AOC by bacteria under low water temperatures. In the high water temperature season, however, the chlorine dose was lower and the reaction rate between chlorine and organic matters was higher than in winter time. The oxidation reaction was completed in a short period of time and the most of chlorine was consumed. As a result, bacteria could utilize AOC effectively in the pipeline under high water temperatures, so the initially increased AOC could be reduced. In this study, HPC in the receiving well was high in summer with a range from 4,800 to 80,000 CFU/mL, and it was sometimes much higher than the HPC level of the raw water. In winter, however, HPC in the receiving well was maintained at low levels (< 80 CFU/mL) and it was always lower than the HPC levels of the raw water. These observations supported the possibility of AOC reduction by bacterial growth in the pipeline during the high temperature season.

The seasonal variation of AOC concentration of raw water and pre-chlorinated water (a), and AOC increase and chlorine dose after pre-chlorination (b).
On the other hand, AOC concentration tended to increase with increasing chlorine dose in winter (Fig. 3). However, high AOC concentration during winter was not probably due to the high chlorine dose. During winter, ammonia-N concentration of raw water was high (0.11–0.37 mg/L), so high concentration of chlorine was required to remove ammonia-N by break-point chlorination. The most of added chlorine was consumed by the reaction with ammonia, and only a small amount of chlorine could react with organic matters. In addition, AOC could not increase significantly by oxidation of DOM during winter due to very low reaction rate under low temperature [3]. The high AOC concentration during winter could be related to the winter diatom bloom of raw water. Pre-chlorination can break particulate organic matters including algae, and release easily assimilable intracellular organic matter (IOM) from cells into water [40]. Algal organic matters (AOM) consist of biodegradable compounds including proteins, lipids, and carbohydrates [41]. The increase of AOC concentration after pre-chlorination was the highest in February 2014 when the diatom biomass was the highest in the raw water (Table S2). The easily assimilable IOM released from broken algal cells could contribute to the significant increase of AOC concentration after pre-chlorination during winter. The disrupting algal cells by chlorine could occur regardless of water temperature while the conversion of high molecular weight DOM to low molecular weight DOM by chlorine could increase at high water temperature [3, 42].
3.3. Removal of AOC by Coagulation and Sedimentation
AOC was reduced after coagulation-sedimentation with an annual average removal efficiency of 24% (Fig. 1). AOC removal by coagulation-sedimentation was mainly attributed to AOCP17 (Fig. 1 and 2). The annual average of AOCP17 removal was 31%, but the annual average of AOCNOX removal was only 2%. This could be due to more effective removal of higher molecular weight compounds by coagulation-sedimentation [43]. According to the study of Kim et al.[40], the high molecular weight fraction (> 5,000 Da) of AOC was mainly composed of AOCP17 while low molecular weight fraction (< 5,000 Da) of AOC was composed of AOCP17 and AOCNOX.
In general, the DOC removal by coagulation-sedimentation is related to refractory fraction with high molecular weight and humic substance, and the AOC fraction with low molecular weight and non-humic compounds is difficult to be removed by those processes [43–45]. In some cases, however, significant AOC or BDOC removal have been reported after coagulation-sedimentation [17, 19, 23, 42, 44, 45]. It was assumed that the substantial BOM reduction might be attributed to biological degradation with a long retention time in sedimentation basins [19]. At YWTP, the removal efficiency of AOC by coagulation-sedimentation was low (0–23%) in summer and high (34–51%) in winter. So et al. [27] reported higher BDOC removal in coagulation/sedimentation/rapid sand filtration process during winter. Considering low bacterial activity in rapid filter during winter, this high BDOC removal could be attributed to coagulation and sedimentation. The higher AOC and BDOC removal in the low temperature season implies that those BOM removals by coagulation-sedimentation may not be mainly ascribed to bacterial degradation. The high AOC removal could be related to biopolymer reduction. Biopolymers are high molecular weight materials but hydrophilic and non-humic substances including polysaccharides and proteins [46]. The high removal of biopolymers by coagulation-sedimentation was shown by Jar test [47].
3.4. AOC Formation by Ozonation
The AOC concentration increased significantly after ozonation (Fig. 1 and 2). The AOC increase (ΔAOC) by ozonation ranged from 3 to 87 μg acetate-C/L with an annual average of 49 μg acetate-C/L. The AOC increase per ozone ranged from 16 to 216 μg acetate-C/mg O3 with an average of 125 μg acetate-C/mg O3. The significant AOC increase after ozonation has been reported in many studies, and it could be attributed to the conversion of high molecular weight and refractory organic matters to low molecular weight and biodegradable organic matters, e.g., aldehydes, ketones, ketoacids and carboxylic acids [14, 16, 17, 19, 20, 36, 43, 48, 49].
In the YWTP, AOC increase was high from May to November, but low in winter (January to March). The specific AOC increase (ΔAOC/DOC) tended to be linealy proportional to water temperature (R2 = 0.45, p = 0.016) and specific ozone dose (O3/DOC) (R2 = 0.59, p = 0.004) (Fig. 4). AOC formation can increase with water temperature since the reaction rate between ozone and organic matters can increase with temperature [30, 31]. In addition, ozone dose and hydroxyl radical exposure can also increase at higher water temperature in feed-back ozone dose control system since ozone decomposition and formation of hydroxyl radical increase with temperature [16, 30, 31]. Despite similar water quality of influent (Turbidity 0.06 ± 0.005 NTU; TOC 1.13 ± 0.05 mg/L) and high water temperatures (23–24°C), the AOC increase was significantly lower in July and August than in June and September. It could be related to relatively low pH and alkalinity during those two months. pH can be another important factor for AOC formation by ozonation because ozone decomposition and the formation of hydroxyl radical can increase with pH [30, 50]. In this study, the pH and alkalinity of the influent of the ozone contactor in June and September were higher (pH 7.3; alkalinity 34–36 mg/L) than July and August. The pH and alkalinity of the influent declined to 6.9–7.0 and 24–27 mg/L in July and August when high turbid water flowed into the YWTP during heavy rainy season. Hydroxyl radical is non-selective oxidant and stronger than ozone itself [14], so AOC formation may increase by increase of hydroxyl radical [50]. However, Lee [16] insisted that the reaction of molecular ozone with DOM is predominant mechanism for AOC formation rather than OH radical reaction. Although the effect of hydroxyl radical on AOC formation is not clear, this relatively high temperature and pH could cause the higher AOC concentration of the ozonated water since they could increase ozone dose due to the fast decomposition of ozone.
The seasonal variation of AOC concentration after rapid filtration and ozonation (a), the relationship between temperature and specific ozone dose(O3/DOC) and between temperature and specific AOC increase (dAOC/DOC) after ozonation (b), and the relationship between specific ozone dose and the specific AOC increase at YWTP (c).
The specific AOC increase showed positive correlation with specific ozone dose (Fig. 4). Some previous studies showed that AOC and BDOC increased linearly at a low ozone dose, but it reached a plateau level at a high ozone dose. The maximum specific ozone doses were 0.8–2 mg O3/mg DOC, and AOC and BDOC did not show significant increase at higher ozone dose [4, 16, 19, 37]. These observations were explained by three reasons. First, the oxidation of AOC to carbon dioxide and the new formation of AOC from remaining higher molecular weight compounds by further ozone addition occurred in parallel [51]. Second, some organic matters can be easily converted to BOM, but other refractory organic matters require a much higher ozone dose for conversion to BOM [37]. Third, the destruction of smaller molecules including aldehyde to carboxylic acids and carbon dioxide may also require higher ozone doses [37]. Usually, a specific ozone dose of 0.5 to 1.0 mg O3/mg DOC is quite common for biofiltration in drinking water treatments [52]. In this study, the specific AOC increase did not reach a plateau level. This could be ascribed to a relatively low specific ozone dose of 0.2–0.8 mg O3/mg DOC (Fig. 4).
3.5. Effect of Temperature on AOC Adsorption by Filter Media
In the small column test, the adsorption of TOC and AOC by three virgin filling materials was compared at 5, 15 and 25°C. TOC adsorption by three filling materials showed similar removal by water temperature. TOC removal by GAC was higher than 86%, but TOC removal by anthracite and sand was lower than 3% and 1%, respectively, in all water temperatures (Fig. 5). This showed that GAC is a good adsorbent of DOM, but anthracite and sand cannot adsorb DOM at all regardless of the water temperature.

TOC and AOC adsorption by GAC, anthracite and sand at 5, 15 and 25°C.
On the contrary, AOC removal by GAC and anthracite showed significant variation with water temperature. AOC removal by GAC was higher than 91% at 5 and 15°C, but it reduced drastically to 9% at 25°C (Fig. 5). AOC removal by anthracite also decreased at higher water temperature, but sand could not remove AOC in all temperature conditions.
The effect of water temperature on adsorption of organic matters by GAC is still not clear. On the basis of a thermodynamic point of view, adsorption by physical interactions should decrease with increasing temperatures due to disruption of an adsorptive bond [53, 54]. This was demonstrated by lab-scale tests for some compounds, e.g., phenol and o-cresol under anoxic condition [55]. On the contrary, high temperatures can increase adsorption due to a decrease of water viscosity and increase of diffusion rates of compounds [53, 56]. Many researchers reported that DOM adsorption by GAC increased with increasing temperatures [54, 57, 58]. An increase of water temperature may destruct weakly bound macromolecular associations and decrease molecular size of DOM, which can result in the increase of DOM adsorption by GAC due to a better accessibility to GAC micropores [54]. In addition, the adsorption of aromatic and olefinic compounds to GAC can increase with increasing temperatures by enforced hydrophobic interaction between the carbon surface of GAC and the aromatic structure of DOM molecules at higher temperatures [54, 57].
In this study, however, AOC produced by ozonation is composed of low molecular weight and non-aromatic organic compounds [17, 19, 43, 48, 49]. So, physical interaction may be more important than hydrophobic interaction in adsorbing those low molecular weight and hydrophilic AOC compounds by GAC. Therefore, adsorption of AOC by GAC could increase during the cold season when a physical interaction is stronger than in the warm season.
3.6. AOC Removal and Bacterial Concentration in Biological Filters
The increased AOC by the oxidation processes was reduced by the biological filtration processes (Fig. 1 and 6). AOC removal by rapid filtration (anthracite/sand) ranged from 0 to 77% with an average of 39%, and the removal by BAC filtration ranged from 45 to 80% with an average of 69%. Other studies also showed that GAC was a more appropriate filling material than anthracite for the AOC removal [15].

The seasonal variation of AOC removal, HPC and water temperature after BAC filtration (above) and rapid filtration (below) and the AOC concentration of inflow water of both filters at YWTP from April 2013 to March 2014. (* low AOC removal and bacterial concentration due to residual chlorine by intermediated chlorination).
Rapid filtration at the YWTP showed substantial seasonal variation of the AOC removal efficiency (Fig. 6). It was high from spring to fall, but it decreased sharply in winter. The removal efficiency of AOC in August was unusually low despite of high water temperatures because attached bacterial activity was low due to the residual chlorine in the influent by intermediate chlorination. On the contrary, AOC removal efficiency by BAC filtration showed less seasonal difference than that by rapid filtration. The removal efficiency was 74–80% from spring to fall and 46–74% in winter. Bacterial growth in the effluent of BAC filter was affected by the AOC concentration of the influent rather than the water temperature while bacterial growth in the effluent of rapid filter was primarily dependent on the water temperature (Fig. 6). In rapid filter, both AOC removal and number of bacteria in the effluent were positively related to water temperature, and they were reduced to zero in winter.
On the other hand, it is necessary to pay attention to the high removal of AOC and the high concentration of bacteria in the effluent of BAC filter during winter (Fig. 6). The attached bacterial number in the BAC filter maintained high level regardless of the season, while that in the rapid filter significantly decreased in winter (Fig. 7).
The monthly variation of attached bacterial biomass on the bottom layer of the BAC filter (a) and the attached bacterial biomass of the anthracite and BAC filter at the different depth in summer and winter (b).
There are three possibilities to explain this observation. First, the adsorption can be one of the explanations for high removal of AOC by BAC filtration in winter. In YWTP, BAC filter had been operated for three years, but substantial adsorption capacity of BAC for DOM was maintained. The methylene blue number of BAC was 120 mL/g (virgin GAC: 235 mL/g) and DOC removal also maintained about 30% all year round. In our column test, especially, GAC showed higher adsorption of AOC at lower temperature. This means that adsorption of BAC can be important mechanism for AOC removal in winter. However, the AOC adsorption by BAC cannot explain the high concentration of bacteria in the BAC filter in winter.
Second, the macroporous structure and thick biofilms of BAC could be a protective barrier for bacteria against low temperature and offer advantage of maintaining relatively high bacterial activity. In this study, the attached bacterial biomass of BAC filter was much higher than that of rapid filter (Fig. 7). GAC can support higher attached bacterial biomass than anthracite since surface charge and irregular structure of GAC can be more suitable for bacterial attachment and colonization [22, 59]. Attached bacteria can produce extracellular polymeric substance (EPS) and develop biofilm on the media [60]. Biofilm can protect attached bacteria from adverse environmental conditions including desiccation and antibiotics [61, 62]. Also, the macroporous structure of GAC can protect bacteria from harsh environment such as shear stress [59]. Therefore, the macroporous structure and thick biofilms of BAC could also be a protective barrier for bacteria against temperature change [25, 63].
Third, the high attached bacterial biomass in the BAC filter in winter might be related to bio-regeneration, another biological process to regenerate adsorption capacity of used GAC by biodegradation of adsorbed organic compounds [64]. Although bio-regeneration could increase with increasing temperature [65], it might have occurred in BAC filter during winter. Pomeroy et al. [66] reported that water temperature alone could not explain the variation of microbial activity in cold water, and the bacterial respiratory rate could be stimulated by a high concentration of substrates such as glucose and peptone even under low temperature water below 3.5°C. This suggested that the bacterial growth could be inhibited under the AOC level in chlorinated or ozonated water in WTP at low temperature, but the attached bacteria on the BAC could grow effectively utilizing a high concentration of AOC accumulated on the BAC even under low temperature water. Yang et al. [67] also reported higher removal of AOC by BAC filter and high bioactivity and dissolved oxygen consumption in BAC filters during low temperature (5.3–8°C). The bio-regeneration of BAC could also increase the adsorption of AOC by BAC filtration, which could contribute to the high removal of AOC in the water phase during the winter season.
3.7. Effects of Advanced Treatment on the Biostability of Drinking Water
The annual average of the AOC concentration after rapid filtration and BAC filtration were 51 and 32 μg acetate-C/L, respectively [68]. The AOC levels in the effluents from both filters were similar from April to November when the bacterial activity was high. But, the AOC concentration after BAC filtration was lower than that after rapid filtration during the winter season (Fig. S3). However, the AOC reduction by advanced treatment cannot contribute significantly to improvement of biostability during winter since the bacterial growth can be suppressed even in rapid filtered water with higher AOC level under the low water temperatures.
BAC filtration could remove more AOC than that increased by ozonation in all seasons (Fig. 2), so the advanced water treatment could maintain the biostability of drinking water in spite of the significant increase of AOC by ozonation. On the other hand, the AOC concentration after post-chlorination slightly increased with an average of 4 μg acetate-C/L. This increase was negligible comparing the significant increase of AOC after pre-chlorination and intermediate chlorination. This negligible increase of AOC after post-chlorination could be ascribed to reduction of AOC precursors by ozonation and BAC filtration.
AOCFP and chlorine demand of effluents from both rapid filter and BAC filter were compared (Fig. S4). After 7 day-incubation with chlorination, the effluent of BAC filter showed little increase of AOCFP (< 1%) while those of rapid filter showed significant increase of AOCFP (34%). This reduction of AOCFP by the advanced treatment may improve the biostability by minimizing AOC formation in the chlorinated distribution system. In addition, the chlorine demand of the effluents from the BAC filter (0.96 mg/L) was lower than that from the rapid filter (1.28 mg/L). The reduction of chlorine demand by advanced treatment can also contribute to enhance the biostability of the tap water in the distribution system by helping to maintain stable residual chlorine [26]. In winter, however, more attention should be paid to post-chlorination process to disinfect high concentrations of bacteria in the effluent of BAC filter as chlorine disinfection efficiency is reduced at low water temperatures [69].
AOC is a useful indicator of biostability of drinking water, but it cannot give information about biological instability caused by growth of pathogenic bacteria and autotrophic bacteria [10]. Further study is needed to investigate bacterial community composition of biofilm in biological filters and distribution system.
4. Conclusions
AOC concentration in drinking water treatment process changed seasonally. AOC formation by oxidation could increase with temperature, but the increased AOC could affect the biostability of the following process more significantly in winter than in warm seasons due to the low biodegradation in the pipes and the processes at low temperature. Coagulation-sedimentation mainly removed AOCP17, especially in cold season. Rapid filtration could remove AOC only in warm seasons by primarily biodegradation. On the contrary, BAC filtration could remove AOC in all seasons by biodegradation in warm season and by adsorption and bio-regeneration in cold season since the adsorption by GAC was higher at lower temperature. The advanced treatment can contribute to enhance the biostability in the distribution system by reducing AOCFP and helping to maintain stable residual chlorine after post-chlorination.
Supplementary Information
Acknowledgments
This study was conducted as a part of the research project, “The variation and removal of assimilable organic carbon in drinking water treatment processes” of the Seoul Water Institute (2013–2014) [68]. We would like to thank the other researchers of YWTP and Seoul Water Institute for their helps with operating the processes, sampling, raw water quality analyses and the related advices.