An aerobic granular sludge process for treating low carbon/nitrogen ratio sewage
Article information

Abstract
This study investigated the characteristic of aerobic granular sludge (AGS) process to treat the sewage having low carbon/nitrogen ratio (Biochemical oxygen demand (BOD5):Total nitrogen (T-N), 4.5:1) in sequencing batch reactor (SBR). The removal efficiency of BOD5, suspended solid (SS), T-N and phosphorus (PO43−-P) were 92.6%, 64.3% and 90.1%. Concentration and size of AGS were changed in proportion to the organic matters and nitrogen concentration of the influent (Concentration and size of AGS: 1,700–3,000 mg/L, 0.5–1.0 mm). Mixed liquor suspended solid (MLSS) also changed with the concentration of AGS (MLSS: 2,000–3,500 mg/L). When the settling time was shortened from 15 min to 10 min, size and shape of AGS were maintained (Size of AGS: 1.0–1.5 mm). In addition, the concentration of AGS and MLSS increased (Concentration of AGS: 3,500 mg/L, MLSS: 4,000 mg/L). Concentration, size and shape of AGS were affected the settling time of the reactor more than the concentration of organic matter and nitrogen in the influent. In the results of removal efficiency and changes in AGS, we confirmed that the SBR process using AGS can be used to treat the sewage having low carbon/nitrogen ratio by applying short settling time.
1. Introduction
Sewage treatment is required advanced technology to replace the existing activated sludge process in order to meet the effluent water quality standard which can be strengthened in the future. Recent techniques are preferred for modifying the existing infrastructure, instead of increasing the capacity of the bioreactor or adding machinery, taking into account limited space and economics. The newly constructing sewage treatment facility can reduce the capacity of the bioreactor by decreasing the process time. For example, the method can decline the capacity of the bioreactor by a shortening of settling time [1], simultaneous removal of nitrogen and phosphorus [2], and simultaneous nitrification and denitrification [3].
Aerobic granular sludge (AGS) is a spherical biomass formed by self-immobilization without carriers under aerobic conditions. AGS has been studied to treat wastewater of various characteristics since the late 1980s [4–6], and it is considered as an alternative to replace the existing activated sludge process due to its many advantages [7]. de Bruin et al. [8] reported that the settling velocity of AGS is high so that a separate settling tank is not needed, and the facility area can be reduced by 80%. In practice, there are many cases where AGS is being applied to full-scale facilities overseas [9–11]. The existing activated sludge process has advantages of easy operation and low price, but it has problems such as bulking and rising of sludge. AGS can simultaneously remove biological phosphate and nitrogen by the oxygen gradient in the granule [8]. Also AGS is a promising technology with advantages such as good settling velocity and high biomass [12]. Therefore, AGS technology provides a solution to solve the problems of the activated sludge process. For AGS technology, Tay et al. [13] reported that it is hard to form granules with organic loading rate (OLR) less than 2 kg COD/m3/d. Because there is still an incomplete understanding of the parameters that drive the formation of AGS, some researchers have reported that AGS is not as practical as activated sludge [11, 14]. In addition, it is difficult to find a pilot-scale facility using AGS in Korea.
On the other hand, the biological treatment process is known to have a carbon/nitrogen ratio of about 20:1 for optimum influent sewage under aerobic conditions [15]. However, the average biochemical oxygen demand (BOD5) and total nitrogen (T-N) concentration are 137.9 mg/L and 37.2 mg/L in Korea [16], resulting in a carbon/nitrogen ratio of 3.71. For this reason, it is recognized that it would be very difficult to apply AGS to sewage treatment in Korea.
Therefore, we confirmed the biological treatment efficiency in the pilot scale facility using AGS and observed the morphological changes of the sludge. Furthermore, differences in microbial community between AGS and activated sludge were carried out through pyro-sequencing.
2. Materials and Methods
2.1. Description of the Plant
This study was performed with the pilot scale the AGS process at the K small scale sewage treatment plant in Yongin City of Korea (Fig. 1). As shown in Fig. 2, the pilot plant of this study is divided into equalization tank, bio-reactor, multi-functional tank, and effluent tank, respectively.

Location of K small scale sewage treatment plant.
Schematic diagram of the AGS-SBR process (Equalization tank: 1.5 m W × 3.6 m L × 5.0 m H, Bio-reactor: 4.6 m W × 3.6 m L × 5.0 m H, Multi-functional tank: 3.6 m W × 3.6 m L × 5.0 m H, Effluent tank: 1.5 m W × 3.6 m L × 5.0 m H, (W: Width, L: Length, H: Height)).
The volume of bio-reactor was 75 m3 and the exchange rate was 50%. The operation cycle of bio-reactor was 4 cycle/d for adaptation of AGS, and 6 cycle/d after a start-up period of 60 d. The influent flow rate of bio-reactor was 225 m3/d.
Dissolved oxygen (DO) and pH, which were online monitored, but not controlled along the whole experimental period with Hach-Lange probes, ranged typically from 0.2 to 4.12 mg O2/L and from 6.6 to 7.5, respectively.
The initial concentration of mixed liquor suspended solid (MLSS) in the bio-reactor was 2,000 mg/L and sludge volume index (SVI30) was 50 mL/g. And the AGS larger than 0.2 mm was made in the factory and seeded to the reactor during the start-up period.
2.2. Wastewater Composition
The influent was sewage in the flow control tank of the K small scale sewage treatment plant located in Yongin City of Korea. The average concentration of the influent was BOD5 105.4 mg/L, suspended solid (SS) 49.4 mg/L, T-N 23.4 mg/L and PO43−-P 1.37 mg/L (Table 1). The influent carbon/nitrogen ratio was 4.5:1 (BOD5:T-N).
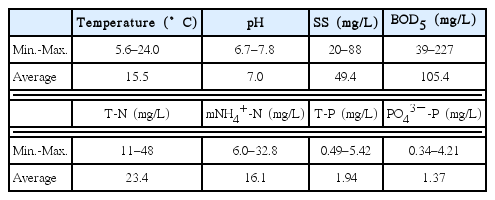
Characteristics of Influent during Operation Time
The concentration of organic matters and nitrogen of the influent remained low during the winter and increased with the growth of temperature after March. After that, it decreased during the rainy season (Fig. 3). The temperature of influent had less than 8°C from December 16, 2015 to February 24, 2016 (Fig. 4).

BOD5, and T-N concentration of influent during operation time.

Temperature of influent during operation time.
2.3. Operating Condition
The bio-reactor was operated as the sequencing batch process mode. The sequencing batch reactor (SBR) has a unique operating feature that is alternating anaerobic/anoxic/aerobic environments to meet the needs of activities of microorganisms so that nitrification and denitrification can occur during the aerobic and the anoxic stage, respectively [17].
A total operation period was from Sep. 1, 2015 to Sep. 30, 2016. During the start-up periods, the time per cycle in the bio-reactor was 60 min for inflow, 240 min for aeration and 60 min for settling & outflow (Phase 1).
After the start-up periods, the time per 1 cycle in the bio-reactor was 60 min for inflow, 120 min for aeration and 60 min for settling & outflow (Phase 2, 3).
During the last two months of an operation period, the settling time was divided into 15 min (phase 2) and 10 min (phase 3) to confirm the settling characteristics of AGS (Table 2).

The Time per 1 Cycle of the AGS-SBR Process
2.4. Analytical Methods
A soluble sample of water quality analysis was filtered by a glass microfiber filter (Whatman; International Ltd., 0.45 mm GF/C). BOD5, T-N, PO43−-P, and solid were analyzed to base on standard methods [18]. The ammonium nitrogen was analyzed by a spectrophotometer (DR-2500, Method 8038, Hach Co., USA). To observe the nutrient treatment efficiency, influent and effluent water quality analysis was conducted five times a week. The morphological characteristics of AGS were observed the changes in size, surface and morphology during the operation period through optical microscope (OLYMPUS CX31) and environmental scanning electron microscope (E-SEM) (Model XL-30 ESEM-FEG, FEI, USA).
To observe the microbial community was performed the pyrosequencing data analysis. The community analysis was performed to determine the characteristics of AGS and the difference in activated sludge. Each sludge was homogenized using homogenizer. The sample was centrifuged to discard the supernatant, and DNA extraction was performed. DNA extraction was performed using FastDNA SPIN Kit for soil (MP Bio, Santa Ana, Calif., USA). Polymerase chain reaction (PCR) (C1000 Touch thermal cycler, Bio-Rad, Hercules, CA, USA) was used 1 microliter of extracted DNA and initial denaturation was performed 95°C for 5 min. After the procedure was followed by 30 cycles of denaturation (95°C, 30 min), annealing (55°C, 30 s), extension (72°C, 30 s), and final extension (72°C, 7 min), respectively, and fixed at 4°C. For successful PCR, the purity of the DNA was increased using QIAquick PCR purification kit (Qiagen, Calencia, CA, USA). Pyrosequencing (454 GS FLX Junior Sequencing System, Roche, Branford, CT, USA) was conducted to using amplified DNA samples.
3. Results and Discussion
3.1. Process Performance of AGS-SBR
The concentration of influent, effluent and removal efficiency of BOD5, SS, T-N and PO43−-P during the operation period were shown through Fig. 5 to 8, respectively. The AGS has substrate gradients, which in turn results in different layered structures with different functions [19–20]. Studies have shown that aerobic and anaerobic metabolic activities can co-exist in the granule, like the simultaneous removal of organic matters, nitrogen and phosphorus [2, 21–22], or simultaneous nitrification and denitrification [23–24]. In this study, the effluent concentration of BOD5 was 4.2–10.4 mg/L, 6.5 mg/L on average and the removal efficiency was 92.6%. T-N showed a low removal efficiency during the winter season because it was influenced by temperature. But the effluent concentration of T-N was not high so it satisfied the discharged effluent standard (BOD5: 10 mg/L, SS: 10 mg/L, T-N: 20 mg/L, Total phosphorus (T-P): 2 mg/L [25]). During the operation period, the effluent concentration of T-N was 2.1–13.1 mg/L, 8.3 mg/L on average, and the removal efficiency of T-N was 64.3%. The effluent concentration of PO43−-P was 0.01–1.28 mg/L, 0.14 mg/L on average and the removal efficiency of PO43−-P was 90.1%. Generally, phosphorus is removed through cell synthesis and sludge removal. A chemical (PAC, Poly-Aluminum Chloride) was also injected into the Multi-functional tank through the line mixer for the phosphorus removal. However, the settleability of the AGS (SVI30: 50–70 mL/g) was better than the activated sludge (SVI30: 50–150 mL/g, [26]); Therefore, the amount of chemical of injection for sludge removal was low (6.01 kg/d). And the effluent concentration of SS was 1–20 mg/L, 5.94 mg/L on average and removal efficiency was 88.0%. The influent concentration of SS was significantly changed and the settling time of the process was short. But because of an excellent settleability of AGS (SVI30: 50–70 mL/g), low effluent concentration of SS could be maintained. Consequently, the effluent concentration of BOD5, T-N, PO43−-P and SS satisfied the discharged effluent standard stably [25].
BOD5 concentration of influent, effluent and removal efficiency during operation time.
SS concentration of influent, effluent and removal efficiency during operation time.
T-N concentration of influent, effluent and removal efficiency during operation time.
PO43−-P concentration of influent, effluent and removal efficiency during operation time.
Increasing the organic concentration of the influent increases size and density of AGS, but it decreases the species diversity within AGS and accelerates the growth of the amount of microorganisms and relatively loose AGS is formed [6]. In this study, the concentration of AGS was increased or decreased according to the change of organic matters and nitrogen concentration in the influent from September 1, 2015 to July 31, 2016 (concentration of AGS: 1,700–3,000 mg/L). Excessive organic load promotes the growth of filamentous microorganisms. Especially, rapid growth of filamentous microorganisms can degrade the settleability of AGS and make it difficult to operate [27].
Settling time has a great influence on the formation of AGS. The SBR with long settling time does not successfully lead to the formation of AGS. Qin et al. [28] operated the SBR under the same conditions (4 h/cycle, 5 min for inflow, 5 min for outflow) except the settling times which were set to 5, 10, 15, and 20 min in four reactors and after an operation period, the ratio of AGS in the reactor was 100%, 35%, 15%, and 10%, respectively [28]. In this study, the settling time was adjusted from 15 min to 10 min from August 1, 2016 to September 30, 2016, to prevent the growth of filamentous microorganisms and successfully form the AGS. Initially, when the settling time decreased, the concentration of AGS was reduced to 2,800 mg/L because the AGS with poor settleability was discharged outside the bio-reactor. Thereafter, the remaining the AGS with good settleability grew in the reactor and the concentration of AGS went up to 3,500 mg/L. As a result, the concentration of MLSS also increased to 4,000 mg/L (Fig. 9).
MLSS and AGS concentration profiles during operation time.
3.2. Microscopic and E-SEM Observations of AGS
Microscopic observations were carried out with an optical microscope. Microscopic observations showed that the size of AGS decreased after seeding. As the concentration of organic matter and nitrogen in the influent increased during May, June and July, the size of AGS increased and the shape of AGS remained denser. After reducing the settling time in August, although the concentration of organic matter and nitrogen in the influent decreased, size and shape of AGS did not change. To summarize, size and shape of AGS were affected by the settling time of the reactor than the concentration of organic matter and nitrogen in the influent (Fig. 10).

Morphology observation of AGS during the operation period using microscope, ((a): October, (b): December, (c): February, (d): April, (e): June, (f): August and (g), (h), (i): Photographs of AGS in final operation day ((g): 0.5–0.6 mm, (h): 0.6–0.8 mm, (i): > 0.8 mm) (×40 magnification by optical microscope)).
The surface and morphology of AGS were observed by using E-SEM. (a), (b), and (c) in Fig. 11 are the AGS which is larger than 1.0 mm in the bio-reactor of this study during the operation period ((a): November, (b): March and (c): July). In the observed images, the shape of AGS was close to spherical. The surface of AGS initially had a rough, irregular and fine-grained porous structure, but gradually turned into a smoother shape during the operation period.

Granule morphology of AGS using E-SEM, ((a): November, (b): March and (c): July).
3.3. Microbial Community Analysis of AGS
The microbial community analysis was performed to confirm the characteristics of AGS and the difference between AGS and activated sludge. Fig. 12 shows the pyrosequencing results of AGS and activated sludge using a dynamic pie chart (Krona). Table 3 is compared the abundance of microbial of phosphorus removal and nitrifying bacteria in AGS and activated sludge. Microbial analysis of the two sludges showed the highest Proteobacteria, and AGS and activated sludge were 45% and 43%, respectively. Betaproteobacteria account for the highest percentage in the Proteobacteria community (37% AGS, and 48% activated sludge). They are known to be dominated in the wastewater treatment process [29]. They are also known to play a role of phosphorus removal [30]. Dechloromonas has been reported to remove as like Accumulibacter [31], and Thauera is known to carry out denitrification but has also been shown to remove phosphorus [32].

The comparison of Accumulibacter in total fraction using dynamic pie chart (Krona). AGS (a) and activated sludge (b).

The Comparison of Microbial Communities in Betaproteobacteria Group
Bactereotides and Chloroflexi are known as anaerobic microorganisms [33], AGS and activated sludge were 30% and 31%, respectively. The microorganisms related to nitrification were 2.0% of AGS and 0.2% of activated sludge in Betaproteobacteria microorganisms. Therefore, AGS was able to identify various microbial communities than activated sludge. On the other hand, this diversity is judged by the difference between AGS size and specific surface area. Because AGS differs in oxygen permeability and concentration gradient depending on particle size [2]. Also the differences in sludge gradient and microenvironment seem to affect the microbial growth environment.
4. Conclusions
In the AGS process using the SBR, concentration and size of AGS were changed in proportion to the organic matters and nitrogen concentration of the influent (concentration and size of AGS: 1,700–3,000 mg/L, 0.5–1.0 mm). MLSS also changed with the concentration of AGS (MLSS: 2,000–3,500 mg/L). When the settling time was shortened from 15 min to 10 min in August, the concentration of organic matter and nitrogen in the influent decreased. However, size and shape of AGS were maintained (Size of AGS: 1.0–1.5 mm). In addition, the concentration of AGS increased (> 3,500 mg/L) as the remaining AGS with good settleability grew in the reactor, meanwhile, the MLSS in the bio-reactor also increased (> 4,000 mg/L). Therefore, size and shape of AGS were affected the settling time of the reactor more than the concentration of organic matter and nitrogen in the influent. The removal efficiency of BOD5, SS, T-N and PO43−-P were 92.6%, 64.3% and 90.1% and the average effluent concentration of BOD5, SS, T-N and PO43−-P (6.5, 6, 8.3, 0.14 mg/L) satisfied the discharged effluent standard [25].
The bacteria related to phosphorus removal in Betaproteobacteria were 9.24% of AGS and 9.15% of activated sludge. Nitrifying bacteria was found to have about 10 times more AGS than activated sludge. The result of microbial community analysis showed that AGS has higher microbial diversity than activated sludge.
In the results of removal efficiency and changes in AGS, we confirmed that the SBR process using AGS can be used to treat the sewage having low carbon/nitrogen ratio by applying short settling time.
Acknowledgments
This subject is supported by Korea Ministry of Environment as “Global Top Project” (Project No.: 2016002190006).