Economic-based approach for predicting optimal water pipe renewal period based on risk and failure rate
Article information
Abstract
This study suggests a method for calculating the benefits of water pipe renewal based on an estimate of the water supply suspension risk. The proposed method based on five benefit items is more direct and specific than other benefit estimation methods. In addition, a methodology evaluating the economics of pipe renewal based on pipe failure rate is proposed for estimating the optimal renewal point from an economic perspective. By estimating the optimal renewal period based on a yearly benefit cost ratio per pipe in a case study area, it was possible to draft an optimal renewal plan for the subject region from an economic perspective. Compared with other methodologies, a reasonable optimal renewal period was derived from an economic point of view. The result of this study may be used to develop future water pipe renewal plans. Moreover, the proposed methodologies and results derived from this study can be applied to asset management plans.
1. Introduction
Over time, underground water supply pipes which installed for efficiency and safety of water supply tend to deteriorate, due to various static, dynamic, and operational factors [1]. The static factors such as pipe diameter and soil characteristics are the conditions that do not change after the installation, the dynamic factors such as loadings and pipe age are the conditions that change after the installation. The operational factors such as water pressure and cathodic protection state that can be changed by the water pipe management method. Therefore, over a long period of time, all countries with buried water supply pipes will inevitably experience problems related to pipe deterioration. If an old deteriorated pipe is left as it is, the problems that can occur include poor water quality, increased friction/pressure loss, pipe breakage and leakage to mention a few. To solve these problems, it is necessary to replace, rehabilitate, or repair the aged pipe in a timely manner.
Table 1 shows the methodologies used by previous studies for estimating the pipe renewal period. These methodologies largely predict the pipe useful life from a physical point of view, which estimates the point at which the useful life is exhausted to the renewal/replacement point, and predicts the pipe breakage rate from a statistical point of view. The method estimates the renewal period as the point in time when the failure rate exceeds the critical failure rate, or the time that minimizes the life cycle cost.

Previous Studies on Finding the Renewal Period and Residual Life of Pipe
If the cost of renewing the water supply pipe and the benefits resulting from the pipe renewal can be quantified as a monetary value, the renewal period can be calculated by analyzing the economic evaluation of the pipe renewal. Table 2 shows previous studies that used an economic perspective to determine the pipe renewal period based on a monetary benefit-cost analysis.
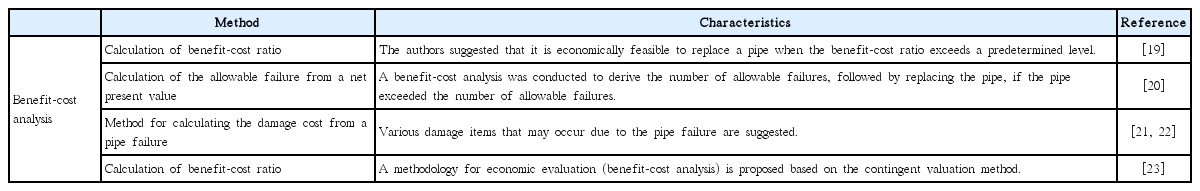
Previous Studies for Finding the Renewal Period from an Economic Perspective
In particular, when a conveyance and transmission pipe is composed of a single line, the damage from a pipe failure can be considerably large. However, as the cost of renewing a large-diameter pipe is substantial, it is necessary to determine the appropriate renewal period. As can be seen from the presented studies, there are various ways to estimate the appropriate pipe renewal time. Among the various methods, the physical approach is based on an actual diagnosis of the pipe. Therefore, this can be considered the most accurate way to calculate the renewal point. However, if insufficient data are available for analysis, distorted analysis results may be derived. Consequently, it is appropriate to use statistical and economical approaches when insufficient data for analysis are available.
In order to understand the economic feasibility of renewing a pipe, a methodology is needed to quantitatively estimate the benefits that would result from the renewal. Gaewski and Blaha [21] and Liu et al. [22] methodologies for quantifying the renewal benefits are suggested. However, they only present benefit items that are generated according to the renewal; no specific method is given for calculating the benefits. In addition, as in the case of Kim et al. [23], the benefits derived from a consumer’s willingness to pay are typically based on survey results. Unfortunately, these results can be affected by the period and region in which the survey was conducted. Consequently, water pipes located in relatively poorer regions may increase the benefit-cost ratio, thereby making the pipe renewal benefits seem uneconomic.
The benefits generated by renewing a pipe can be said to be the same as the damage that occurs when the pipe is not renewed. In addition, the benefits generated through the renewal can be defined by quantifying the effect of the renewal on the monetary value.
Here, the risk of pipe failure can be estimated by multiplying the failure frequency by the damage caused by the failure. The monetary value of the risk can be used to quantify the damage caused by the pipe failure.
Comprehensively, the purpose of this study is to develop a specific method for estimating the benefits of pipe renewal and to determine the renewal timing from an economic point of view. The objectives of this study are summarized as follows:
Develop a risk-based direct benefit measurement model for renewing pipes.
Develop a model for deriving the optimum pipe renewal point through annual economic evaluations.
Conduct a case study using the developed model.
2. Methodology
The method proposed in this study is shown in Fig. 1. After calculating the benefits and costs, respectively, an economic analysis was performed. Here, a substitution cost method based on the water suspension risk, which can be considered a direct method, was used to calculate the renewal benefits. The renewal costs were calculated by considering the unit cost of the renewal. The next step was to conduct a yearly economic evaluation; finally, an optimal renewal period was estimated.
Method proposed in this study.
2.1. Benefits of Pipeline Renewal
Damage, including pipe failure, can occur when deteriorated water pipes are not renewed; this means that renewing pipes can reduce the amount of damage that would otherwise occur. In this study, the expected damage from a single case of pipe failure was calculated, and the benefits of renewal were derived by estimating the number of failures that would be prevented by renewing the pipes.
There are various benefits for renewing a deteriorated pipe, such as reducing the repair cost, reducing the suspension damage cost, reducing the energy needed to run the pump station, reducing the legal and labor costs, increasing the water quality, and increasing the credibility of water service providers [21–23].
The benefits that result from renewing water pipes vary considerably. This study selects the following five specific areas of benefits that can be converted to monetary values to be quantitatively examined and evaluated using a direct methodology. Here’s a limitation of this study. First, Because of data limitations, this study didn’t consider the benefits associated with energy reduction. However, an energy reduction cost due to the pipe renewal is clearly generated. Second, too much friction/pressure loss can cause a pipe to be replaced, and increasing or decreasing water demands can also require replacing a pipe with one of the appropriate diameter. This study did not consider these issues, research related to these issues is necessary to specify the benefit more.
Each item was calculated according to the respective formula presented as follows:
Benefit from a reduction of the repair cost for a pipe failure (BRR)
(1)Benefit from avoiding the damage cost of a living water suspension (BDL)
(2)Benefit from avoiding the damage cost by of a commercial water suspension (BDC)
(3)Benefit from avoiding the damage cost by of an industrial water suspension (BDI)
(4)Benefit from a reduction in social cost (BRS) _ if the pipe is buried under a road
(5)
Replacing a deteriorated pipe with a new one will result in a relatively low probability of failure. This will also reduce the cost of repairing a failure. BRR is considered a benefit in reducing the failure repair cost.
If the probability of failure is reduced, the number of water suspensions due to pipe failure also decreases. BDL, BDC, and BDI show the benefits of lowering the number of living, commercial, and industrial water suspensions, respectively. To calculate the benefit for a BDL, the number of failures that could be reduced was multiplied by the number of people affected by the suspension, the suspension hours, and the substitution cost. Here, the substitution cost is derived from the cost of replacing food and beverage water and washing water for the suspension time. In the BDC case, the cost of adding purified water to the reservoir and store was defined as the substitution cost. In the BDI case, the marginal production value of the industrial water was defined as the substitution cost, and the benefits were calculated.
The social benefit was calculated as the traffic-jam reduction benefit. Vehicles that pass along the road during a failure will have a reduced movement speed. The benefit is calculated by the cost of damage caused by the traffic congestion, as calculated in the report shown in Table 3 [27].
Substitution Costs for Calculating the Benefit
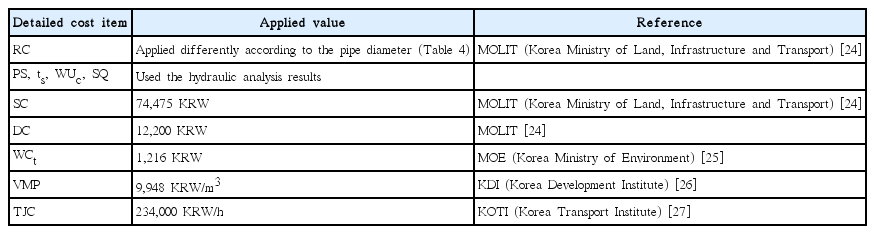
To calculate and predict the benefit, as shown in Eq. (1) to (5), the pipeline failure rate needs to be predicted. As described in Eq. (6), the future failure rate was predicted, based on the failure function of the Cohort Survival Model [11]. This failure rate model utilizes statistical methodologies to estimate future pipe conditions over predetermined amounts of time, based on an analysis of the pipe’s current condition [12]. To build a standardized model of a pipe’s failure history, the failure history of the national multi-regional water supply of the Republic of Korea (Korea) during 1980–2015 was used [28]. The coefficient of the model function was derived by non-linear regression analysis performed using the SPSS statistics software version 24.0 (IBM Corporation).
The water suspension time (ts), the number of people who experience suspension (PS) in Eq. (2) and Eq. (3), the amount of commercial water usage (WUc) in Eq. (3), and the water supply shortage (SQ) in Eq. (4) are calculated by hydraulic analysis. The hydraulic analysis for a pipeline network can be classified as either a demand-driven analysis (DDA) or a pressure-driven analysis (PDA). The PDA methodology simulates the nodal outflow considering the hydraulic pressure of each node. When conducting a PDA, the head and amount of available water supply would be obtained [29]. In this study, the population affected by a water supply suspension, and the period of time over which it occurred, was calculated using the PDA module of the WaterGEMS program. This calculation took into consideration the relationship between available the demand and the required demand, and the reservoir retention volume at the point of failure of each pipe. The power function introduced by Wagner et al. [30], described in Eq. (7), was used to conduct the PDA hydraulic analysis. The value of n was generally set to 0.5. The threshold pressure was set to the normal reservoir level when no failure has occurred.
2.2. Cost for Pipeline Renewal
Kim et al.’s methodology [23] was used to calculate the renewal cost. The costs were divided into construction costs, which can be further divided into construction costs, incidental expenses, and land acquisition costs, and other extra costs. The investigation cost (1.0% of the construction cost), design cost (1.0% of the construction cost), and management cost (5.0% of the construction cost) are composed of incidental expenses.
This study considered the fact that the water supply might not be sufficient for the time required to renew a large-diameter pipe composed of a single line. It is assumed that a dual-line pipe corresponding to 70% of the supply quantity, which can deliver the daily average quantity, was also installed together when renew the pipe.
The basic per-unit construction cost was set according to the pipe diameter and pipe material, as this is the most widely used approach in Korea. To consider price increases over time, an inflation rate of 2.0% was applied to the construction cost per pipe diameter. The duration of a pipe renewal is assumed to be one year.
2.3. Annual Economic Evaluation for Pipeline Renewal
Much like many previous analyses, an economic evaluation indicator was provided via the benefit-to-cost ratio (B/C) defined in Eq. (8). The time frame for analysis was 45 y, with a social discount rate of 5.5% being applied during the first 30 y; the social discount rate was reduced to 4.5% for the remaining 15 y. The benefits were calculated as a cost per failure basis. Thus, although the accumulated benefit, i.e., monetary cost reduction, of performing pipe renewal at each point of failure differed according to the point of analysis, the benefit of preventing a pipe failure did not vary, because the monetary cost was a fixed at a flat price for each year. All remaining factors used in the benefit-cost function were set as described in previous studies [23].
3. Results of Case Study
3.1. Failure Rate Prediction Model
In this study, the failure rate prediction model was developed for steel pipe (SP) and ductile cast iron pipe (DCIP) where data can be obtained. The proposed method can be applied to other pipe materials also, when the actual failure histories are obtained.
The failure rate was estimated in advance, as shown in Fig. 2 and Fig. 3, to calculate the total benefit of the pipe renewal. The failure rate for DCIP was calculated as 0.3354 failures/km/y, which is lower than that for SP (0.4852 failures/km/y). The correlation coefficient of the SP model was 0.9193, DCIP model was 0.8704 which means the model is statistically significant.

Failure rate prediction model for SP.
Failure rate prediction model for DCIP.
This result was based on an investigation of failures occurring over a certain length of pipe. More specifically, the failure rate results were calculated using data from historical failures that raised concerns over a potential suspension of the water supply. As SP tends to be used more often than DCIP in Korea for larger diameter pipes, a water supply suspension caused by their failure would have a greater impact on the corresponding region. Considering this, the history of DCIP failures in this region has shown that few failures were not sufficiently large to threaten a water supply suspension. This is assumed to be the reason why the DCIP failure rate was found to be lower than that for SP.
In summary, the analysis results at the present time show that the failure rate of DCIP is lower than that of SP; however, results of analysis based on new data accumulated in the future may lead to different results from the analysis results at present.
3.2. Description of Case Study Area and PDA Analysis
The subject of this case study is the “K” multi-regional water supply system depicted in Fig. 4. The multi-regional water supply in Region K supplies 68,732 m3/d of purified tap water to K City, an industrial city with about 250,000 residents in 2015. K City has two national industrial complexes related to the shipbuilding industry, depicted as S industry and D industry in Fig. 4. The SD2, and DM water supply areas are mainly residential areas and the IW water supply area is a concentration of tourist complexes. The YJ, SW water supply areas are densely packed shopping district areas. The other water supply areas cover the small-scale factories.
Case study area (K multi-regional water supply).
Since the city specializes in shipbuilding and other industries related to the steel industry, many residents are concerned about that the transmission pipe consists of a single-line. The multi-regional water supply pipe of Region K was installed over 30 years ago and has experienced 32 failures over its period in use. The total pipe length is 69.967 km.
According to the law in Korea, a large-diameter water supply pipe should be regularly diagnosed for safety once every five years. The diagnostic results are expressed in five grades, as shown in Table 5. A safety diagnosis was conducted on the multi-regional water supply pipe of Region K in 2010. The result showed a Grade C for the pipes, indicating that they require replacement. As a result, measures have been taken to increase the amount of emergency storage in the industrial area. However, the fundamental solution, renewing the pipe, has not been done.
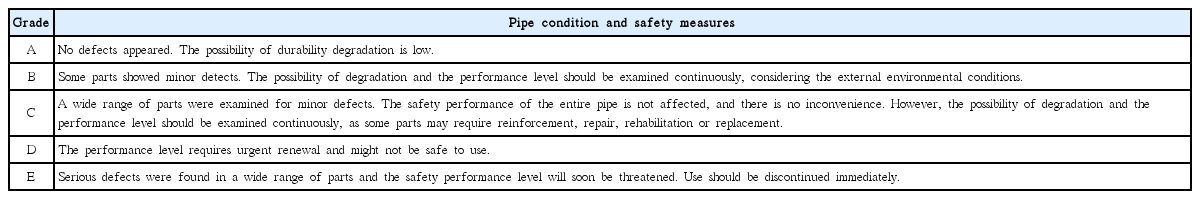
Grades for Diagnostic Results in Korea
Fig. 5 depicts the region that experiences water failure when Pipe A2 fails, and provides an estimate of the amount of damage. The results show that the SD1, SH, and SD2 supply areas are predicted to be severely affected by a suspension. The remaining supply areas are not predicted to experience any damage because of auxiliary services by a G purification plant and/or a reservoir. In addition, the total damage cost resulting from the Pipe A2 failure is estimated at 384,713,000 KRW (approximately $380,000).
Result of PDA (Example of A2 pipe failure).
3.3. Results of Benefit and Cost Determination in Case Study Area
As shown in Fig. 5, the benefits of renewing the other individual pipes were calculated. Based on the amount of suspended water, the cost of a single failure per major pipe (A2, B2, D2, M2), as determined by PDA, is presented in Table 6. Note that the failures of Pipes A2 and B2, located in the upper area of the supply pipe would result in a wider ranging suspension of the water supply; this implies an increased cost. However, water passing through Pipes A2 and B2 partially supplies industrial areas, which have a relatively high average water retention volume. Consequently, although a water supply suspension in industrial areas can result in moderate damage, suspension does not occur when Pipe A2 or B2 fails. Thus, the BDI was set as 0.
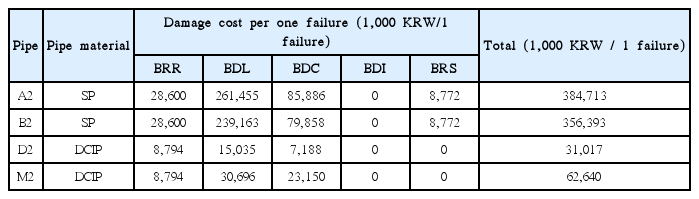
Damage Cost for One Failure (Examples of Pipe A2, B2, D2, M2)
Because the failure rate and the extent of damage resulting from a water supply suspension are dependent on the individual pipe location within the pipeline network, the benefit cost ratio differed for each pipe. Pipes A2 and B2 showed higher benefits than pipes D2 and M2. The D2 and M2 pipes are located at the end of the network, relative to the A2 and B2 pipes; thus, their costs are small because the absolute amount of suspension damage due to a water supply suspension is small.
Fig. 6 and Fig. 7 show the total benefit and cost, respectively. Fig. 6 shows that the benefits of renewing Pipes A2 and B2 cease to increase after a certain period of time. Conversely, the costs associated with these pipes continue to increase over time as a result of inflation, as shown in Fig. 7. In terms of the benefit cost ratio for Pipes A2 and B2, as can be seen in Fig. 8, this ratio initially increases before reaching a peak and decreasing as the renewal period is delayed.

Annual forecasting of benefit results (Examples of Pipe A2, B2, D2, M2).

Annual forecasting of cost results (Examples of Pipe A2, B2, D2, M2).
Annual forecasting of benefit cost ratio results (Examples of Pipe A2, B2, D2, M2).
Shamir and Howard [9], Shin et al [15], and Park and Loganathan [17] have used predictions that show infinite increases in future failure rates. The point at which the resulting benefits are greater than the cost is called the appropriate renewal period from an economic point of view. However, since this study utilizes the prediction result in which the future failure rate converges to a certain value, the benefit increase converges from a certain point of time, while the cost increase continuously increased, and the benefit cost ratio is decreases after reaching the peak point.
3.4. Optimal Renewal Period of the Case Study Area
This observation suggests that, from a purely economic perspective, it would be optimal to renew Pipe A2 in 2045, and Pipe B2 in 2046. In addition, in the case of A2, it is reasonable from an economic point of view to implement renewals after 2033, because at that point, the benefit cost ratio of renewing A2 is more than 1.0.
It should be noted that the decrease in the benefit cost ratio is because the failure rate estimation model used in this study shows the benefits associated with each pipe converging to some value after a certain period of time following the renewal.
Fig. 8 shows that there is no economically feasible period to renew Pipes D2 and M2. Therefore, their optimal renewal time can be determined based on their service life. In this study, the service life of SP and DCIP was set to 40 y. To consider the optimal renewal period, Fig. 9 illustrates the optimal time for pipe renewal and an economically feasible renewal period for the individual pipelines of the multi-regional water supply of Region K. The results obtained from yearly benefit cost analyses indicated that, from an economics perspective, Systems D, H, M, and N required immediate renewal to maintain a sustainable water supply.

Optimal time for renewal and economically feasible period (case study area).
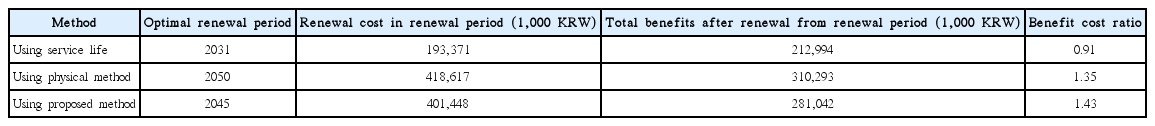
The A2 pipe is located at the upper part of the water supply, therefore it can be said that the damage range due to the pipe failure is relatively larger than others. The A2 pipe was installed in 2001, and the optimum renewal period derived from the suggested method is 2045. At this time, the benefit cost ratio is 1.43.
In Korea, the service life of water pipe is set to 30 y according to the law. If the A2 pipe is replaced in 2031, 30 y after the installation, the benefit cost ratio is 0.91 which is smaller than 1.0. That is, the cost of renewal is larger than the benefit.
The following is the prediction result of renewal period of A2 pipe using the safety factor proposed by Deb et al. [4]. Depending on the method by Deb et al. [4], which considering the stress acting on pipe and residual strength, Fig. 10 shows the change in safety factor of A2 pipe over time. Here, the stress was obtained based on the results of the safety diagnosis conducted in 2010. And the remaining strength of pipe was calculated using the relational equation between the corrosion rate of pipe and residual strength as shown in Eq. (9) proposed by Bae et al. [6]. The corrosion rate of pipe was calculated by the expected results of the corrosion depth by pipe age and pipe thichness. Kim [31] developed a corrosion depth prediction model using the results of the safety diagnosis of the large-diameter pipes in Korea. This study used a corrosion depth prediction model developed by Kim [31] as shown in Eq. (10).
Safety factor prediction of A2 pipe.
In general, if the safety factor is less than 1.0, then the proper renewal period of the A2 pipe is 2050. The benefit cost ratio for replacing the A2 pipe in 2050 is 1.35.
Table 7 shows the result of finding renewal period by three methods (using service life, using physical method, using proposed method). From the economic perspective, the proposed method in this study showed the most reasonable results.
Comparison of Results of Finding Renewal Period (Example of pipe A2)
3.5. Optimal Renewal Period of the Case Study Area under Water Demand Changes
As described in Methodology, this case study did not consider changes in the water demand. However, as can be seen from Balogun et al.’ study [32], an increase or decrease in the water demand may require a pipe renewal, irrespective of the economic efficiency. Changes in water demand should be considered when establishing a renewal plan.
The followings are the results of estimating the optimal renewal period when the water demand in the case study area from 80% to 120% of the current water demand. The current capacity of each reservoir is assumed to be unchanged. The results for the major pipe A2 and M2 are shown in Fig. 11 and Fig. 12.
Optimal renewal period of A2 pipe by water demand.
Optimal renewal period of M2 pipe by water demand.
As can be seen in Fig. 11, the optimal renewal period of water pipe was not related to the water demand changes. That is, the point at which the benefit cost ratio is maximum is fixed. This can be attributed to the convergence of the pipe failure prediction model used in this study.
However, the reasonable renewal period, the benefit cost ratio is larger than 1.0, was changed by water demand. If the amount of water demand is large, the damage range due to pipe failure is large. Therefore, as water demand increase, the benefit become larger. Since the size of the benefit changes in fixed costs, it can be understood that the appropriate renewal period also changes.
Fig. 13 compares increasing water demand according to an actual development plans in case study area and not considering the development plans. From 2020 to 2030, there will be 21 development projects in case study area and amount of 36,000 people will expected to increase. As shown in Fig. 11, the optimal renewal period of the A2 pipe is independent of water usage. However, the reasonable period to make renewal was advanced from 2033 to 2029.

Optimal renewal period of A2 pipe considering future demand increase by development project.
4. Conclusions
In this study, to determine an optimal pipe renewal period from an economic perspective, a methodology for calculating the benefit of pipe renewal and an economic evaluation was suggested.
The key results and findings from this study were as follows:
Five risk-based benefit items for direct and specific benefit measurement model for renewing pipes were developed. The benefits of water pipe renewal were determined by estimating the failure rate of individual pipes, and then using the results to evaluate the risk of water supply suspension by a PDA. The proposed methodology was meaningful in that it embodied the benefits of pipe renewal.
Regarding the failure rate prediction, the correlation coefficient for the estimated and actual failure rates exceeded 0.85; this result indicates that the failure prediction model developed in this study yields results that are comparable to actual pipe failure trends.
A model for deriving the optimum pipe renewal point through an annual economic evaluation was developed to determine an optimal pipe renewal period. Applying the developed model to the case study area confirmed the applicability of the model.
By estimating the optimal renewal period based on a per-pipe yearly benefit cost ratio, it was possible to draft an economic-based optimal pipeline renewal plan for a particular region. Although the case study was conducted for the K region in Korea, it is believed that the methodology proposed in this study can be applied in all regions where the data used in this study can be obtained.
Meanwhile, this study has the limitations, as described in methodology related to data acquisition, additional research considered necessary for the relevant parts.
Finding the optimum renewal period of water pipes can be said to be the core of water pipes asset management. Consequently, the methodology and results from this study can be applied to supplement and complement the development and maintenance of an asset management plan for pipeline maintenance.
Acknowledgments
This work was supported by the 2017 Research Fund (201704251093) of the University of Seoul, Republic of Korea.
Nomenclature
FRWO
pipeline failure rate without renewal (failure/km/y)
FRWI
pipeline failure rate with renewal (failure/km/y)
L
pipeline length (km),
RC
repair cost per pipeline failure (KRW/failure)
PS
people who experienced suspension (people)
ts
water suspension time (h/failure)
SC
substitution cost of living water per 1person (KRW/person/d)
WUc
amount of commercial water use (m3/d)
DC
operation cost of water appendix vehicle (KRW/m3/failure)
WCt
cost of tap water (KRW/m3)
SQ
water supply shortage (m3/failure)
VMP
value of marginal product (KRW/m3)
trr
repair time (h)
TJC
cost of traffic jam (KRW/h/failure)
FRi
pipeline failure rate of pipe material i (failure/km/y) (i=1 : SP, i=2 : DCIP)
ai
aging factor of pipe material i (y−1)
bi
aging factor of pipe material i (y−1)
ci
Retention time of pipe material i (y)
t
Pipe age (y)
qjavi
available demand at node j (m3/d)
qjreq
required demand at node j (m3/d)
Hjavi
head at node j (m)
Hjmin
minimum head at node j (m)
Hjdes
threshold head at node j (m)
Bt
benefit at t year (KRW/y)
Ct
cost at t year (KRW/y)
r
social discount rate (%)
σstrength
residual strength (N/m2)
Pc
corrosion rate (%)
d
coefficient
e
coefficient
DSE
corrosion depth (mm)
f1
pipe-soil potential difference(−mV)
f2
water contents (%)