Application of hybrid material, modified sericite and pine needle extract, for blue-green algae removal in the lake
Article information
Abstract
The present study assessed the efficient removal of nutrients and Chlorophyll-a (Chl-a) by using methyl esterified sericite (MES) and pine needle extracts (PNE), a low cost and abundant green hybrid material from nature. For this purpose, the optimal conditions were investigated, such as the pH, temperature, MES and PNE ratio, and MES-PNE dose. In addition, a Microcystis aeruginosa control using MES-PNE was also analyzed with various inhibition models. The removal of the nutrient and Chl-a onto MES-PNE was optimized for over 95% removal as follows: 2–2.5 for the MES-PNE ratio, 7–8 pH and a 22–25°C temperature. In this respect, approximately 1.52–2.20 g/L of MES-PNE was required to remove each 1 g of dry weight/L of Chl-a. Total phosphorus (TP) has a greater influence on the increase in Chl-a than total nitrogen (TN) according to the correlation between TN, TP and Chl-a. Moreover, the Luong model was the best model for fitting the biodegradation kinetics data from Chl-a on MES-PNE from lake water. The novel hybrid material MES-PNE was very effective at removing TN, TP and Chl-a from the lake and can be applied in the field.
1. Introduction
In recent years, harmful algal blooms in major rivers in Korea have become a threat to the river ecosystem. The Korean government has built many dams on the nation’s four major rivers, which has caused the river flow rate to decrease. Parts of these rivers have become eutrophic reservoirs. As a result, the concentration of algae in the four major rivers has increased tremendously over the last three years [1]. Algae are aquatic plants that contain chlorophyll, and they are photosynthetic micro-organisms. Algae exhibit explosive growth rates when environmental factors, such as the light and nutrients, are suitable. In Korea, the dominant alga depends on the season, from autumn to spring (diatoms), from late spring to early summer (green algae) and from summer to autumn (blue-green algae, cyanobacteria). The four species of blue-green algae known as Microcystis, Anabaena, Aphanizomenon and Oscillatoria are controlled because of the algal blooms in Korea. These algae are very active at temperatures above 22°C. Microcystis aeruginosa (M. aeruginosa) is the representative blue-green alga that causes summer algal blooms, and it is commonly found in fresh water, such as lakes or reservoirs. It causes microcystin and saxitoxin toxicity [2]. There have been very few reports of specific damage from microcystin toxicity in Korea. However, animals reportedly died from microcystin toxicity for the first time in Australia in 1878, and since then, microcystin toxins have caused livestock and wildlife damage in many parts of the world [3]. In addition, an increase in algal blooms decreases the dissolved oxygen in the water due to the photosynthetic activity of the green algae, which can adversely affect the growth of fish and aquatic organisms [4]. Thus, M. aeruginosa control is an important issue for healthy ecosystem conservation.
Previous studies have reported various methods for eliminating M. aeruginosa. For example, there is a method of dissolving water molecules (H2O) into ultrafine particles (plasma) using electrolytic decomposition [4], a coagulation/flocculation method using iron salts or aluminum-based chemical flocculants [5, 6], and ultrasonic waves to destroy green algae [7]. However, these methods have high energy costs, they flush toxic chemical coagulants into ecosystems, the flocculants/coagulants are costly and the removal rates are ultimately low due to the large treatment areas. To overcome these shortcomings, eco-friendly treatment technologies for removing M. aeruginosa using aquatic plants and food chains in aquatic ecosystems have been suggested. The number of blue-green algae-feeding predators is artificially increased to eliminate blue-green algae, which is considered to be the best algae removal and prevention technology in the long term [6]. However, it takes a great deal of time and is also costly because it requires long-term ecological surveys to identify problems that may arise when a large number of artificially induced algae have increased. The most commonly used method in Korea is to spray loess into the lakes. This method can remove both nutrients and microalgae at the same time with adsorption by micropore loess particles [8, 9]. However, the surface of natural clay minerals has a negative charge. The negatively charged surface of natural clay inhibited the adsorption of negatively charged microalgae. As a result, the removal effect is very low and it is difficult to manage the water quality and control the blue-green algae efficiently. Therefore, it is necessary to develop a natural and ecofriendly algal control agent that does not lead to secondary pollution and bio-toxicity.
In this study, sericite was used as a clay mineral; it is aluminum silicate clay with potassium as its primary cation. The basic crystal structure consists of three layers, including two tetrahedral layers and one octahedron layer, with K+ and OH−, Fe and Mg between the layers. The K+ between the sericite layers has cation exchange ability [10]. When Al3+ is substituted for Si4+ at the tetrahedral site, the cation binds to the electronegative site because it is electrically negative. These properties are determined by the layer charge, the specific surface area, the particle size and the affinity with water. Nutrients and heavy metal ions are removed by the ionic adsorption and exchange of alkaline earth metals in the sericite plate structure [1]. In general, the surface charge of clay minerals is negative [11]. Therefore, the removal rate for nutrients and harmful algae, which are negatively charged, is very low when they are removed by using clay minerals. Thus, in this study, natural sericite was modified through methyl-esterification to a negatively charged surface that was changed to positive for the effective adsorption and removal of nutrients and harmful microalgae. In addition, methyl-esterified sericite (MES) and pine needle extract (PNE) were mixed to increase the M. aeruginosa removal. PNE contains a large amount of essential oil components, such as α-pinene, β-pinene, and camphene; flavonoids, such as quercetin and kaempferol; and polyphenol compounds, such as resins. It is known that pinene, which is the primary component of pine needles, inhibits the growth of microorganisms. Terpinene, camphene and limonene are antiviral, phellandrene is a strong insecticide, and bornylacetate is antifungal and anti-inflammatory [12]. Moreover, PNE contains a large number of natural polyphenol compounds, including tannic acid.
To remove the green algae from the lake effectively, it is necessary to remove the nutrients that cause the algal bloom at the same time as the green algae. Because the green algae are removed from the lake without removing the nutrients, the algae blooms reappeared. Therefore, it is essential to remove both nutrients and green algae from the lake at the same time if possible. Thus, the aim of this study was to remove the nutrients and harmful green algae from a lake by using MES-PNE. For this purpose, the optimal conditions for the growth control of Chlorophyll-a (Chl-a) from M. aeruginosa and nutrient removal by mixing PNE with MES was investigated using factors such as the pH, temperature, MES-PNE ratio, and MES-PNE dose. In addition, the M. aeruginosa control using MES-PNE was also analyzed with various inhibition models.
2. Materials and Methods
2.1. Materials
2.1.1. Characteristics of the sample water
In the experiment, surface water was collected from Yeojoobo in Korea. The characteristics of the water samples are represented in Table 1. At the time of sampling, the river water was visually marked in green. The pH of the water was 7.7–9.2 and the temperature was 23 ± 1°C. The pH was higher than that of normal stream water. Severe algal blooms often appear when the flow rate is slow or the temperature increases in the summer. When the algal blooms increases, the dissolved oxygen decreases rapidly in the water due to the photosynthesis of the microalgae. The bloom leads to pH increases due to the decreasing CO2. International organizations, such as the United Nations (UN) and the Organization for Economic Co-operation and Development (OECD), determine water eutrophication based on the total phosphorus, total nitrogen and Chl-a concentration. According to these international water standards, the Chl-a concentration is classified as 0–1, 1–2.5, 2.5–8, 8–25 and over 25 mg/m3 for ultra-oligotrophic, oligotrophic, mesotrophic, eutrophic and hypertrophic categories, respectively [13]. The average Chl-a of the sampling water was 62.3 mg/m3, which was a severely hypertrophic condition. An analysis of the sampling water determined that M. aeruginosa accounted for more than 95% of the algae, and Anabaena, Aphanizomenon and Oscillatoria made up small portions of the algae.

Characteristics of the Sample Water
2.1.2. Pine needle extracts (PNE)
Pine needles were collected from pine trees in the mountainous area of Gangneung city, in Korea. The pine needles were washed several times with distilled water to remove any pollutants, and then they were cut into small 2 cm pieces. The cut pine needles were dried in an oven (SJP-125DO, Sejong Scientific, Seoul, Korea) for 8 h at 105°C and then pulverized. Ten g of the pulverized pine needles was mixed with 100 mL of 80% ethanol and then extracted with an ultrasonic wave extractor (JYD-US01, Shenzhen Jiayuan Technology Co., Ltd., Guangdong, China) at 20-kHz for 120 min. The PNE was filtered at 0.45 μm (Whatman, USA) and stored in the refrigerator for further use.
2.1.3. Methyl-esterified sericite (MES)
The major components of sericite (Ohken Co., Ltd., Japan) are SiO2, Al2O3, Fe2O3, CaO and MgO, among which SiO2 and Al2O3 make up approximately 68–80%, depending on the sericite production area. In this experiment, a 40–60 μm-sized powdered sericite clay mineral was used for nutrient and M. aeruginosa adsorption. The sericite powder was washed several times with distilled water to remove organic pollutants and dried at 80°C for 24 h to remove the moisture. In a 250-mL Erlenmeyer flask, 2 g of dried sericite was added to 200 mL of HCl containing 2% (v/v) methanol, and the mixture was stirred at 80°C, 150 rpm for 10 h. After 10 h, the suspension was centrifuged at 1,500 rpm (628 g), and the supernatant was discarded. The same procedure was repeated three times with fresh solution each time. After the modification, the MES was washed with distilled water, dried at 80°C for 24 h, and stored in a desiccator for use in the experiments.
2.2. Experimental Design
The effects of nutrient and Chl-a removal onto MES-PNE were investigated in relation to various parameters, such as the pH, temperature, MES and PNE ratio, and MES-PNE dose. The experiment was performed in the form of a batch-test. Various amounts (0–500 mg/L) of MES-PNE were added to 1 L of lake water according to the experimental plan using variables, such as different ratios and concentrations. The mixture was agitated at 100 rpm for the first 5 min and then slowly stirred at 80 rpm for 20 min. After the reaction, the MES-PNE in the lake water was allowed to stand for 20 min, and then the removal efficiencies of Total nitrogen (TN), Total phosphorus (TP) and Chl-a were measured. The pH was modified from 2 to 10 using 0.5 mol of NaOH and HCl. The temperature range was controlled from 15°C to 30°C with consideration of the fact that the algal bloom phenomenon generally occurs during the summer season. Mixing ratios of MES and PNE from 0.5:1 to 15:1 were used to optimize the TN, TP and Chl-a removal. All the experiments were performed by changing one parameter at a time while holding the others constant.
2.3. Analytical Methods
The qualitative and quantitative analyses of the inorganic components contained in MES and sericite were performed using X-ray fluorescence (XRF-1500, Shimadzu, Japan), and the PNE composition was analyzed by Gas Chromatography (GC-2010AF, Shimadzu, Japan). The particle size was measured using a particle size analyzer (Laser Diffraction Master Class 3 & 4, Malvern, England) and the amount of MES was measured with an electronic balance (XP26, Mettler Toledo, Switzerland).
To analyze the Chl-a, 500 mL of reaction water was filtered with a GF/F (0.45 μm, Whatman) filter, then the moisture was removed, and the pigment was extracted with 90% acetone for 12 h under dark/cold conditions. The extracted chlorophyll was converted to the Chl-a value after measuring the absorbance using a fluorescence analyzer (TD-700, Turner Designs). The Chl-a concentration in the extract was calculated by reading the absorbance (A) of the pigment extract in a spectrophotometer at a given wavelength against a solvent blank using Eq. (1) as follows:
The Chl-a removal was calculated after measuring the Chl-a using Eq. (2) as follows:
where Chl-a1 is the optical density of samples taken at time zero, and Chl-a2 is the optical density at time t.
The specific growth rate (μ (h−1)) was calculated using Eq. (3)
where X1 and X0 are the biomasses of M. aeruginosa in g/L at time t1 and time t0, respectively.
To analyze the M. aeruginosa growth rate, inhibition models, such as the Haldane, Double exponential, Edwards, Luong, Webb, Moser and Teissier, were used.
The yield Yx/s (g dry weight/g substrate) was calculated using Eq. (4),
where XM and X0 are the maximum and initial dry cell concentrations and SM and S0 are the substrate (here MES-PNE) concentrations at the maximum and initial concentrations.
The TP and TN were obtained photometrically by using a spectrophotometer (UV-Vis 1240, Tecator Co., Germany). The experiments were performed seven times, and the mean values and standard deviations were calculated.
2.4. Statistical Analysis
The data presented in the tables and figures are the mean values ±3.σ of five replications. Where error bars are not visible, the errors were smaller than or equal to the symbols. The differences between the mean values were calculated using Tukey’s test at the 0.05 level with Origin software (v.7.5, OriginLab, Northampton, MA, USA).
3. Results and Discussion
3.1. Characteristic of the Materials
3.1.1. Pine needle extracts
The pH of the PNE was within a range from 4.5–5.1. The major components of the PNE were 58.1%, 19.6%, 13.3%, 3.75%, 2.93%, 1.3% and 0.6% for moisture, carbohydrates, cellulose, protein, crude fat, essential oil and ash, respectively. In addition, PNE contains 534.50 mg% of potassium, 329.01 mg% of calcium and 88.65 mg% of magnesium as inorganic components (Table 2). The primary components of the essential oil were α-pinene, β-pinene, camphene, flavonoids, and resins, such as quercetin and kaempferol in PNE. These components have been reported to have antibacterial and microbial growth inhibitory effects [14]. The major components of phytoncide (which is an antibacterial substance in pine) are α, β-pinene, β-myrcene, limonene, phellandrene, and bornylacetate. It also contains dozens of minor constituents, such as terpenoids, polyterpenoids and phenols. Pinene, a major component of pine needle essential oil, inhibits the growth of microorganisms, while terpinene, camphene and limonene are antiviral and anti-inflammatory [15]. In addition, phellandrene has a strong insecticidal effect, and bornylacetate is known to have anti-fungal and anti-inflammatory effects [12]. Previous studies reported that PNE has antimicrobial activity against gram-positive bacteria (Bacillus subtilis, Listeria monocytogenes, Staphylococcus aureus, etc.), and gram-negative bacteria (Escherichia, Shigella sonnei, and Salmonella typhimurium, etc.) [16, 17].
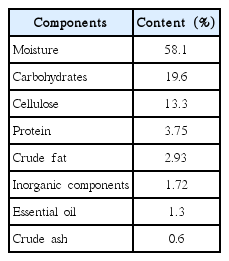
Components of Pine Needle Extract
3.1.2. Methyl-esterified sericite (MES)
The primary components of sericite are oxygen (O), silicon (Si), aluminum (Al), potassium (K) and trace elements. According to the MES and sericite analysis, the O, Si, K+ and Mg2+ contents of the MES were decreased by 5.51%, 3.67%, 1.46% and 0.49%, respectively, compared with the sericite, while the Al3+ and Fe3+ in the MES increased by 8.02% and 1.94%, respectively (Table 3). The Mg2+ and K+ ions are the most easily exchanged cations compared to Fe3+ and Al3+. In other words, both the Al3+ and Fe3+ ions are slowly leached out during methyl-esterification relative to the Mg2+ and K+ ions. The increase in Al3+ and Fe3+ ions on the MES surface was due to the Al3+ and Fe3+, which were excited in the sericite inner layer and moved to the sericite surface during the methyl-esterification. Thus, the functional groups of ≡Al- and ≡Fe- are formed on the surface of sericite after methyl esterification. The increase in ≡Al- and ≡Fe- functional groups on the sericite surface may facilitate the adsorption of microalgae and nutrients depending on the oxygen anion adsorption activity.

Surface Element Analysis and Textural Properties of Sericite and MES
Table 3 represents the measurement results for the BET-specific surface area, pore volume and pore size of sericite and MES. The pore volume of sericite was markedly increased after methyl-esterification, and the specific surface area also increased significantly from 14.45 to 67.62 m2/g. In particular, the Cation Exchange Capacity (CEC) increased by 57.87% from 1.07 to 2.54 meq/g after methyl-esterification. The increase in the CEC and specific surface area after the modification of clay minerals can be found in the previous studies. Bhattacharyya and Gupta [18] reported that the specific surface area increased by 12% after activating montmorillonite with sulfuric acid. Lalhmunsiama et al [11] reported that the specific surface area of sericite increased from 13.65 to 62.92 m2/g after the acidic activation of sericite. When methanol was added during acid activation, the modification rate was 1.5 times faster than it was without methanol. Moreover, Zamparas et al [19] reported that the specific surface area increased by 38% after the acid surface activation of bentonite. These results suggested that there was an active ion exchange between K+, Mg2+ and other ions. More detailed data on MES are given in the literature [1].
3.2. Parametric Study
3.2.1. Comparison of TN, TP and Chl-a removal by sericite, PNE, MES and MES-PNE
The removal efficiency of TN, TP and Chl-a by sericite, PNE, MES and MES-PNE was investigated, and the results are shown in Fig. 1. The removal of TN, TP and Chl-a from sericite was lower compared with MES and MES-PNE and found to be at 20%, 23% and 24%, respectively. In general, the surface of the clay minerals is negatively charged, and the surface negative charge of sericite seems to have inhibited the adsorption of anionic nutrients and negatively charged microalgae. However, the MES, which included a positively modified sericite surface with methyl esterification, showed a high removal rate of 95% for TN, 96% for TP and 75% for Chl-a. Compared with the untreated natural clay mineral sericite, the removal efficiency increased by 75% for TN, 73% for TP and 51% for Chl-a. This finding indicates that the positively charged MES efficiently adsorbed the negatively charged nutrients and microalgae. Because of this increase in the removal efficiency, many researchers previously modified clay minerals to remove heavy metals, nutrients, and microalgae [1, 11, 18–20]. The removal of TN and TP with PNE was almost negligible, but Chl-a showed a high removal efficiency of 90%. It appears that the microbial growth was inhibited through the sterilization action of the PNE, and the microalgae died over time. Moreover, MES-PNE was determined to have very high removal efficiencies of TN 95%, TP 96% and Chl-a 98%. The removal of TN and TP with MES-PNE was similar in comparison with the MES, but the Chl-a removal increased by 23% and 8%, respectively, compared to MES and PNE. This finding may be because MES adsorbed TN and TP effectively in aqueous solution. As a result, it leads to insufficient nutrients for the growth of microalgae, and it was slowed for microalgae growth. Furthermore, it is believed that the microbial killing rate is accelerated with the sterilization effect of PNE. In other words, the removal of Chl-a was increased with the removal of nutrients from MES, and the removal efficiency of Chl-a was further increased by the addition of antibacterial and microbial growth inhibition-affected PNE. Therefore, the removal efficiency of TN and TP with MES-PNE was not significantly different from that of MES alone, but the Chl-a removal efficiency could be improved with a synergistic effect.
Efficiency of TN, TP and Chl-a removal with sericite, MES, PNE and MES-PNE (pH 7.5 ± 2, T: 25°C, mixing time: 30 min, and mixing rate: 80 rpm).
3.2.2. Effect of the MES and PNE ratio
To investigate the optimal mixing ratio between MES and PNE, the experimental conditions were fixed at pH 7, temperature 25°C, a mixing time of 30 min and a mixing speed of 80 rpm for the efficient removal of Chl-a, TN and TP. The results indicated that until a 0.3 MES to PNE ratio was reached, the removal of Chl-a reached approximately 78%, but the removal of TN and TP was found to be less than 50% as shown in Fig. 2. Increasing the ratio of MES to PNE, that is, an increase in the amount of MES in aqueous solution caused the removal efficiency of TN, TP, and Chl-a to increase as well. This phenomenon showed that the adsorption capacity increased with the increasing amount of adsorbent. For the 2–2.5 MES to PNE ratio, the removal of TN, TP and Chl-a reached 95%, 96% and 98%, respectively. However, at up to an MES: PNE ratio of 4, the removal of TN, TP and Chl-a did not change. It is clear that an equilibrium state has been reached between the adsorbate and the adsorbent. Therefore, in considering the removal efficiency of TN, TP and Chl-a, the optimal mixing ratio of MES and PNE is 2–2.5:1.

Removal of TN, TP and Chl-a at various MES and PNE ratios (pH 7.5 ± 2, T: 25°C, mixing time: 30 min, and mixing rate: 80 rpm).
3.2.3. Effect of the pH
The effect of the pH on the removal of TN, TP and Chl-a using MES-PNE is an important factor that determines the field applicability of MES-PNE. The pH was changed from 5 to 10 using HCl and NaOH in view of the pH in the lake for the removal of TN, TP and Chl-a. As a result, the removal percentages of TN, TP and Chl-a reached 84.3%, 83.2% and 85.4% at pH 5, respectively (Fig. 3(a)). At greater than pH 7, the removal efficiency of TN, TP and Chl-a was not significantly changed and the maximum removal efficiency reached 91.06% for TN, 95.12% for TP and 93.2% for Chl-a at pH 8. The lower adsorption of MES at an acidic pH is due to the presence of excess H+ ions that were competing with the cation groups on the MES for the adsorption sites. At a higher solution pH, the MES was positively charged, and it enhanced the negatively charged anions through the electrostatic forces of attraction. Therefore, the optimum pH for removing TN, TP and Chl-a using MES-PNE was pH 7. The pH of a typical natural lake is between 7 and 8.2 [21]. Algal blooms caused increased pH values in the lake. This increase occurs through the photosynthesis of green algae. Therefore, in the case of lakes with algal blooms, the pH was 7.7–9.4. It is difficult to control the pH of a lake artificially. If it is possible, many chemicals must be used. The large amount of chemicals needed to control the pH of the lake has previously caused a negative impact on the ecosystem. Therefore, the pH effect is significantly important for TN, TP and Chl-a removal. Previous studies reported that the polyphenol compounds in PNE are most active at a neutral pH [14]. As a result of this experiment, α, β-pinene, β-myrcene, limonene, phellandrene and bornylacetate, which are the major antimicrobial substances in PNE, are activated at neutral or weakly alkaline pH values rather than acidic ones for green algal removal. The removal of the green algae from the lake using MES-PNE is economically advantageous because it can be applied in the field without needing to control the pH.
(a) Removal of TN, TP and Chl-a at different pH values (T: 25°C, mixing time: 30 min, and mixing rate: 80 rpm, MES/PNE ratio: 2:1). (b) Effect of the temperature on the TN, TP and Chl-a removal (pH 7.5 ± 2, mixing time: 30 min, and mixing rate: 80 rpm, MES/PNE ratio: 2:1).
3.2.4. Effect of the temperature
The removal efficiency of TN, TP and Chl-a according to the temperature is an important factor that confirms the feasibility of MES-PNE field applications as well as the pH. To investigate the removal efficiency of TN, TP and Chl-a according to the temperature, the temperature was maintained at 15–30°C. The temperature range was determined in view of the M. aeruginosa activity. M. aeruginosa grows actively at higher temperatures than at lower temperatures. The experimental results indicated that the removal efficiency of TN was 35.61% at 15°C, 93.45% at 20°C, 95.10% at 25°C and 95.12% at 30°C, and the efficiency for TP was 46.52% at 15°C, 95.15% at 20°C, 96.10% at 25°C and 96.15% at 30°C. As the temperature increased, the removal efficiency of the TN and TP increased, but the removal efficiency was almost constant at 25 and 30°C (Fig. 3(b)). The Chl-a was 60.35% removed at 15°C, 81.51% at 20°C, 92.21% at 25°C and 93.25% at 30°C. In general, most microalgae proliferate most actively at temperatures above 22°C. The green algal bloom caused by cyanobacteria also increased markedly when the water temperature in the lake was above 22°C. The removal efficiency for TN, TP and Chl-a was over 90% at 20°C when using MES-PNE and over 93% above 25°C. The results for the MES-PNE experiment can be applied in the field. Moreover, the removal of Chl-a using MES-PNE was more efficient than other adsorbents because it can limit the growth of microalgae due to the removal of nutrients. Therefore, the simultaneous use of MES-PNE is an effective method for improving nutrient and Chl-a removal from lakes.
3.2.5. Chl-a removal at various MES-PNE doses
The MES-PNE dose is an important parameter that strongly influences the removal process by affecting the removal effect of the MES-PNE. The optimization of the pH and temperature is an important consideration for the feasibility of field applications. However, optimizing the amount of MES-PNE for Chl-a removal is important for minimizing the impact on the ecosystem and reducing the adsorbent cost. The data obtained when removing up to 95% of the Chl-a using MES-PNE is shown in Fig. 4. In reference to the experimental results of the above pH and temperature on the removal efficiency of Chl-a, the pH and temperature were maintained at 7 and 25°C, respectively. The results showed that the correlation between the Chl-a concentration and the MES-PNE dose was 0.9632, which was very high. As the Chl-a concentration increased, the amount of MES-PNE also increased. The required amount of MES-PNE to remove more than 95% of the Chl-a was calculated using the correlation coefficient (R2). The calculation results showed that approximately 1.52–2.20 g/L of MES-PNE was required to remove 1 g of dry weight/L of Chl-a.
Relationship between the Chl-a and MES-PNE dose (pH 7.5 ± 2, T: 25°C, mixing time: 30 min, and mixing rate: 80 rpm, MES/PNE ratio: 2:1).
3.3. Relationship between Chl-a and TN, TP
To investigate the effects of the TN and TP concentrations on the algal blooms, the relationship between Chl-a and TN and TP was investigated and the results are shown in Fig. 5. The concentration of Chl-a increased with the increasing TN and TP concentration. Therefore, the increase in Chl-a is closely related to the eutrophication of rivers. The results showed that the correlation between the Chl-a and TN was 0.9817, and the correlation between the Chl-a and TP was 0.9926, which indicates that TP has more influence on the increase in Chl-a than TN. This correlation shows that the Chl-a concentration can be reduced when the TN and TP concentrations are decreased. Therefore, it is effective to remove the TN, TP and Chl-a at the same time to reduce the algal blooms in the lake.
Relationship between Chl-a and the TN and TP concentrations (pH 7.5 ± 2, T: 25°C, mixing time: 30 min, and mixing rate: 80 rpm, MES/PNE ratio: 2:1).
3.4. Inhibition Models
The specific growth rates (μ) for various initial doses (S) were calculated from the plot of In(X) versus time in the logarithmic phase as described by the equation in Table 4. The slope of the line during the exponential phase gives the specific growth rate. Until reaching a 1 g/L MES-PNE dose, the specific growth rate of M. aeruginosa increased and reached its highest level at 0.18 h−1. At 1 g/L MES-PNE, a distinct substrate inhibition was found. Above the 1.0 g/L MES-PNE, the μmax was decreased and became almost constant at 3 g/L (μmax = 0.03) and 5 g/L (μmax = 0.02) for the MES-PNE dose (Fig. 6).

Estimated Parameters of Various Substrate Inhibition Models
Fitting experimental data with various substrate inhibition models (Standard deviation varying ± 3%).
Most of the studies concerning substrate inhibition and microbial growth have been performed using toxic substrates, such as aromatic and halogenated hydrocarbons [15, 22, 23]. Kinetic equations, which describe the activity of a microorganism on a particular substrate, are crucial for understanding many the phenomena underlying biotechnological processes. They allow for the mathematical prediction of growth parameters that are important for identifying key parameters in controlling growth [24–26]. In this study, the accuracy of the fitted model, such as the Haldane, Double exponential, Edwards, Luong, Webb, Moser and Teissier models, is important for explaining the cell growth kinetics. The MES-PNE inhibition of the M. aeruginosa was calculated using various kinetic models, and the result is shown in Fig. 6. The parameters of the different growth models considered here were estimated using MATLAB software. Tessier, Moser, Haldane and Webb models were fitted only to uninhibited data (μmax), and the Edwards, Double exponential and Luong models were used to explain all the data. Here, μmax is the maximum specific growth rate that would be obtained if the growth was not substrate-inhibited. The experiments were performed in triplicate under identical conditions, and the average result had a standard deviation varying ± 3% of the mean. All the inhibition models reached the μmax from 1 to 1.5 g/L MES-PNE dose. Above the 1.5 g/L MES-PNE, the μmax was decreased and became almost constant at 5 g/L (μmax = 0.02, 0.03 and 0.04 for Edwards, Double exponential and Luong, respectively) and 10 g/L (μmax = 0.01, 0.02 and 0.01 for Edwards, Double exponential and Luong, respectively) for the MES-PNE dose.
Quantitative experimental data are required for the design and optimization of biological transformation processes. A variety of mathematical models have been proposed to describe the metabolism dynamics for compounds that were exposed to pure environmental cultures. The relation between the specific growth rate (μ) of a population of microorganisms and the substrate concentration (S) is a valuable tool in biotechnology, and the Monod equation has been widely used to describe the growth-linked substrate utilization rate [27]. However, when a substrate exhibits inhibition towards its own biodegradation, the original Monod model could not be used. In this case, its derivatives with new constants that provided corrections for the substrate have been devised instead for a variety of microbial growths, and for this study, the available biodegradation kinetic model is shown in Table 4. The μmax was determined from 0.172 to 0.209 and the relation coefficient (R2) was measured from 0.8978 to 0.9872 for the Moser, Tessier, Webb, Haldane, Edwards, Double exponential and Luong models. Among the various calculated models, the Haldane and Luong models were adjusted to the lowest (0.8978) and highest (0.9872) R2 values compared with other inhibition models. This result indicated that the Luong model was the best model for fitting the biodegradation kinetics data from M. aeruginosa grown on MES-PNE from lake water. The Luong equation accurately matched the growth kinetics and enabled the relation between the maximum specific growth rates (μm) and the initial MES-PNE concentration (S) to be described. It could also be used to deduce the substrate saturation coefficient (Ks) and the maximum substrate concentration (Sm) above which growth ceases. The kinetic constants of the Luong equation for MES-PNE were μm = 0.181 h−1, Ks = 0.7012 mg/L, Sm = 18.75 mg/L and n = 0.952, respectively.
3.5. Discussion
The toxicity of M. aeruginosa has been a global problem in ecosystems and for flora and fauna. Thus, many researchers have studied various methods for M. aeruginosa removal. Li et al [28] studied the removal of M. aeruginosa using an extract of Sagittaria trifolia, an aquatic plant, and they reported 90% removal in 6 h. Chen et al [6] reported 75–82% M. aeruginosa removal in 19 d using aquatic plants. However, Sengo and Anderson [9] reported relatively low removal, with 22.9% removal of M. aeruginosa using 1,000 mg/L of clay minerals for rivers and fauna. However, Liu et al [20] modified clay minerals with hexadecyl trimethyl ammonium bromide to increase the low M. aeruginosa removal efficiency by clay minerals, and 92% reported removal using 0.3 g/L of modified clay. This study was conducted to investigate the removal of nutrients and Chl-a using MES-PNE. It was environmentally friendly and had high removal efficiency compared to the previous studies.
Table 5 shows the removal of M. aeruginosa using various materials. Microcystin, a toxic substance produced by Microcystis, has peptide bonds. The general structure of microcystin is cyclo-(-D-Ala-LXD-isoMeAsp-LZ-Adda-D-isoGlu-Mdha) where D-iso-MeAsp is D-erythro- Dehydro-alanine, Adda is (2S, 3S, 8S, 9S)-3-amino-9-methoxy-2,6,8-trinethyl-10-phenyldeca-4E, 6E- or four L-amino acids, and X and Z are 2 or 4 L-amino acids [29]. Previous studies reported that PNE acts on the peptide binding of microcystin to inhibit toxicity [23, 30]. In other words, PNE not only kills M. aeruginosa but also acts to inhibit and degrade the toxicity of Microcystin, a toxic substance found in water. Biological treatments to remove Microcystis are relatively inexpensive and environmentally friendly compared to ultraviolet irradiation or chemical methods. In particular, M. aeruginosa control methods using aquatic plants have become the most popular in recent years, but they take a long time [21]. Microcystis in natural rivers, reservoirs and lake are affected by the pH and temperature when it is removed by physical or chemical methods, and it is not simple to find the optimum removal conditions. MES can be applied in the field without controlling the pH.

Removal of M. aeruginosa with Various Materials
Economic evaluation is a very important part to know whether hybrid material can be commercialized or not. Sericite is cheaper than other clay minerals, and the price of sericite is 0.5–2.5 USD/kg. Therefore, the price of hybrid material is expected to be about 2–5.5 USD/kg. However, the cost of UV-activated persulfate, which is effective for removing green algae, is about 8–12 USD/kg (Sigma Aldrich). The MES-PNE used in this study has a lower removal rate for M. aeruginosa compared to UV-activated persulfate, but MES-PNE is inexpensive and eco-friendly.
Fine pore-containing clay minerals can remove nitrogen and phosphorus nutrients. In particular, clay minerals contain a large amount of aluminum and iron, and thus phosphorus can be effectively adsorbed and removed. However, the removal efficiency of anionic ions with natural clay minerals is low because the surface of natural clay is generally negatively charged. Chen et al [36] obtained removal efficiencies of 0.38% and 0.95% by removing NO3− and PO43− using illite, and Choi [8] reported a PO43− removal rate of 12.5% using sericite. Recently, clay minerals have been modified by using various materials to change the surface charge of clay minerals to a positive charge, and they are widely used for the removal of anionic ions and microalgae. Lürling et al [37] reported a removal rate of 98% for PO43− by modifying bentonite with lanthanum. Zamparas et al [19] also reported a removal rate of 97.6% of PO43− by modifying bentonite with acid. Chen et al [36] reported a removal rate of 98.49% PO43− after modifying illite with Fe3O4. In this experiment, the clay mineral sericite was methyl-esterified to remove TN and TP. Depending on the substance to remove, the clay minerals can be modified with various methods and materials. The application of clay minerals for the removal of heavy metals and nutrients is very widely employed.
In addition, modified clay minerals are very effective for removing microalgae with negative charges. Choi et al [1] reported a 98% higher removal of Chlorella vulgaris using MES at pH 7, whereas the removal efficiency of Chlorella vulgaris by using natural clay minerals was 10–13%. This finding suggests that the surface charge of microalgae and the zeta potential of clay minerals are closely related. Consistent with the results of previous studies, the removal of Chattonella marina with unmodified montmorillonite and vermiculite resulted in low removal rates of 6% and 12%, respectively. However, high microalgae removals of 88% and 98% were reported after the modification of montmorillonite and vermiculite [38]. Therefore, when the surface charge of the clay mineral is positively modified, the mineral can efficiently remove microalgae and nutrients with negative charges. In addition, the MES-PNE affected not only the removal of nutrients and Chl-a, but it can also be applied in the field.
4. Conclusions
The present study was an assessment of the efficient removal of a nutrient and Chl-a by MES-PNE, a low cost and abundant green hybrid material from nature. For this purpose, optimal conditions for the growth control of M. aeruginosa and nutrient removal by MES-PNE were investigated using factors such as the pH, temperature, MES-PNE ratio, and MES-PNE dose. In addition, the control of M. aeruginosa using MES-PNE was also analyzed using various inhibition models. The major components of PNE were 58.1%, 19.6%, 13.3%, 3.75%, 2.93%, 1.3% and 0.6% of moisture, carbohydrates, cellulose, protein, crude fat, essential oil and ash, respectively. As shown for the MES and sericite analysis, the O, Si, K+ and Mg2+ contents of the MES were decreased by 5.51%, 3.67%, 1.46% and 0.49%, respectively, compared with sericite, while the Al3+ and Fe3+ in the MES increased 8.02% and 1.94%, respectively. The removal of nutrients and Chl-a onto MES-PNE was optimized for up to 95% as follows: 2–2.5 of MES-PNE ratio, 7–8 pH and a 22–25°C temperature. For this study, approximately 1.52–2.20 g/L of MES-PNE was required to remove each 1 g dry weight/L of Chl-a. The results show that the correlation between Chl-a and TN was 0.9817, and the correlation between Chl-a and TP was 0.9926, which indicates that TP has more influence on the increase in Chl-a than TN. The kinetic constants of the Luong equation for MES-PNE were μm = 0.181 h−1, Ks = 0.7012 mg/L, Sm = 18.75 mg/L and n = 0.952, respectively. The Luong model was the best model for fitting the biodegradation kinetics data from M. aeruginosa grown on MES-PNE from lake water. The novel hybrid material MES-PNE was very effective for removing TN, TP and Chl-a from the lake and can be applied in the field.
Acknowledgments
This study was supported by the Basic Science Research Program through the National Research Foundation of Korea (NRF) funded by the Ministry of Education, Science and Technology (2016005271).