A comparative study of three different viability tests for chemically or thermally inactivated Escherichia coli
Article information

Abstract
Three different methods of bacterial viability monitoring were compared to detect chemically or thermally inactivated Escherichia coli. Direct colony enumeration, live/dead bacterial cell staining with a fluorescent dye, and the dehydrogenase activity assay were compared with respect to their ease of use and time required to perform the three different tests. The green (live cell)/red (dead cell) ratio obtained from the fluorescent bacterial cell staining approach showed a linear relationship with the colony forming units; the result obtained with dehydrogenase was similar to those. The sensitivity of the monitoring methods to detect bacterial deactivation varied with different disinfection conditions. After thermal treatment, the sensitivity of the staining approach was lower, while that of the dehydrogenase activity assay was the highest. After chemical treatment, the sensitivity of detection for both methods was similar.
1. Introduction
The determination of disinfection efficiency and microbial activity is traditionally based on estimating the population density of heterotrophic bacteria or indicator bacteria (i.e., total coliforms or Escherichia coli (E. coli)), as well as measuring the levels of water quality parameters during the process [1]. However, this approach involving counting the number of the bacteria is time consuming, requiring 24 h to days. Moreover, colony counting is possible only for specific bacteria that can be cultured under normal laboratory conditions (dependent upon media, temperature, duration of culture, and other such factors) [2]. However, the majority of bacteria cannot be cultured under artificial culture conditions [3]. Consequently, for environmental samples, the actual bacterial viability is often underestimated. Therefore, an alternative method that can quickly differentiate between live and dead cells immediately after disinfection is required.
To discriminate live and dead cells, several methods have been developed, including microscopic measurement, acridine orange direct colony counting, 4,6-di-amidino-2-phenylindole (DAPI) direct counting, and the Live/Dead® Baclight™ Bacterial Viability kit [4]. Among them, the Live/Dead® Baclight™ Bacterial Viability kit comprises two types of fluorescent stains (SYTO9 and propidium iodide), which differ in their spectral characteristics and in their ability to penetrate viable and non-viable bacterial cells [5]. SYTO9 can penetrate both viable and non-viable cell membranes; this renders the cells light to fluorescent green, while the selective uptake of propidium iodide through damaged cell membranes results in cells being stained red [1]. It was reported that the Live/Dead® Baclight™ Bacterial Viability kit was used for the direct enumeration of viable and total bacteria following disinfection using sodium hypochlorite (140 mg NaOCl/L) [1] and 70% (v/v) isopropanol [6]. Recently, flow cytometry (FCM) combined with the staining technique was suggested as a rapid method to quantify the cell density of viable and total bacterial cells in environmental water samples [7] or disinfected samples [8].
Enzymatic activity has also been used as a bacterial viability monitoring method. Oxidoreductase (dehydrogenase and o-diphenol oxidase), hydrolytic (phosphatase and bglucosidase), and urease activities were measured to indicate soil resilience and resistance to perturbation when toxic organic wastes were exposed to microbes [9]. The dehydrogenase activity (DHA) assay is more frequently used to measure the degree of bacterial respiration and estimate biomass in water treatment systems [10]. DHA is based on the use of a redox-sensitive tetrazolium dye (2,3,5-triphenyl tetrazolium chloride (TTC) [11, 12] or 2-(4-Iodophenyl)-3-(4-nitrophenyl)-5-phenyltetrazolium chloride (INT) [13]), which is reduced to red-colored insoluble formazan within cells via respiratory activity.
The objective of the present study was to compare three different viability tests (fluorescent dye staining, dehydrogenase activity assay, and direct colony counting) for E. coli exposed to either chemical (sodium hypochlorite, isopropanol, and hydrogen peroxide) or thermal inactivation conditions. Our aim was to identify the best method from the three viability tests to precisely report the disinfection efficiency depending on the type of inactivation conditions.
2. Materials and Methods
2.1. Bacterial Strains and Cultivation
E. coli (KCCM 40271) was inoculated in Luria-Bertani (LB) liquid medium containing 10 g/L BD Bacto™ Tryptone (BD Bioscience, USA); 5 g/L BD Bacto™ Yeast extract (BD Bioscience, USA); and 8 g/L sodium chloride (NaCl, ≥ 99%, Sigma, USA), where the pH was adjusted to 7.0. E. coli was then cultivated for 18 h at 30°C with shaking at 160 rpm in a shaking incubator (VS-8480SF, Vision Scientific Co., Ltd., Korea).
2.2. Disinfection
E. coli was inactivated by the addition of several chemical disinfectants (e.g., 10 g/L sodium hypochlorite (NaOCl, Junsei Chemical Co., Ltd., Japan), 70% (v/v) isopropanol (CH3CH (OH)CH3, ≥ 99.8%, Merck Millipore, Germany), or 5% (v/v) hydrogen peroxide (H2O2, 28%, Duksan Pure Chemicals Co., Ltd., Korea) in 1 M hydrochloric acid (HCl, 35%, Daejung Chemicals & Metals Co., Ltd., Korea)) or by thermal treatment. Briefly, 30 mL of E. coli (5×10⁵ CFU/mL) that had been incubated in LB broth was placed into sterile Falcon™ 50 mL conical centrifuge tubes with a diameter of 28 mm, and then centrifuged at 1,000 × g for 15 min (HA-1000-3, Hanil Science Industrial Co., Ltd., Korea). The remaining medium was discarded by washing the cell pellet with 0.85% (w/v) NaCl solution. The cell pellet was suspended in 15 mL of 0.85% (w/v) NaCl solution; this solution was then used for chemical inactivation tests, where 15 ml of each of chemical disinfectant was added. After 10 min of exposure, the supernatant was separated by centrifugation (1,000 × g for 15 min) and then discarded. Subsequently, the cell pellet was rinsed three times with 15 mL of 0.85% (w/v) NaCl solution to remove any remaining chemical disinfectant. The presence of residual chemicals was analyzed, according to previously published methods [14, 15]. For thermal treatment, the centrifuged cells, prepared as described above, were placed in a water bath (IKA® EH4 Basic immersion temperature controller, Germany) at 90°C for 10 min. The cells were then placed in chilled ice water for 15 min. Meanwhile, a sample not subjected to inactivation treatments served as the control.
2.3. Viability Assessment after the Different Methods of Disinfection
E. coli was sterilized by adding several biocidal chemicals, such as chlorine, isopropanol and peroxide in combination with heating at 90°C in a water bath. After treatment, non-disinfected and disinfected cells were mixed together in volume ratios of 0:100 (all disinfected cells), 10:90, 50:50, 90:10, and 100:0 (all non-disinfected cells) in 2 mL microcentrifuge tubes (Axygen Scientific, USA), as described in Fig. 1. The number of viable cells in each bacterial mixture was determined using live/dead bacterial cell staining, dehydrogenase activity assay, and conventional colony counting as colony forming units (CFU).
Process used to prepare the disinfected and non-disinfected cell suspension samples subjected to bacterial viability tests.
2.3.1. Live/dead bacterial cell staining
Disinfected and non-disinfected cells were stained using fluorescent dyes to enumerate live and dead cells. SYTO9™ green fluorescent nucleic acid stain (Thermo Fisher Scientific, USA) and propidium iodide (PI, Sigma, USA), dissolved in dimethyl sulfoxide (DMSO, ≥ 99.9%, Sigma, USA), were mixed together (100 μL + 100 μL) and diluted 1:10 in 0.085% (w/v) NaCl, and this solution was used as the reagent for dual fluorescent staining [1]. The stock solution was stored at −20°C and protected from light. Dual fluorescent stain (20 μL) was added to 1 mL of cell suspension containing pre-mixed disinfected and non-disinfected cells, and incubated in the dark at room temperature (25°C) for 20 min. The remaining dye was removed by discarding supernatant after centrifugation at 9,450 × g for 5 min (Centrifuge 5415 D, Eppendorf, Germany). The cell pellets obtained were resuspended in 0.85% NaCl solution. Under dark conditions, confocal scanning laser microscopy (CLSM) was performed within 1 h to avoid reducing the fluorescence intensity. The cell suspension (20 μL) was placed on an Invitrogen™ Countess™ Cell Counting Chamber Slide (Thermo Fisher Scientific, USA). The corresponding images were acquired under a confocal scanning laser microscope (LSM 510 META, ZEISS™, Germany) with a magnification up to 20×. Viable and nonviable cells were observed under specific lasers (wavelength 488 nm and 543 nm, respectively), with wavelengths corresponding to the excitation wavelengths of each dye. Enumeration of live and dead cells in the CLSM images was performed using the Image J program developed at National Institutes of Health (NIH).
2.3.2. Dehydrogenase activity assay
Dehydrogenase activity was determined by measuring the amount of triphenylformazan (TPF) formed due to the reduction of 2, 3, 5-triphenyltetrazolium chloride (TTC, C19H15ClN4, ≥ 95%, Sigma, USA). The TTC stock solution (2% w/v) was prepared by mixing TTC with sterilized deionized water and was sterilized using a mixed cellulose ester syringe filter (0.45 μm, DISMIC®-25AS, ADVANTEC®, Japan). To measure TPF production, 200 μL of bacterial mixture was centrifuged at 9,450 × g for 5 min (Centrifuge 5415 D, Eppendorf) and the remaining medium was removed. The cell pellet was dispersed in 100 μL of D-(+)-glucose (C6H12O6, Sigma-Aldrich, USA) solution (1% w/v in sterile deionized water) in a microfuge tube, to supply an organic substrate, and 20 μL of TTC stock solution was then added. The reactions were incubated in the dark at room temperature for 1 h. The red color and insoluble TPF in the bacterial cell were extracted by adding 1 mL of chilled methanol (HPLC grade, ≥ 99.9%, Sigma-Aldrich, USA), which had been stored at −20°C, to halt the additional bacterial activity. The cell pellet and other particulate matter were then separated from the extract by centrifugation. The absorbance of the extract was measured using a UV-Visible spectrophotometer (UV-3300, Humas Co., Ltd., Korea), at a wavelength at 489 nm. Assays not involving bacterial cells were performed simultaneously as blank controls.
2.3.3. Colony counting
To count the cultured colonies, 100 μL of each diluted culture or disinfected samples were inoculated onto the solid LB medium containing 1.5% AGAROSE SPI (Duchefa Biochemie, Netherlands) on a sterilized petri dish (SPL Life Science, Korea) and cultivated in incubator for 24 h at 30°C. The population density of the tested microbe was adjusted to be less than 300 CFU per plate by dilution with sterilized distilled water. The number of counted colonies was multiplied by the dilution factor of the sample to produce the final target cell count.
3. Results and Discussions
3.1. Live/Dead Bacterial Cell Staining
The mixtures of disinfected and non-disinfected E. coli were stained with SYTO9 and PI dyes after chemical and thermal treatment, and the cells were then observed by CLSM. In the CLSM images (Fig. 2), most of the cells in the non-disinfected samples appeared fluorescent green, from which they could be redistributed as separated spots. By contrast, red cells were observed in the disinfected samples. They often aggregated and were irregularly distributed, resulting in stronger fluorescent intensity. Previously, researchers investigated such cell aggregation by staining the cells with SYTO9 and PI or using a marker gene, from which they deduced that cell aggregation might be a consequence of protection against environmental stresses [16] or of cellular lysis, attributed to increased released DNA under stress conditions or loss of viability [17]. Liu et al. described that chlorination stress regulated early-stage biofilm formation in drinking water [18]. This could result in very bright spots of fluorescent illumination immediately around a number of stained single cells, which can subsequently lead to light shading effects when measuring single cell fluorescence with relatively weaker intensity. Therefore, we decided to exclude agglomerated cells or biofilm spots from the Image J analysis.
Confocal scanning laser microscopy images of fluorescent-stained E. coli following the disinfection process. Non-disinfected cells (a), and samples chemically disinfected using 10 g/L Sodium hypochlorite (b), 70% (v/v) Isopropanol (c), and 5% (v/v) peroxide (in 1 M HCl) (d), and thermally disinfected cells (e).
To confirm whether there is a specific correlation between the live/dead ratio and the mixing ratio of non-disinfected and disinfected cells, live and dead cells were counted using Image J. The live and dead cell density was determined in the series of images for each sample obtained using two filters during CLSM; however, overlapped counted cells were neglected. The results for the live and dead cell density and live/dead ratio as a function of the mixing ratio of the non-disinfected and disinfected samples are presented in Fig. 3. The results were different from those shown in Fig. 2, because as mentioned earlier, the light shading could obscure the fluorescence of a single stained cell observed by CLSM; however, the cell numbers were correctly detected during Image J analysis due to exclusion of agglomerated cells or spots where biofilms had formed. The results shown in Fig. 3 indicated that the exponential increase in live/dead ratio correlated with the mixing ratio for all disinfection methods. The regression equation for the plot of logarithm of live/dead ratio versus the mixing ratio had a strong positive slope, with a high R2 value (0.9074–0.9781). These results were consistent with results obtained using cyanobacteria [6, 19] and verified that there was a linear correlation between green/red fluorescence ratio and viability.
Green and Red cell density and Green/Red ratio versus mixing ratio of non-disinfected and disinfected cell plots for E. coli. a, b, and c represent plots for samples treated with 10 g/L sodium hypochlorite (a), 70% (v/v) Isopropanol (b), and 5% (v/v) peroxide (in 1 M HCl) (c), respectively. (d) represents the plot for samples that were thermally inactivated.
3.2. Dehydrogenase Activity Assay
In this experiment, the colorless TTC was readily reduced by the bacterial electron transport system to red-colored insoluble TPF [20]. The absorbance at 489 nm of each sample for the three different disinfection methods was measured. As a result, a linear relationship (e.g., R2 of 0.9325–0.9661) was established between the amount of TPF formed and the mixing ratio of non-disinfected and disinfected cells for a short time after the start of incubation (i.e., 1 h).
3.3. Colony Counting
Unlike the alternative viability-monitoring methods, conventional colony counting is a time consuming and laborious assay method, taking days to weeks. In this study, colonies were counted after culture for 24 h. However, for environmental samples, difficulties may rise in determining the optimal incubation time and culture conditions, because the species of microorganisms under investigation will show varying growth rates and will require different culture conditions in the colony counting method. Nevertheless, using the colony counting method in the present study allowed us to obtain a linear relationship between the logarithm of the CFU and the mixing ratio of non-disinfected and disinfected cells.
3.4. Comparison of Disinfection Efficiency
The alternative viability monitoring methods have a considerable advantage over direct colony counting, in that they can shorten the experimental period (i.e., time required for the live/dead bacterial cell staining is 1 h while that for DHA assay is 1.5 h). From the above results, each viability monitoring method showed a correlation with the mixing ratio of non-disinfected and disinfected cells. This implied that each of the measurements defining non-viability in terms of green/red stained cell ratio, dehydrogenase activity, and CFU, could be correlated with each other. This hypothesis was verified using the data shown in Table 1. Both, the green/red ratio of fluorescent staining and the dehydrogenase activity against TPF, correlated well with CFU with respect to the varying mixing ratio of non-disinfected and disinfected cells. The regression coefficient (R2) between staining and CFU was lower than that between dehydrogenase and CFU. This could be attributed to the fact that staining identifies dead and live cells simultaneously, whereas the dehydrogenase activity and CFU solely represent live cells. In addition, the p-values shown in Table 1 are consistent with the R2 values. Regardless of the type of inactivation, the p-values for the dehydrogenase activity and CFU were in the range of 0.0004–0.44, while those for live/dead cell staining and CFU were higher (0.05–0.56).
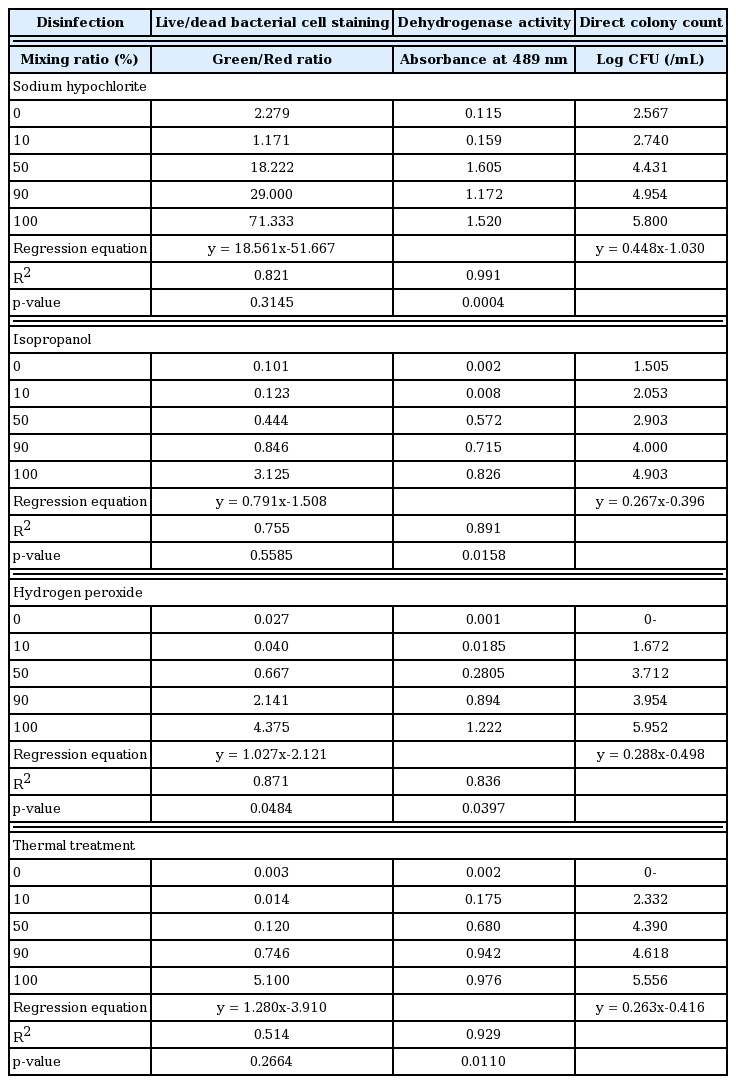
Correlation Analysis between Alternative Bacterial Viability Monitoring and Conventional Direct Colony Counting for E. coli Following Each Disinfection Process
4. Conclusions
The results of this study suggested that a quantitative correlation was established between the direct colony count and the alternative bacterial viability measurements (e.g., cell staining and dehydrogenase activity) following sodium hypochlorite, isopropanol, hydrogen peroxide, and thermal treatments. The correlation between the dehydrogenase activity and CFU was higher than that observed between cell staining and CFU. Therefore, the DHA assay could be the best alternative to colony counting to accurately and reliably define the degree of microbial inactivation following the application of the different disinfection methods. Besides, the sensitivity of assessing bacterial deactivation could vary depending on the type of viability monitoring method used.
Acknowledgments
This research was supported by the Basic Science Research Program through the National Research Foundation of Korea (NRF) funded by the Ministry of Education (NRF-2017R1D1A1B0 3034029).