Treatment of produced water in a floating carrier bioreactor
Article information
Abstract
Produced water is the largest wastestream of oil and gas exploration. It consists of various organic and inorganic compounds that hinder its beneficial use. This study compared the treatment of produced water in a batch suspended and biofilm activated sludge process. The biofilm carrier material was made from Gardenia Carinata shell. COD, NH4+-N and NO3-N removal was monitored in both the suspended (control) and floating carrier bioreactors. The results show a rapid reduction of produced water constituents in the floating carrier bioreactor. COD, NH4+-N and NO3-N removal was in the range of 99%, 98% and 97% for the floating carrier bioreactor whereas it was 88%, 84% and 83% for the control bioreactor. The rapid reduction of COD, NH4+-N and NO3-N clearly indicate that the floating carrier materials served as an attached growth medium for microorganisms, improved the breakdown of produced water constituents and reduced inhibition of microbial metabolic activities.
1. Introduction
The increasing population growth and urbanization has caused an increase in water usage and a decline in the available renewable water resources [1, 2]. Additionally, water requirement in the agricultural sector is increasingly high due to the demand in food production. In this circumstance, the dependency of the agricultural sector on the limited available renewable water resources for irrigation could be counterproductive. A good water management strategy and adjustment are required to avert the impending water scarcity [3]. Thus, reclamation of wastewater could serve as a supplement to the limited renewable water resources [1, 4].
One of the available, abundant and neglected secondary water resource is produced water [5]. Produced water is a by-product of oil well operation which is trapped in underground formation and brought to the surface along with oil and gas during drilling. It is separated from crude oil above ground in an oil/water separator.
As the demand for crude oil increases, the generation of produced water increase proportionately. Produced water is reportedly the largest waste-stream of oil and gas exploration with an estimated 250 million barrels per day compared with about 80 million barrels per day of oil production [6]. Its composition is complex and depends on geological conditions, storage formation and type of recovery method [7]. Produced water generation is usually low in the early stages of oil and gas operation but can rise to as high as 80% during the later years [8]. Produced water can be toxic to the environment due to its high organic and inorganic constitutents [9]. Produced water may comprise of flow from above or below the hydrocarbon zone, flow from fluids injected during operation and flow from within the hydrocarbon zone. The hydrocarbon content of produced water includes organic acids, polycyclic aromatic hydrocarbons (PAHs), phenols and volatiles [10]. These compounds are toxic to aquatic organisms when they combine together [11]. The chemicals used during oil and gas production are complex mixtures of various molecular compounds which can also increase the potential toxicity of produced water [12]. Thus, it is important to adequately treat produced before possible discharge or reuse.
Several methods have been investigated for produced water treatment. However, some of these methods are associated with demerits. Coagulation and flocculation can effectively remove suspended and colloidal particles but are less effective for dissolved constituents [6]. Electrodialysis is unsuitable for the treatment of produced water with high total dissolved solid (TDS) concentration [13]. Electrocoagulation is a simple and easy technique but could be affected by passivation [14]. Membrane technologies are effective techniques but are associated with membrane fouling which increases its cost [15]. A COD and NH3-N removal of 63.5 and 45% was achieved in a biological treatment of produced water [8]. Thus, there is need for a more effective and sustainable method for produced water treatment.
Several biofilm materials have been used in activated sludge process to improve bacteria population and improve system performance. Liu et al. [16] examined the performance of a combined upflow anaerobic sludge blanket (UASB) and immobilized biological aerated filter (IBAF) in a pilot scale experiments treating heavy oil wastewater using Polycin Urepan as carrier material. Han et al. [17] compared the performance of a pilot scale biological aerated filter (BAF) equipped with lava particles as carrier material and a drinking water treatment plant for ammonia and manganese removal. Sarti et al. [18] examined the performance of a horizontal-flow anaerobic immobilized biomass (HAIB) system treating low strength wastewater using polyurethane foam blocks as carrier material. High wastewater treatment capacity were all achieved with the various carrier materials.
The focus of this study is to investigate the performance of an abundant agricultural solid waste precusor (Gardenia Carinata shell) as a carrier material for the treatment of produced water in a batch activated sludge process. Gardenia Carinata is a small to medium tree, native to sunny environments. It is commonly used for landscaping and produce seeds that later develop into flowers with an internal part that is shelly. These shells contribute to solid waste production. Due to the environmental constraints in the development of new landfills [19], economic utilization of abundant and recyclable agricultural solid waste materials has intensified.
2. Materials and Methods
2.1. Wastewater Collection
The produced water used in this study was collected from a local oil and gas exploration terminal in Malaysia. The produced water was characterized in accordance with the standard methods for the examination of water and wastewater [20]. The complete wastewater characteristics is reported elsewhere [21, 22]. The COD, NH4+-N, pH and TSS concentrations were in the range 1,480 mg/L, 14 mg/L, 7.84 mg/L and 166 mg/L, respectively.
2.2. Floating Carrier Material
Gardenia Carinata Shell was collected within Universiti Teknologi PETRONAS (UTP). Gardenia Carinata Shell was severally washed and dried under the sun-light. The shells were manually broken and separated. The shells were then washed severally and dried at 105°C. Thereafter, the shells were manually cut into floating carrier materials of size 2 cm × 2 cm × 0.2 cm (width × length × height). The floating materials are low density materials with a relative density of 0.19 g/cm3 and a specific surface area of 4 m2. Oxygen was supplied to the air diffusers from an inbuilt air pump. The air flow was monitored using a rotameter and validated using a DO meter. The reactor was aerated at an air flow rate of 1.14 L.h in order to retain the floating carrier material in suspension.
2.3. Bioreactor Set-up
Two cylindrical shaped identical bioreactor of equal volume (5 L) were made from acrylic glass and set up in the laboratory. A thick polystyrene foam board was fixed at the bottom of the bioreactors to hinder friction and turbulence between the reactors and their stand. The reactors were covered with aluminum foil to simulate a closed system. A horizontal thin lining was made at the bottom for the installation of air diffusers. The first bioreactor was a biofilm system and was supplied with floating carrier materials whereas the second bioreactor was a suspended growth system used as control mechanism to evaluate the performance of the biofilm system.
2.4. Bioreactor Start-up
The floating carrier bioreactor (FCB) was started by adding 150 pieces of carrier materials into the bioreactor. Seed sludge (1 L) with mixed liquor suspended solids (MLSS) of 3,472 mg/L was collected from a domestic wastewater treatment plant in UTP and was added to FCB. Real produced water was diluted to a COD concentration of about 150 mg/L and 0.8 L was fed to FCB to initiate biofilm formation and acclimatization. After acclimatization (2–3 d), 0.25 L of the supernatant was withdrawn from FCB and 3.4 L of real produced water was added to the reactor. The purpose was to have more raw wastewater within the reactor volume (5 L). The air flowrate was calibrated to obtain a flow that can maintain the carrier materials in suspension. In the control bioreactor (CB), a similar approached was adopted for start-up, but the carrier materials were excluded.
2.5. Bioreactor Operation
Oxygen was provided in both FCB and CB through two ceramic air diffusers installed at the bottom of the bioreactors and connected to an inbuilt-air pump. Supernatants (30 mL) were withdrawn from both bioreactors (FCB and CB) at intervals of 12 h. The residual COD, NH4+-N and NO3-N concentration was measured using the Hach methods [23]. pH, DO and temperature were daily monitored concurrently using a pH meter (Sension TM), DO meter (YSI 550 A) and a thermometer (Thermolyne P/N MEX – 147 IMM 76 MM MCT). The pH meter, DO meter and thermometer were purchased from Hach USA, Palmer Wahl Instrumentation Group USA and YSI incorporated USA, respectively. All sample analysis were triplicated.
3. Results and Discussion
Fig. 1 shows the COD result for FCB and CB after acclimatization. Effluent COD concentration decreased to 873 mg/L in FCB and 1,097 mg/L in CB at the end of day 1. On day 2, effluent COD concentration decreased to 206 mg/L in FCB and 416 mg/L in CB. On day 3, effluent COD concentration further decreased to 21 mg/L in FCB and 181 mg/L in CB. No further improvement was observed on day 4 as the bioreactors stabilized. The BOD5 concentration at the end of the study was 17 mg/L for FCB and 79 mg/L for CB.

COD removal in FCB and CB.
The effluent NH4+-N concentration at the end of day 1 was 2 mg/L in FCB and 6.15 mg/L in CB as shown in Fig. 2. On day 2, effluent NH4+-N concentration in FCB was 1 mg/L and 3.3 mg/L in CB. Effluent NH4+-N concentration slightly decreased to 0.25 mg/L in FCB and 2.05 mg/L in CB on day 3. The NH4+-N removal coincided with NO3-N removal in FCB and CB as represented in Fig. 3.
NH4+-N removal in FCB and CB.

NO3-N concentration with time in FCB and CB.
Fig. 3 shows that NO3-N concentration decreased on day 1 and reached approximately 0.7 mg/L and 1.9 mg/L in FCB and CB, respectively. However, the NO3-N concentration increased to 1.9 mg/L and 3.1 mg/L in FCB and CB on day 2. On day 3, NO3-N concentration decreased to 0.13 mg/L and 0.7 mg/L in FCB and CB on day 3.
The COD, NH4+-N and NO3-N removal is summarized in Table 1. The FCB performance was higher in comparison to CB.

Summary of Reactor Performance
The mechanism of COD removal by both bioreactors could be attributed to carbonaceous substrate consumption [24]. The oxidation of organic matter by microorganisms results in cell synthesis, growth and cell maintainance. NH4+-N removal in both bioreactors were governed by the autotrophic oxidation of ammonia, first to nitrite and then, to nitrate [25]. The decrease and increase of NO3-N concentration on day 1 and 2 in FCB and CB was caused by the oxidation of NH4+-N to NO3-N during nitrification. The low effluent concentration of NO3-N on day 3 represented an uptake in microbial growth [26]. The increase of NO3-N concentration on day 2 was due to nitrification, which is the two step bio-oxidation of ammonia first to nitrite, and then to nitrate. The results show that NO3-N removal was higher in FCB, though complete NO3-N removal was achieved in both systems. NO3-N removal is desirable due to its role in eutrophication, methaemoglobinemia and cancers of the digestive tract [27, 28].
The higher reduction of produced water constitutents in FCB could be attributed to the spatial distribution of heterotrophic and autotrophic microorganisms on the biofilm [29]. Additionally, exogenous substrate consumption, re-stabilization of detached biofilms and nitrification was prominent in FCB [24]. The texture of the fine air bubbles in FCB was unique and represent a minor mechanism. Elemental analysis revealed the presence of functional groups such as alkyl halides, aromatics, carboxylics, amines and alcoholic compounds on the floating carrier material. These functional groups could facilitate biosorption of wastewater constituents through the interaction of their functional groups with the reactive particles of produced water in FCB. The floating carrier materials provided the microorganisms sufficient surface area for growth and protection against toxicity and inhibition [30].
The shape, size and nature of carrier material can influence system performance. High organic matter degradation has been reported with several conventional biofilm carrier materials such as sponge [31], bio-balls [32], kaldness [33] and schists [34]. Khoshfetrat et al. [35] achieved a COD removal of about 90% using 1,372 pieces of polypropylene support materials in a submerged fixed-film bioreactor treating synthetic wastewater. Sarti et al. [18] achieved a COD removal in the range of 68–82% in a HAIB system treating low strength wastewater using polyurethane foam blocks as support materials. However, some floating carrier materials such as polyurethane foam are hydrophobic and have a net negative surface charge which repels the attraction of bacterial cells of similar charge and could cause a prolonged biofilm formation [36]. Additionally, carrier materials such as chitosan are sensitive to pH [37]. Chu et al. [36] compared the biofilm formation on a polyurethane foam (PUF) and a modified polyurethane foam (MPUF). The authors observed that biofilm formation was rapid and higher (1.3 times) on the MPUF compared to PUF due to the improved hydrophilicity of MPUF. Chen et al. [37] observed that chitosan was sensitive to pH due to its surface properties in their study of phenol degradation.
The use of non-conventional agricultural and solid waste carrier materials such as rice husk [38], fireclay [39], coir geotextiles [40] and fiber thread [41] have demonstrated effective treatment capability. These non-conventional carrier materials are hybrid (hydrophilic and hydrophobic) and degradable. The air flowrate required for carrier flotation is low compared to the conventional carriers and biofilm formation is rapid. Thus, the use of Gardenia Carinata shell as a floating carrier material is a promising technique to improve produced water biodegradation and solid waste management. The results obtained in this study for FCB is consistent with literature and largely depend on biofilm formation. The pH of both bioreactors was in the optimum range (6.9–7.8) for nitrification throughout the experiment.
3.1. Kinetic Evaluation
The bioreactors were evaluated on the basis of substrate removal rate using the expression in Eq. (1)
Where ds/dt is the substrate removal rate (g/L/d), K is the kinetic constant, X is the biomass concentration (mg/L), So and S are the influent and effluent substrate concentration(mg COD/L).
The kinetic data were plotted using Origin 7.0 software. Origin 7.0 software is a multipurpose, scientific and technical data analysis tool used to solve specific problems. It could be used to manage, create, explore and organize results and graphs. The kinetic data were fitted into a least square fit model in Origin 7.0 software and a linear regression was obtained at 95% confidence level in Fig. 4 (FCB) and Fig. 5 (CB). The probability value (P), coefficient of determination (R2), substrate removal rate (k), standard deviation (Std. Dev) and standard errors (Std. Err.) were obtained and presented in Table 2. The probability values (P) less than 0.05 indicate a significant model term. The P-values for both FCB and CB were low and significant (Table 1). The P-values for FCB and CB indicate a low probability of random error in the sample population. The coefficient of determination (R2) for FCB and CB were high (>0.9) in Table 2. The substrate removal rate for FCB (97.93 L/d) were higher compared to CB (86.36 L/d). The standard deviation and standard error were low for FCB and CB.
Substrate removal rate for FCB.
Substrate removal rate for CB.
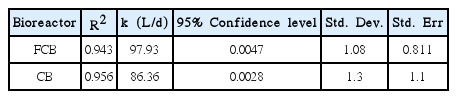
Kinetic Constants for FCB and CB
4. Conclusions
The performance of an activated sludge system assisted with a floating carrier material made from an abundant agricultural solid waste material (Gardenia carinata shell) was investigated in a batch study for the treatment of produced water. The results clearly indicate that the carrier materials caused the rapid decrease of produced water constituents compared to the suspended control bioreactor. COD, NH4+-N and NO3-N removal were 99%, 98% and 98% for the FCB and 88%, 84% and 83% for the suspended control bioreactor, respectively. The mechanism for substrate removal in both bioreactor were identified as substrate consumption and nitrification. However, in the FCB, the texture of the rising air bubbles suggests the presence of another mechanism (biosorption). The following conclusions can be drawn from this study:
The addition of suitable floating carrier materials in activated sludge enhances the overall performance of the bioreactor.
Biofilm formation is rapid due to the stable and degradability potential of natural carrier materials.
After biofilm formation on the floating carrier materials, rapid reduction of wastewater constituents is triggered by the spatial substrate competition between different kinds of microorganisms on the biofilm.
The floating carrier material provides adequate surface area for the attachment of bacteria and reduces both substrate inhibition and potential toxicity.
The use of solid waste materials with surface functional groups as floating carrier materials is highly beneficial due to the contribution of their inherent properties into the activated sludge system which further enhances the process.
Acknowledgments
This study was supported by Universiti Teknologi PETRONAS (UTP). The authors are therefore grateful to UTP.