Effects of arsenite and variation of microbial community on continuous bio-hydrogen production from molasses using a sequence batch reactor (SBR)
Article information
Abstract
This study investigated the effects of various arsenite concentrations on bio-hydrogen production from molasses using a sequence batch reactor (SBR) operated in a series of three batch cycles. In the first batch cycle, hydrogen production was stimulated at arsenite concentrations lower than 2.0 mg/L, while inhibition occurred at arsenite concentration higher than 2.0 mg/L compared to the control. Hydrogen production decreased substantially during the second batch cycle, while no hydrogen was produced during the third batch cycle at all tested concentrations. The toxic density increased with respect to the increase in arsenite concentrations (6.0 > 1.6 > 1.0 > 0.5 mg/L) and operation cycles (third cycle > second cycle > first cycle). The presence of microorganisms such as Clostridium sp. MSTE9, Uncultured Dysgonomonas sp. clone MEC-4, Pseudomonas parafulva FS04, and Uncultured bacterium clone 584CL3e9 resulted in active stimulation of hydrogen production, however, it was unlikely that Enterobacter sp. sed221 was not related to hydrogen production. The tolerance of arsenite in hydrogen producing microorganisms decreased with the increase in induction time, which resulted in severing the inhibition of continuous hydrogen production.
1. Introduction
Global energy supply depends mostly on fossil fuels. However, the supply of these fossil fuel reserves is finite and their main products of combustion is carbon dioxide, sulfur dioxide, and carbon monoxide, which have adverse impact on our environment and contribute greatly to global warming. Due to the depletion of fossil fuel and due to its polluting nature, hydrogen has been suggested as the energy carrier for the future [1–3].
Hydrogen is a clean and renewable energy resource. Presently, the main biological hydrogen production processes include, bio-photolysis, photo-fermentation, dark fermentation, and the hybrid system combining the fermentative and photosynthetic approaches [1]. Among these processes, dark fermentation has been suggested as being the most advantageous as it does not require external light energy to drive the process, and it is able to utilize a variety of waste streams [4, 5].
Most researchers use glucose as a substrate on bio-hydrogen production. However, the substrate is expensive, causing the hydrogen production to be costly. On the other hand, beet sugar factories generate large volumes of high strength wastewater that is of serious environmental concern. Therefore, molasses is an ideal substrate for anaerobic fermentative hydrogen production. However, the industrial wastewater from beet sugar factories has been reported to contain a mixture of pollutants including heavy metals that are characterized by low biodegradability; this then leads to reactor upset and low hydrogen yield [6].
Arsenite is one of the most abundant elements known, and is sourced from the earth’s crust. Arsenite can attach to very small particles in the air, stay in the air for many days, and travel long distances. It is primarily used as an insecticide and herbicide or preservative for wood due to its germicidal power and resistance to rotting and decay, respectively [7].
The aim of this study is to investigate the effects of arsenite and the characteristics of the microbial community on hydrogen fermentation from molasses by using a sequence batch reactor (SBR). In order to achieve this goal, the hydrogen production potential (P), maximum hydrogen production rate (R), hydrogen yield, hydrogen production ratio, and volatile fatty acids (VFAs) were analyzed. Moreover, the variation of microbial community was analyzed with respect to various arsenite concentrations and sequential dosage of arsenite in the SBR. The results of this experiment could be helpful for the bio-hydrogen production of molasses because little information is available in the literature regarding sequential exposures of arsenite in the SBR process.
2. Materials and methods
2.1. Seed Microorganisms
The seed microflora was collected from a municipal sewage treatment plant. Synthetic medium was placed into a serum bottle then purged with nitrogen gas for 5 min to obtain an anaerobic condition. The medium was inoculated with 6 ml of the settled sludge supernatant then continuously shaken at 120 rpm in a shaking incubator at 30°C., In order to acquire the acclimated seed microflora, subculture was conducted with serial transfer of the culture to the fresh medium.
2.2. Source of Molasses and Arsenic
Molasses wastewater was collected from a sugar refining company (Incheon, South Korea) and used as a substrate throughout the entire experiment. The initial composition of molasses wastewater was measured prior to the start of the experiment. The composition of molasses wastewater is shown in Table 1. The molasses waste-water was diluted to 10,000 mg/L during the preparation of the medium solution. Various arsenite concentrations (0.5 1.0, 1.6, and 6.0 mg/L) were prepared from NaAsO2 and dosed accordingly.
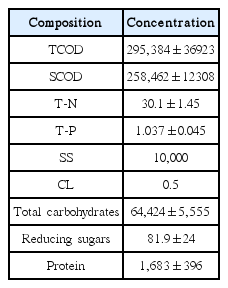
Composition of Molasses Wastewater used in this Study
2.3. PCR-DGGE Procedure
To analyze the characteristics of the hydrogen-producing microbial community, DNA was extracted from microorganisms using PowerSoil DNA Isolation Kit (MO BIO Laboratories, Inc.). 341 f and 518 primers were used to amplify the 16S rDNA followed by separation by denaturing gradient gel electrophoresis (DGGE) [8, 9]. The gels were subjected to UV illumination and photographed. Small pieces of DGGE were punched from the gel using a sterile blade and blocks were transferred in 2 μl sterile tubes [10]. 30 μl of 1× (TAE) buffer was added to the tubes to separate the DNA from the gel. The separated DNA was re-amplified and the (PCR) generated were sequenced. Each DGGE band profile represented a gene fragment of a unique 16 s rDNA sequence, which was analyzed using the BLAST program [11] for microbial identification.
2.4. SBR Setup and Operation
A hydrogen fermentation experiment was conducted in the batch reactor which has 1.5 L working volume as shown in Fig. 1. The reactor was operated at a semi continuous mode, in a series of three batch cycles. Hydraulic retention time and working volume of the batch reactor was 85 hours and 1.5 L respectively. Injection or decanting volume was 66 % of the working volume. The concentration of arsenite in the reactor was kept as 0.5, 1.0, 1.6, and 6.0 mg/L according to the purpose of the experimental condition. The composition of the medium solution for one liter was 38.5 mL of molasses wastewater, 2 g of NH4HCO3, 1 g of KH2PO4, 100 mg of MgSO4.7H2O, 10 mg of NaCl, 10 mg of NaMoO4.2H2O, 10 mg of CaCl2.2H2O, 15 mg of MnSO4.7H2O, and 2.78 mg of FeCl2 [12]. The temperature was monitored and controlled at 305±5°C. The reactor was continuously stirred at a constant rate of 250 rpm using a magnetic stirrer, while the pH of the solution was automatically controlled with the addition of 3N-KOH and/or 3N-HCL through peristaltic pumps. The head space of the reactor was initially filled with nitrogen gas in order to maintain the anaerobic condition. After reactor construction, 15 mL of acclimated seed solution was added and biogas was collected in a gas collector filled with 2% aqueous H2SO4 solution. The total gas volume was measured and 0.5 mL aliquots of gas were withdrawn daily from the head space of the reactor at regular intervals. In addition, 2 mL sample medium were collected periodically and stored at 4°C for further analysis.

A schematic diagram of SBR for fermentative hydrogen production.
2.5. Analytical Methods
The composition of the biogas in the reactor was analyzed using gas chromatography (GOW Mac Series 350) equipped with a thermal conductivity detector (TCD). Chromatography separations of reactor samples were achieved using a 6′ × 1/8″ stainless steel SS 350A Molsieve 13 × (80/100). Nitrogen gas was used as a carrier gas at a flow rate of 30 mL/min and the operating temperatures of the injection port, oven, and detector were 80, 100, and 100 respectively.
Volatile fatty acids (VFAs) were analyzed using a high performance liquid chromatograph (HPLC) system (GILSON, France) equipped with a UV detector operated at 210nm and a Supelcogel C-610H (130 mm × 7.8 mm ID) column [8]. Chemical oxygen demand (COD) and volatile suspended solid (VSS) concentration were determined according to the standard method procedures [13]. Carbohydrates concentration was measured using the phenol sulfuric acid method [14]. Heavy metal concentrations were analyzed using an atomic absorption spectrometer (AA spectrometer, S SERIES; Thermo Electron cooperation, USA).
2.6. Kinetic Modeling
The cumulative hydrogen production curves were fitted using a modified Gompertz equation (Eq. (1)), [15, 16]
where H is the cumulative hydrogen production (mL), λ is the lag phase time (h), P is the hydrogen production potential (mL), R is the maximum hydrogen production rate (mL/h), t is the incubation time (h), and e is the exp (1) = 2.718. Parameters were estimated using the curve fit function of sigma plot 2002 (SPSS Science, U.K.)
The amount of hydrogen production with various arsenite concentrations was calculated using the hydrogen production ration (Rh) (Eq. (2)) [8]. Rh was defined as the fraction of hydrogen produced over 85 h by arsenite dosed seed microflora compared to the control.
Where Hm and Hc denote the amount of hydrogen produced over 85 h by metal-dosed seed microflora and the control, respectively.
3. Results and Discussion
3.1. Inhibitory Effects on Continuous Hydrogen Production in SBR
Fig. 2 shows the cumulative hydrogen production curves of molasses in the presence of arsenite with various concentrations. The cumulative amount of produced hydrogen was identified based on the total biogas production and hydrogen gas content. The kinetic parameters were then estimated based on Eq. (1) and are listed in Table 2. No hydrogen was produced in the third batch cycle at all tested concentrations. The hydrogen yield values of the control were calculated as 27.99, 26.23, and 19.38 mL/g-COD in the first, second, and third cycles, respectively, based on the amount of carbohydrate consumed in the medium. In the first batch cycle of the arsenite dosed seed microflora, the hydrogen production potential (P) values show both stimulation (0.5, 1.0 and 1.6 mg/L) and inhibition (6.0 mg/L). This result implies that heavy metal at a certain range of concentrations can be stimulatory or inhibitory [17]. In the second batch cycle, the hydrogen production decreased substantially with values by more than 10 times less than the control. Complete inhibition occurred in the third cycle with no hydrogen produced at all tested concentrations. The inhibition effects can be attributed to the sequential dosage of arsenite concentrations inside the reactor. Hydrogen production potentials (P) were dependent upon the arsenite concentrations and sequential arsenite dosages, while the maximum hydrogen production rate (R) was independent of the arsenite concentrations. The H2 yields were identical to the hydrogen production potentials, displaying the same trend of stimulation and inhibition at all tested concentrations. Previous studies using a batch reactor reported the use of heavy metal to stimulate hydrogen production at certain concentration ranges [8, 18], which was not always true when using SBR. The results from this study show that sequential dosage of arsenite severely inhibited continuous hydrogen production and caused adverse effects on SBR performance.
Cumulative hydrogen production curves at various arsenite concentrations in a series of three batch cycles using a sequence batch reactor. (a) First batch cycle, (b) Second batch cycle, (c) Third batch cycle.
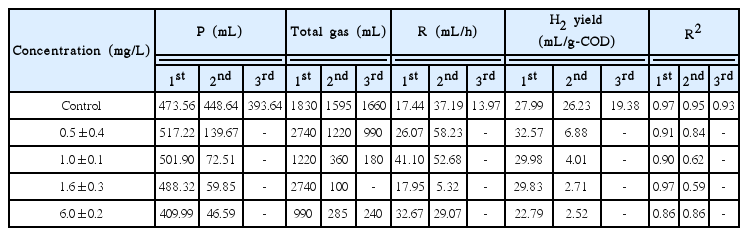
Modified Gompertz Equation Parameters
Fig. 3 shows the relationship between the hydrogen production ratios (Rh) calculated using Eq. (2) and the arsenite concentrations. In the first batch cycle, Rh exceeded 100% as 111%, 102.6%, and 101.43% at 0.5, 1.0, and 1.6 mg/L. respectively. Concentrations lower than 2.0 mg/L stimulated hydrogen production, while concentrations higher than about 2.0 mg/L inhibited hydrogen production and Rh was less than 100%. In the second and third cycles, Rh was below 100% for all tested concentrations, indicating arsenite toxicity on continuous hydrogen production. The result shows that the toxic effects increased with respect to the increase in metal concentration and sequential batch cycles. The order of toxic density according to concentration and batch operations was 6.0 > 1.6 > 1.0 > 0.5 mg/L and the third cycle > second cycle > first batch cycles, respectively. Thus, heavy metal decreased the ability of hydrogen producing microorganisms to withstand additional stress caused by increase in arsenite concentrations and the sequential dosage of arsenite in the SBR, respectively.

Relationship between hydrogen production ratio (Rh) and metal concentration. Regression of experimental data was performed using Sigma plot of SPSS Science Inc. using a linear equation.
3.2. Volatile Fatty Acids (VFAs)
Fermentative hydrogen production was accompanied by the production of volatile fatty acids (VFAs) during the anaerobic digestion process. Production of acidic intermediate reflects the changes in the metabolic process involved and provides information to improve the condition to be favorable for H2 production [19]. The soluble fermentative products included ethanol (EtOH), acetic acid (HAc), propionic acid (HPr), and butyric acid (HBu). In general, acetate and butyrate production favors hydrogen production. The stoichiometric yields are 4 moles of H2 for each mole of glucose in the production of acetic acid, according to Eq. (3), and 2 moles of hydrogen in the production of butyric acid, according to Eq. (4) [20, 21].
VFA concentrations were measured at the end of each batch cycle. The concentrations of volatile fatty acids varied in each batch cycle. In the first batch cycles, butyric and acetic acid were found to be dominant. The concentration of butyric and acetic acid did not show significant changes during the second batch cycles; however, hydrogen production was decreased substantially. This can be attributed to the increase of propionic acid, which resulted in a decrease of hydrogen production. It has been reported that the increase of propionic acid induces poor hydrogen production in dark hydrogen fermentation [22]. In the third batch cycle, a small amount of propionic and lactic acids were detected with no production of butyric and acetic acids.
The ratio of butyrate/acetate (HBu/HAc) has been reported as an indicator of the metabolic pathway and performance of the hydrogen fermentor [8]. Fig. 4 shows the HBu/HAc ratios at different batch cycles. The HBu/HAc ratio became higher as hydrogen production was increased, however; the sequential dosage of arsenite concentrations resulted into lower HBu/HAc ratios and inhibited hydrogen production in the second and third batch cycles, respectively. The trends in the HBu/HAc ratios shown in Fig. 4 were similar to those of the hydrogen production ratio shown in Fig. 3. Therefore, the HBu/HAc ratios were dependent on arsenite concentrations and sequential arsenite dosage.
Relationship between HBu/HAc ratio and arsenate concentration. Regression of experimental data was performed by sigma plot of SPSS Science Inc. using a linear equation.
3.3. DGGE Profile Analysis of Hydrogen Producing Microorganisms
The DGGE analysis on 16S rDNA was performed in an attempt to investigate the effects of arsenite on hydrogen producing microorganisms.
Fig. 5 shows various band patterns of DGGE profiles at each concentration in three batch cycles. The detailed analysis showed different bacterial genera or species based on band intensities.
DGGE profiles of PCR-amplified 16S rDNA at various arsenite concentrations and batch cycles. 1st- First batch cycle, 2nd- Second batch cycle, 3rd- Third batch cycle.
Based on band intensities, bands G, B, and C appeared in the control and were associated with higher hydrogen production. In this study, each arsenite concentration showed different band patterns as shown in Fig 5. Bands B and C were related to hydrogen production at 0.5 mg/L. Bands B and G were associated with hydrogen production at 1.0 mg/L, while band M was related to active hydrogen production at 1.6 and 6.0 mg/L, respectively. On the other hand, bands E, F, H, I, K, and L were not related to hydrogen production.
The characteristics of sequenced data according to the closest affiliation and percentage identity are shown in Table 3. Among the major bacteria taxa identified, 33.3% were affiliated to Bacteria, 6.6% to class Epsilon-proteobacteria, 26.6% to class Gamma-proteobacteria, 26.6% to phylum Firmicutes, and 6.6% to class Alpha- proteobacteria.

Affiliation of DGGE of 16S rDNA Fragments
In class Gamma-proteobacteria, pseudomonas parafulva FS04 was identified and was related to hydrogen production in the presence of arsenite as shown by band G. Pseudomonas genus has been reported to produce hydrogen by dark fermentation [23]. Enterobacter sp was also identified in class Gamma-proteobacteria and has been reported to produce hydrogen by dark fermentation [24]. However, in this study, Enterobacter sp. sed221 was not related to hydrogen production as shown by band L in Fig 5. In phylum Firmicutes, Clostridium sp. MSTE9 was related to active hydrogen production as shown by band M. Clostridium genus has been reported to produce hydrogen by dark fermentation [25]. However, in this study, the Lactococcus raffinolactis strain LHC17 and Bacillus megaterium strain AMIST4.P1.19 were not associated with hydrogen production as shown by band I and L, respectively. In class Epsilon-proteobacteria, Arcobacter sp. AF1078 was identified. This microorganism has been discovered as both animal and human pathogen and was not related to hydrogen production as shown by band E. Bacteria species such as uncultured bacterium clone 584CL3e9, and Uncultured Dysgonomonas sp. clone MEC-4 were related to hydrogen production at a lower arsenite concentration as shown by bands B and C respectively. The remaining species, Gluconacebacter hansenii strain P2A, belonged to class Alpha-proteobacteria and was associated with cellulose production [26] but not hydrogen production.
Hydrogen production was inhibited with respect to the sequential dosage of arsenite concentrations. This condition could be attributed to the change of microbial enzyme structures. Our study revealed that arsenite tolerances were decreased with the increase in induction time. However, in previous studies, heavy metal (Zn), tolerance in microorganisms was reported to increase with time exposure [27], which was not always true. Therefore, further studies based on microbial arsenite induction should be carried out to confirm the effects of arsenite on microbial enzymes. Moreover, further studies based on independent incubation should be conducted to confirm the individual contribution of each species to hydrogen production.
4. Conclusions
In this study, SBR was operated with molasses as the substrate in a series of three sequenced batch cycles. The effects of arsenite concentrations on continuous hydrogen fermentation were assessed. The experimental results are as follows:
During the first batch cycle, arsenite stimulated hydrogen production at concentrations lower than 2 mg/L, while inhibition occurred at concentrations higher than 2 mg/L. Hydrogen production decreased substantially in the second batch cycle, while no hydrogen was produced in the third batch cycle at all tested concentrations. This observation indicates that sequential dosage of arsenite concentrations severely inhibited continuous hydrogen production.
The toxic density increased with respect to the increase in arsenite concentrations (6.0 > 1.6 > 1.0 > 0.5 mg/L) and operation cycles (third cycle > second cycle > first cycle). This indicated that hydrogen production was dependent on arsenite concentration and the sequential dosage of arsenite.
The HBu/HAc ratio became higher in the first batch cycle, resulting in an increase in hydrogen production. The HBu/HAc ratio decreased in the second and third cycles, resulting in hydrogen inhibition. Trends in the HBu/HAc ratio were dependent upon arsenite concentrations and sequenced batch cycles similar to those of hydrogen production potential, hydrogen yield, and hydrogen production ratios.
Different species of microorganisms appeared at each band pattern of arsenite concentrations. Clostridium sp. MSTE9, Uncultured Dysgonomonas sp. clone MEC-4, Pseudomonas parafulva FS04, and Uncultured bacterium clone 584CL3e9 were involved with the active stimulation of hydrogen production while Arcobacter sp.AF1078, Pseudomonas sp. Ep-S-1, Bacillus megaterium strain AIMST4.P1.19, Lactococcus raffinolactis strain LHC17, and Enterobacter sp. sed221 were not related to hydrogen production. Thus, certain species belonging to class Gamma-proteobacteria did not promote hydrogen production. Therefore, it can be concluded that the tolerance of arsenite in hydrogen producing microorganisms decreased with the increase in induction time, which resulted in severing the inhibition of continuous hydrogen production.
Acknowledgments
This study was supported by An Intramural Academic research funds.