Particle size distributions and concentrations above radiators in indoor environments: Exploratory results from Xi’an, China
Article information
Abstract
Particulate matter in indoor environments has caused public concerns in recent years. The objective of this research is to explore the influence of radiators on particle size distributions and concentrations. The particle size distributions as well as concentrations above radiators and in the adjacent indoor air are monitored in forty-two indoor environments in Xi’an, China. The temperatures, relative humidity and air velocities are also measured. The particle size distributions above radiators at ten locations are analyzed. The results show that the functional difference of indoor environments has little impact on the particle size distributions above radiators. Then the effects of the environmental parameters (particle concentrations in the adjacent indoor air, temperatures, relative humidities and air velocities) on particle concentrations above radiators are assessed by applying multiple linear regression analysis. Three multiple linear regression models are established to predict the concentrations of PM10, PM2.5 and PM1 above radiators.
1. Introduction
Haze events are increasingly serious environmental problems, which recently captures the attention of the whole world. The particulate matter has widely impacts on the public health and the visibility. The outdoor particulate air pollution directly affects the particulate matters in indoor environments. Many investigations indicate that people spend about 80%–90% of their time indoors [1]. Thus indoor particles closely link to people’s life. Exposure to suspended particles has significant associations with some diseases and the increased mortality [2]. Another fate of indoor particles is deposition onto surfaces. The deposited particles may result in artworks soiling [3], equipment failure [4], surface damage [5] and so on. Therefore, the knowledge of the indoor particle dispersion and deposition is essential for avoiding damages caused by particles. Indoor particles have received considerable attention and much work has been conducted on effecting factors [6]. However, little information has been published concerning the particles above radiators. The particle deposition on the walls above radiators is a common phenomenon and frequently observed, as shown in Fig. 1. Radiators are widely used as heating equipments and some studies have reported that radiators have great effects on particle dispersion and deposition [2]. It’s necessary to know the particle distributions above radiators to explore the particle dispersion and deposition phenomena and find effective control methods. In this paper, the particle size distributions and concentrations above radiators are discussed.
Examples of the particle deposition on walls above radiators.
Great consideration has been paid to the particle size distribution in indoor environments as the fate of aerosol particles is dependent on the particle diameter [7]. Indoor particles with various sizes behave differently in terms of their motion, transport, deposition and resuspension [8, 9]. The behaviors of particles are closely connected with the people’s health and various damages [10, 11]. A volume of work has been devoted to particle size distribution analysis. Particles in different sizes emitted from different indoor processes and sources have been the subject of much research [12]. Several researchers found that the fine aerosol particles could be generated by some typical activities, such as cleaning [13], smoking [14], cooking [15] and heating [16]. The effects of outdoor particles on the indoor particle size distributions have been also discussed by a number of authors. They proved that outdoor particles had an impact on indoor particle size distributions [17–19]. HVAC (Heating, Ventilating and Air conditioning) systems are another important factor which influences the particle size distributions [20]. Although much literature is available on indoor particle size distributions, little attention has been done on the particle size distributions above radiators. The effects of some environmental parameters (such as temperatures, the relative humidities and air velocities) on indoor particles have also drawn much interest [21]. The research results indicated that the environmental parameters had an apparent influence on particles in the indoor air [22, 23]. Measurement techniques are always adopted to study the indoor particles. However, continuous measurements of indoor particles are difficult to achieve because of the high sampling cost and the instrument limitation [24]. Thus modeling methods are gradually developed and the statistical regression is one of the most common means [25]. Gauvin et al. [26] established multiple linear regression models to evaluate the contribution of indoor and outdoor factors to personal exposures. In the same year, Kousa et al. [27] presented the Log-linear regressions among the ambient fixed site, residential outdoor, residential indoor and personal leisure time levels. Later, the linear regression analysis was conducted by Kang et al. [28] to model the indoor and outdoor particle concentrations. Furthermore, Wang et al. [29] used CFD to obtain data and established a correlating multiple linear regression equation to calculate the mean air velocity and the particle concentration. Recently, Ruths et al. [30] carried out a multiple linear regression analysis to correlate particle number size distributions from a combination of pollutant and meteorological parameters in the outdoor microenvironments. Moreover, Spilak et al. [31] evaluated associations between UFP concentrations and dwelling characteristics by using a statistical approach. While much research has been devoted to the indoor particles predicted by regression models, few studies have published on the multiple linear regression analysis for particle concentrations above radiators.
In this paper, the particle size distributions and concentrations above forty-two radiators were measured. The multiple linear regression models for particle concentrations and some environmental parameters (particle concentrations in the adjacent indoor air, temperatures, relative humidity and air velocities) were established to predict the concentrations of PM10, PM2.5 and PM1 above radiators.
2. Materials and Methods
2.1. Study Area and Aampling Locations
The field sampling was carried out from December 2012 to January 2013 at seven sites in the southern part of Xi’an, China. The locations of these seven sites, which are very common in our life (include universities, communities and business centers), are marked in Fig. 2. In total, forty-two indoor environments with different functions at the seven sites were selected to conduct this measurement. The functions and corresponding quantities of these forty-two indoor environments with hot-water radiators are also listed in Fig. 2. Only one radiator in each indoor environment was used and every radiator was near a wall without obstacles. The detailed information of these radiators was recorded, which covered sizes, types, locations and so on. The particle concentrations above radiators as well as in the adjacent indoor air, temperatures, the relative humidities and the air velocities were monitored in these indoor environments.
Sketch indicating sampling areas.
2.2. Sampling Methods
A Grimm 31-Channel Portable Aerosol Spectrometer (model No.1.109; Grimm, Germany) was used to measure the particle size distributions and concentrations above radiators and in the adjacent indoor air. The dust aerosol spectrometer 1.109 is a compact portable device which can be used to conduct continuous measurements of particles. This instrument possesses an integrated gravimetric filter on which all particles are collected after an optical measurement and thus are available for further analysis [32]. The real time measuring range of the Portable Aerosol Spectrometer is in 31 channel sizes (0.25~32.00 μm) and each unit has been certified. The reproducibility of this instrument is ±3% over the whole measuring range and the sample flow rate is 1.2 L/min [32]. Many researchers adopted the Portable Aerosol Spectrometer to sample particles and obtained relatively accurate data [33, 34]. The temperature, relative humidity and air velocity at each sampling point were tested by a TSI VelociCalc Plus Air Velocity Meter (model No.8386A-M-GB; TSI, America). The air velocity meter has an air temperature range of −17.8~+93.3°C with the resolution of 0.01°C. The relative humidity range is 0~95% and the resolution is 0.1%. This instrument can detect the air velocities in the range of 0~50 m/s and the resolution is 0.01 m/s [35].
The locations of the sampling points above radiators in the forty-two indoor environments are shown in Fig. 3. These sampling points were divided into three groups, which were named “A”, “B” and “C”, according to the distance from the wall. The Group C was 2 mm away from the wall surface. When the distance of the radiator outer surface from the wall was longer than 102 mm, the gaps between Group A and B as well as Group B and C were both set as 100 mm (see Fig. 3(a)), otherwise 50 mm (see Fig. 3(b)). Generally, ten sampling points were set in each group and numbered successively from one to ten accordingly. In each group, the vertical spacing between two neighboring sampling points was 100 mm. When the distance between the upper surface of the radiator and the ceiling was not great enough to hold ten sampling points (<1000 mm), five sampling points were set to avoid interference of the ceiling. Also, three or five points in the adjacent indoor air were selected as the reference sampling points. When the room area was larger than 50 m2, there were five sampling points in the adjacent indoor air, otherwise three sampling points. The sampling points in the adjacent indoor air were all 1.5 m above the ground and far away from furnishings. These sampling points were arranged in a line or the shape of a plum blossom.
A sketch showing the sampling points above radiators (a) the distance between the radiator upper surface and the ceiling ≥ 1000 mm, the distance between the radiator outer surface and the wall > 102 mm, left view (b) the distance between the radiator upper surface and the ceiling < 1000 mm, the distance between the radiator outer surface and the wall ≤ 102 mm, left view
In this paper, the particle concentrations and size distributions were tested by the Grimm Aerosol Spectrometer after a 0.5 min self-test. The measurement at each sampling point lasted 1 min and the test result was recorded every 6 s. The average value over the 1 min served as the data used in the later analysis. The final values of the particle concentrations in the adjacent indoor air were derived from the average values at these three or five sampling points in indoor environments. The values of the temperature, relative humidity and air velocity at sampling points were recorded after the readings of TSI Air Velocity Meter were stable. The windows and doors were closed in the testing process. Also, no other persons except for testers appeared in the testing room during the measurement periods and the levels of testers’ activities were kept low. There were no new particle sources in these indoor environments.
2.3. Analytical Methods
The particle size distributions above radiators were expressed by dp-dN/dlog (dp) and dp-dM/dlog (dp) curves. Ten of the forty-two indoor environments presented as examples to explore the particle size distributions above radiators. The details of these ten locations are displayed in Table 1. The Sampling Point B1 owned the highest temperature among the sampling points above radiators and was chosen as the typical point to exhibit and analyze the particle size distributions.

The Detailed Information of the Sampling Points B1 above Different Radiators
SPSS software is a widely accepted statistical analysis tool and has been used in the field of indoor particles by several authors [36, 37]. The multiple linear regression analysis involved in SPSS 20.0 was introduced to predict the particle concentrations above radiators and the general multiple linear regression model could be expressed as follows [36]:
where Y is the dependent variable, indicates a constant coefficient, β1, β2, ··· βn represent the regression coefficients, X1, X2, ··· Xn are the independent variables and ɛ is the residual error. The approach used in this study was based on the assumption that the environmental parameters were linearly related to the particle mass concentrations above radiators.
3. Results and Discussion
3.1. Particle Size Distributions above Radiators
The particle number and mass size distributions at the Sampling Point B1 in the ten indoor environments are shown in Fig. 4(a) and (b), respectively. It can be found that the values of dN/dlog (dp) above radiators are between 0 and 6×10⁷/L and the values of dM/dlog (dp) are in the range of 0 to 3300 μg/m3. The particle numbers as a whole decrease with the particle size (see Fig. 4(a)), which exhibits a similar tendency to some studies on the indoor particle size distributions [38, 39]. The different characters of large and small particles are possibly sufficient to trigger this phenomenon. The gravitational settling is dominant for the deposition of larger particles [40] and the larger particles are difficult to be resuspended. The smaller particles can remain airborne for longer periods of time than larger particles since they are too small for the inertial deposition. However, the particle mass size distributions show different patterns. Larger particles ( > 10 μm) with a lower quantity occupy a great proportion of the particle mass above radiators, as shown in Fig. 4(b). One of the possible causes is that the enhancement of the airflow above radiators makes more large particles resuspension.
Particle size distributions at the Sampling Point B1 above different radiators (a) Particle number size distributions (b) Particle mass size distributions.
3.1.1. Effect of room functions
From Fig. 4(a) and (b), it can be surmised that the particle size distributions at these ten locations in rooms with different functions are similar to each other. Thus it can be seen that the distinct functions of indoor environments has little effect on the particle size distributions above radiators. The overall discrepancy among the particle number and mass distributions above radiators depends on the background concentrations in indoor environments. By comparing these curves in Fig. 4, it is noteworthy that the number and mass of larger ( > 10 μm) and smaller ( < 1 μm) particles at various locations have relatively great differences.
3.1.2. Effect of temperature, relative humidity and air velocity
The temperatures, relative humidity and air velocities of the Sampling Points B1 at ten locations are reported in Table 1. The temperatures are always high at these sampling points, while the relative humidities are relatively low. It can be observed in Table 1 and Fig. 4 that temperatures, relative humidities and air velocities closely link to the particle size distributions. There are some particles larger than 10μm at almost all the Sampling Points B1 above radiators, which is different from the measurement results in the adjacent indoor air. The quantities of larger particles ( > 10 μm) are correlated with the air velocities above radiators. It is likely that the greater air velocities can impede the depositions of some larger particles or make them resuspension. The smaller particles ( < 1 μm) are more susceptible to airflow and the thermophoresis. The mass of smaller particles is high at some locations (such as Locations 1 and 2) with high temperatures whereas that at other locations (such as Locations 7 and 10) with high temperatures is low. This phenomenon may be attributed to the combined action of the airflow pattern and the thermophoretic force. The number and mass distributions for 0–10 μm particles at locations at the same site, such as the Locations 1 and 2, are closer than other locations. A possible explanation for this is that the background particles within a certain time have effects on the particle size distributions above radiators.
3.2. Particle Mass Concentrations above Radiators and Effecting Factors
3.2.1. Multiple linear regression models
Knowing the particle concentrations above radiators can help to understand the effect of radiators on particle dispersion and deposition. In order to obtain the quantitative relation between the particle concentrations above radiators and some environmental parameters, the multiple linear regression analysis was carried out. The concentrations of PM10 above radiators in the forty-two investigated housing units vary from approximately 43.7 to 222.9 μg/m3. The concentrations of PM2.5 and PM1 above radiators are lower than those of PM10, which are 33.4–213.1 μg/m3 and 21.3–201.6 μg/m3, respectively. The multiple linear regression technique was used as a tool for detecting quantitative relations between particle concentrations above radiators and related environmental parameters, assuming a linear relationship. The coefficient of determination (R2), which was used to describe the strength of the association and the statistical significance of the results, was also evaluated. The multiple linear regression analysis results were reflected by the regression coefficients with their 95% confidence interval and the significance level was 0.05.
Table 2 lists the multiple linear regression results for the concentrations of PM10 above radiators and the multiple linear regression model is also proposed. The adjusted coefficient of multiple determinations, which is 0.800, gives the proportion of the variation in the PM10 concentrations above radiators explained by the environmental parameters. And that is, 80.0% of the variation in the dependent variable can be explained by the independent variables shown in Table 2. The relationships exhibited in this multiple linear regression equation declare that the concentrations of PM10 in the adjacent indoor air have a significant impact on that above radiators. Also, the results suggest negative correlations between the concentrations of PM10 above radiators and the temperatures. The measurement data shows that a negative correlation exists between the concentrations of PM10 above radiators and the relative humidities. The constant coefficient and three regressions coefficients are all statistically highly significant (p < 0.01)
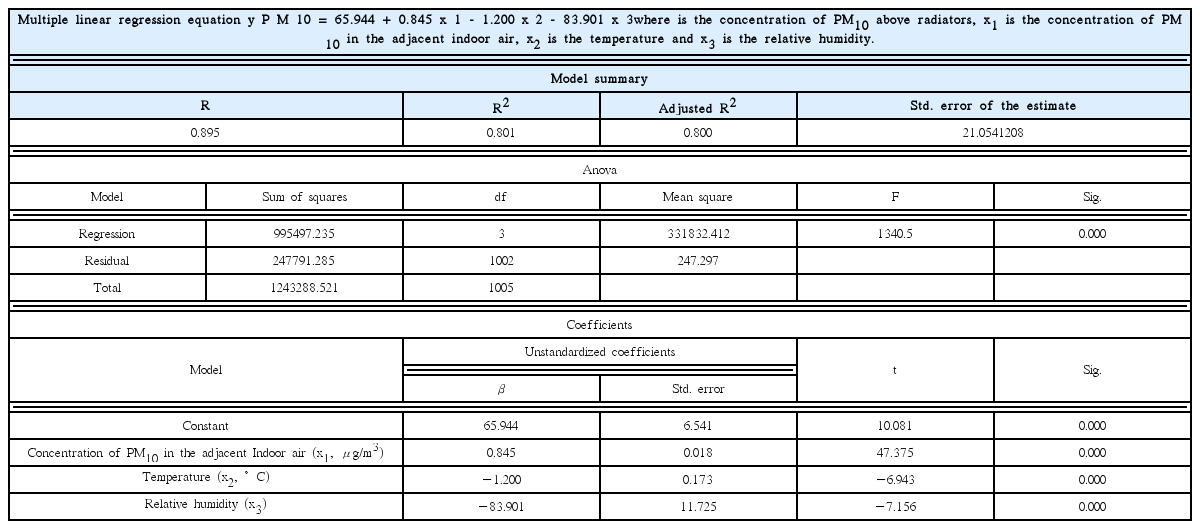
Results of the Multiple Linear Regression Analysis for the Concentration of PM10 above Radiators
The results of the multiple linear regression analysis for the concentrations of PM2.5 above radiators are presented in Table 3. When the three variables (concentrations of PM2.5 in the adjacent indoor air, temperatures and the relative humidity) are fitted to the concentration data, the value of the adjusted coefficient of determinations is 0.929. The multiple linear regression results indicate that the concentrations of PM2.5 above radiators are strongly dependent on that in the adjacent indoor air and the β is 0.884. Besides, in this model, there is a significant correlation between the temperatures and the concentrations of PM2.5 above radiators. The multiple linear regression analysis also presents that the concentrations of PM2.5 above radiators are influenced by the relative humidities. The constant and coefficients of regressions are all significant at the 0.01 level (p = 0.000).
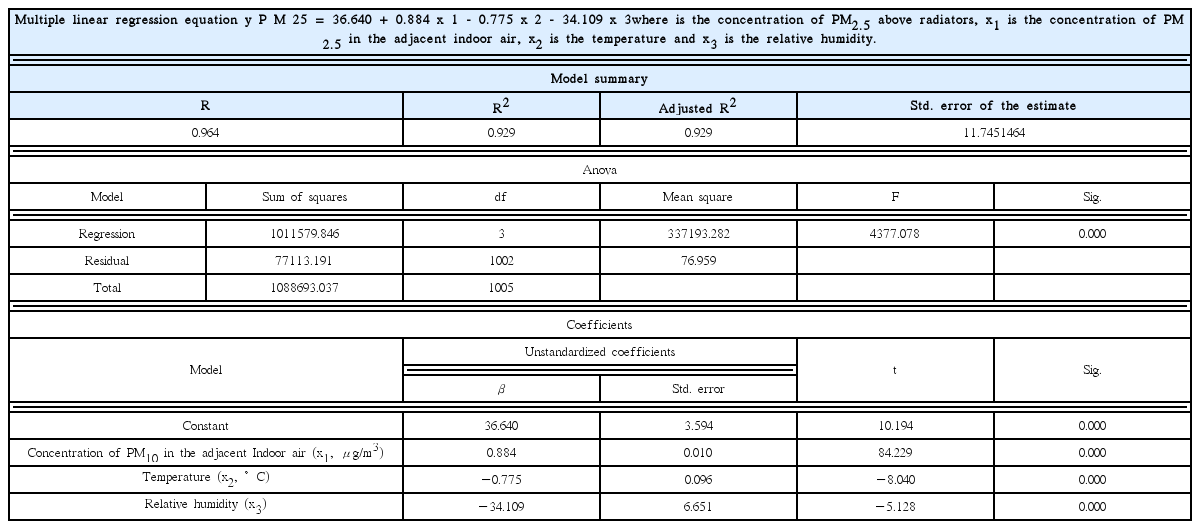
Results of the Multiple Linear Regression Analysis for the Concentration of PM2.5 above Radiators
Table 4 displays the analysis results of the concentrations of PM1 above radiators. For the concentration of PM1, the value of the adjusted R2 is 0.962, which means that 96.2% of the variation in the concentrations of PM1 above radiators is explained by these four independent variables. The measurement data reveals a good linear relationship between the concentrations of PM1 above radiators and in the adjacent indoor air. The concentrations of PM1 above radiators have a negative correlation with the temperature and the relative humidity. It is worth noting that the air velocities have a positive association with the concentrations of PM1 above radiators (p < 0.05).
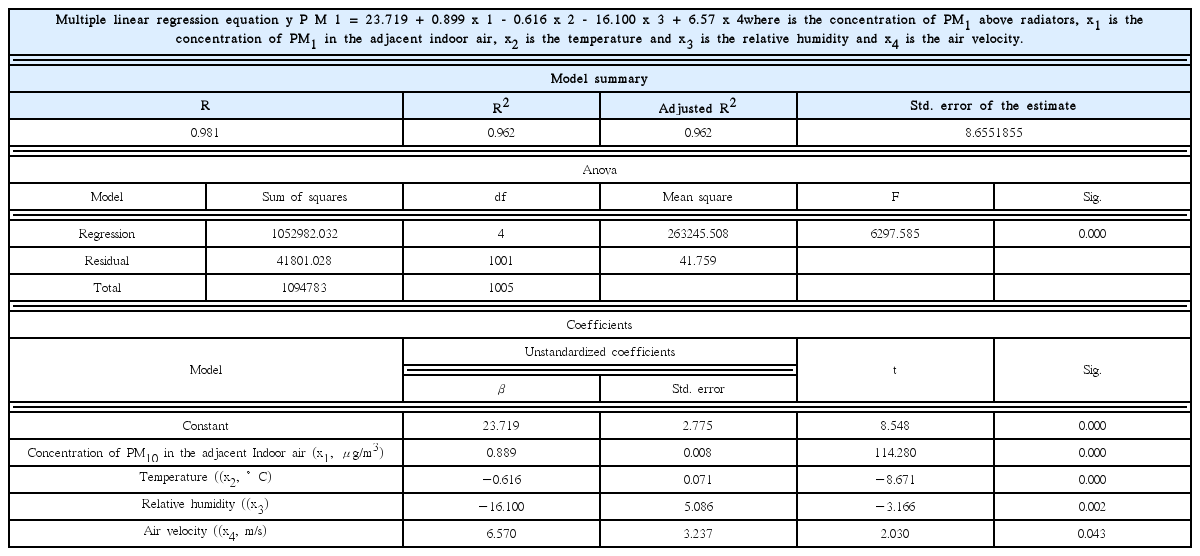
Results of the Multiple Linear Regression Analysis for the Concentration of PM1 above Radiators
3.2.2. Effect of environmental parameters
The above three multiple linear regression models with relative high adjusted coefficients of determinations are all capable of predicting the corresponding particle concentrations above radiators. Among these three equations, the particle concentration prediction model for PM1 above radiators (adjusted R2 = 0.962) is the best. The concentrations of PM10, PM2.5 and PM1 above radiators are affected by particle concentrations in the adjacent indoor air. The data reported here suggest that the particle concentrations above radiators are closely tied to that in the adjacent indoor air. This result is expected and easy to understand. The zone above radiators connects with the adjacent indoor environment and the particles in these two spaces interact on each other. The concentrations of PM10, PM2.5 and PM1 above radiators all have negative correlations with the temperatures. The similar relationship between the particle concentrations and temperatures has also been reported by Sarwar et al. [41]. When there is a temperature gradient, small particles suspending in the air will create a fast flow away from the place with higher temperature (opposite to the temperature gradient), which leads to the negative correlation between the particle concentrations above radiators and the temperatures. In accordance with the findings of Fromme et al. [42], the particle concentrations increase with the decreasing relative humidity. One reason for this could be that the small particles prone to condense in the air with high relative humidity. The air velocities are not detected associations with concentrations of PM10 and PM2.5 above radiators. Instead, a weak positive correlation has been found between concentrations of the PM1 above radiators and the air velocities. This most likely arises from the fact that small particles have low inertia and are influenced by airflow pattern more seriously. Besides, the larger air velocities will result in more resuspension of previously settled particles.
4. Conclusions
The particle size distributions above radiators were examined and discussed, and then the multiple linear regression analysis was employed to correlate the particle concentrations above radiators and environmental parameters. Based on the investigations presented in this paper, the following conclusions may be drawn:
Larger particles ( > 10 μm) with a lower quantity occupy a great proportion of the particle mass above radiators. The functional difference among indoor environments has little effect on the particle size distributions above radiators. The number and mass of larger ( > 10 μm) and smaller ( < 1 μm) particles at locations in different indoor environments have relatively great difference.
The environmental parameters (particle concentrations in the adjacent indoor air, temperatures, relative humidities and air velocities) are related to the particle concentrations above radiators with various degrees. Three multiple linear regression models are proposed to predict the concentrations of PM10, PM2.5 and PM1 above radiators.
The results of this measurement may be useful to researchers attempting to gain more understanding of the particle distributions above radiators. Generally speaking, several factors always influence the particle concentrations simultaneously. The hot air rising from radiators has a great effect on the particle behaviors. The current descriptions of particle dispersion and deposition above radiators are far from complete. For a robust understanding of the particle behavior above radiators, more studies need to be conducted.
Acknowledgments
This research project is sponsored by the Fundamental Research Funds for the Henan Provincial Colleges and Universities in Henan University of Technology (No. 2015QNJH05) as well as the Key Scientific Research Project for Universities in Henan, China (No. 15A560004).