Cadmium removal by Anabaena doliolum Ind1 isolated from a coal mining area in Meghalaya, India: associated structural and physiological alterations
Article information
Abstract
The cyanobacterium Anabaena doliolum Ind1 isolated from a coal mining site was tested for removal of cadmium at optimum pH 7.0 and temperature 25°C. The organism recorded high percentage of metal removal (92-69%) within seven days of exposure to 0.5–2.0 ppm cadmium. Biosorption onto the cell surface was the primary mode of metal removal. Fourier transform infrared spectroscopy (FTIR) established hydroxyl, amides, carboxyl, sulphate and carbonyl groups to be the major functional groups on the cell surface involved in cadmium binding. Cellular ultrastructure and a range of vital physiological processes (i.e., photosynthetic pigments, respiration, photosynthesis, heterocyst frequency and nitrogenase activity) remained unaffected upon 0.5 ppm treatment; higher concentrations of cadmium exerted visible adverse effects. Amongst the five photosynthetic pigments tested, phycocyanin was the most targeted pigment (inhibition was 15–89%). Both respiration and photosynthetic activities were inhibited by cadmium with more severe effect seen on respiration. 2.0 ppm cadmium exposure also had drastic negative effect on nitrogenase activity (87% decreased).
1. Introduction
An understanding of the physiological responses of microbes to varied metal ions is of prime significance to realize the impact of cationic species on aquatic environment. Many heavy metals such as copper, zinc, magnesium, manganese and iron are vital micronutrients that play important roles in biological systems. However these metals can be toxic when present in excess. Permissible limit of exposure of few such metals in adults as per DRI reports [1] are: Cu 10 mg/day, Zn 40 mg/day, Mg 350 mg/day, Mn 11 mg/day, Fe 45 mg/day. Beyond these values, prolonged exposure may adversely affect the physical wellbeing. In recent times, many other metals such as cadmium, lead, nickel, chromium with no known biological function are increasing in the environment due to various anthropogenic activities such as mining of coal and uranium, agricultural runoffs and release of industrial and domestic effluents [2]. Metal contaminants are of particular concern to humans, being at the top of the consumers in any food chain. Cadmium for example, is highly toxic to living organisms and thus has received substantial attention among researchers. Cadmium is frequently found as a fresh water contaminant and the rising levels of cadmium in water bodies have been shown to be detrimental to all constituents of aquatic communities [3–5]. In past few decades, the problem of increasing metal ions in the water bodies have been realized and substantial research work has been devoted towards studying removal of toxic metal ions from polluted waters using bioremediation techniques, especially those that employ live or dead microbial biomass [6, 7]. In addition to metal concentration, toxicity of heavy metals is mediated by interplay among various other factors including temperature, pH, salinity, dissolved organic matter, concentration of various inorganic ions and biomass of the components of biota [8–11]. Microorganisms like algae and cyanobacteria form the base of the complex aquatic food web and are primary metal accumulators in these habitats [5, 12]. Thus they play important roles in reducing metal load of an aquatic ecosystem where they exist. But continuous exposure to toxic levels of heavy metals cause substantial changes in many metabolic variables in microbes including growth, photosynthetic characteristics, carbon and nitrogen fixation and in levels of reactive oxygen species [10, 13–23]. Different organisms show variable sensitivities towards the same metal and different metals may not result in similar effects in the same organism [19, 24].
Many microorganisms including cyanobacteria show ability to endure and interact with metal ions. Cyanobacteria are ubiquitous, photosynthetic, nitrogen fixing organisms showing tremendous resilience under extreme conditions [25–30]. In recent years cyanobacteria-based bioremediation has been in focus in approaching clean-up operations of contaminated soil and water [31]. Many studies have proved the substantial metal binding capacity of different cyanobacteria [2, 32–40]. Heavy metal removal by these organisms essentially involve a rapid phase of passive surface adsorption followed by energy dependent slower phase of metal ion transport across cell membrane leading to intracellular accumulation [41–44]. Chojnacka et al. [45] reported that the negatively charged functional groups such as hydroxyl, sulfhydryl, carboxyl, etc. on the cell surface of microorganisms are responsible for binding metal cations from contaminated waters.
Studies have shown that living biomass exhibit better biosorption potential than dead biomass perhaps due to (1) continuous production of newer cell surfaces via cell division for efficient metal binding and (2) intracellular accumulation owing to the availability of energy produced by metabolic activities in the living cells [46, 47]. Recently, Dixit and Singh [40] have also shown that live Nostoc muscorum cells could be reused after the adsorbed metal is extracted using suitable desorbing media. Since Anabaena doliolum Ind1 is not known to be a toxic cyanobacterium, it is safe to use live biomass taking into account the obvious advantages of using live organisms for bioremediation.
Furthering the work on cyanobacteria-based bioremediation, this is a comprehensive study on the cadmium removal potential of a cyanobacterium isolated from a coal mining site having cadmium concentration in the range of 0.25–0.3 ppm, which was higher than its normal occurrence in nature (0.1–0.2 ppm). Since cadmium is highly toxic to living organisms, this cyanobacterium’s presence in these waters indicated its tolerance to high cadmium concentration which evoked our interest in the organism. Live biomass of the organism was used in the study since living cells show obvious advantages over dead biomass as pointed out in the previous paragraph. Effect of pH on metal removal was analysed within a narrow range of 6.0–8.0 in the study keeping in mind that the pH of various water bodies of the region fluctuates between 6.0–7.5. Since cyanobacteria are known to form akinetes under extreme temperatures, luxuriant growth that would allow any considerable metal removal happens within the range of temperature 20–30°C. Therefore, this range of temperature was selected. As continuous presence in higher concentrations of cadmium is detrimental to living organisms, various structural and biochemical changes in the cyanobacterium due to high cadmium exposure were also investigated in the study.
2. Materials and Methods
2.1. Identification of the Organism
Water sample was collected from a water body adjacent to a coal mining site in Cheiruphi, Jaintia Hills district, Meghalaya, India. The water sample was inoculated in freshly prepared BG110 media (pH 7.5) to allow growth of cyanobacteria [48]. After a period of 10 days, the growing cyanobacterial filaments were purified by repeated rounds of plating on 1.5% agar supplemented media [49] and the isolate was maintained in the same media in a culture room at 25±2°C under continuous light with a photon fluence rate of 50 μmol/(m2·sec). Genomic DNA was isolated from the cyanobacterium using MiniPrep Bacterial Genomic DNA method [50] and its quality was tested on a 1.2% agarose gel. Fragment of 16S rRNA gene from the isolated DNA was amplified by PCR and the purified amplicon was used for sequencing. Forward and reverse DNA sequencing reaction of the PCR amplicon was carried out in Xceleris Labs, Ahmedabad with CY106F (5′-CGG ACG GGT GAG TAA CGC GTG A-3′) and CY781R {equimolar mixture of CY781R(A) 5′-GAC TAC TGG GGT ATC TAA TCC CAT T-3′ and CY781R(B) 5′-GAC TAC AGG GGT ATC TAA TCC CTT T-3′} primers using BDT v3.1 Cycle sequencing kit on 3730xl Genetic Analyzer (Applied Biosystems, USA) [51]. Related sequences were retrieved from NCBI Genbank database using BLAST and based on maximum identity score first 15 sequences were selected and aligned using multiple alignment software program Clustal W. Distance matrix was generated using RDP database and the phylogenetic tree was constructed using MEGA 5 [52].
2.2. Metal Treatment
3CdSO4·8H2O was used as the source of cadmium for all experiments and working solutions of 0.5, 1.0, 1.5 and 2.0 ppm in BG110 media were made using the same. Ten day old mid-log phase cyanobacterial cells were used for all experiments and the culture concentration throughout the study was kept constant at 3 μg/mL of chlorophyll a. All experimental setups were kept in culture room under fluorescent light at a photon fluence rate of 50 μmol/(m2·sec) with continuous illumination. Cells were harvested every seven days by centrifuging at 3,000 rpm for 10 min for conducting experiments.
2.3. Parameter Optimization for Cadmium Removal
Two parameters, (i.e., pH and temperature) of the experimental procedure were optimized to achieve best results. Cadmium removal by the organism was studied under combinations of three different pH (6.0, 7.0 and 8.0) and temperature (20, 25 and 30°C) ranges. Cyanobacterial cells were added to nine flasks containing 0.5 ppm Cd in media in varying combinations of pH and temperature. Cells were harvested at the end of seven days by centrifugation and the supernatant was analysed for presence of residual metal using atomic absorption spectrophotometer (3110; Perkin Elmer, USA).
2.4. Cadmium Removal
Metal removal by the organism and distribution of metal ions within the cyanobacterial cells was analysed using atomic absorption spectroscopy (AAS) as per method described by Zakaria [34] with modifications from Nongrum and Syiem [21]. 3 mL test solutions were centrifuged at 3,000 rpm for 10 min and the amount of metal remaining in the supernatant was analysed using atomic absorption spectroscopy. This metal quantity was subtracted from the initial metal concentration of the test solutions to determine the amount of metal removed by the organism. To the pellets, 3 mL BG110 media were added and vortexed for 10 min. This was done to dislodge loosely bound metal ions from the cell surface. The solutions were again centrifuged and the amount of metal remaining in the supernatant was analysed using AAS to determine loosely bound metal ions and represented as “precipitated” in the flowchart above. The pellets obtained from this step were treated with 0.1M EDTA solution and vortexed to desorb metal ions from the cyanobacterial cell surface. This process was repeated thrice to ensure that all metal ions were desorbed. The resulting solutions were again centrifuged and supernatant analysed to quantify amount of metal ions adsorbed onto the cell surface of the test cyanobacterium. Finally, the pellet containing cyanobacterial cells was sonicated (VC-505; Sonics Vibra Cell, USA) to release all metal ions accumulated within the cells. The solution was again centrifuged and amount of metal ions intracellularly accumulated was determined using AAS (Fig. 1).
Systematic representation of the AAS procedure.
2.5. Biosorption Isotherm
Cadmium biosorption by the cyanobacterial cells was analysed using Langmuir model [53]. Cells were incubated with 0.5, 1.0, 1.5 and 2.0 ppm cadmium solutions. After 24 hr of incubation, solutions were centrifuged and metal content of the supernatant was analysed using AAS. Langmuir isotherm was calculated using the following equation –
where Ce (mg/L) is the concentration of metal in solution at equilibrium, Cads (mg/g) is the amount of metal sorbed per unit mass of the organism, Qmax (mg/g) and b are Langmuir constants related to mono layer sorption capacity and affinity of metal binding sites on the biosorbent respectively. The values of Qmax and b were calculated from the slope and intercept of the graph respectively.
2.6. FTIR Analysis of Cell Surface Functional Groups Involved in Cadmium Binding
Cells were separated by centrifuging 3 mL test solution at 3,000 rpm for 10 min. To the supernatant, double the volume (i.e., 6 mL) of 97% ethanol was added. The precipitated released exocellular polysaccharides (RPS) were collected, dried in a desiccator and solubilized in 10 mL of deionized water [37]. The extracted RPS were lyophilized, mixed with desiccated spectroscopic-grade potassium bromide 1:10 (w/w) and then subjected to Fourier Transform Infrared Spectroscopy (FTIR) (Perkin Elmer, USA) operating in the range of 4,000 cm−1 to 400 cm−1. RPS from cells not exposed to cadmium and subjected to FTIR analysis following the same procedure was treated as control.
2.7. Cadmium Induced Structural Changes
Morphological and ultrastructural changes in the organism under cadmium stress were observed under the scanning and transmission electron microscope. Samples for scanning electron microscopy (SEM) were subjected to primary fixation in 4% glutaraldehyde for 4 hr and then washed in 0.1 M sodium cacodylate buffer with three changes of 15 min at 4°C. Sample dehydration was carried out using increasing amount of acetone at 4°C. The dried samples were then mounted on brass stubs and gold-coated (Fine coat ion sputter JFC-1100; JEOL, Japan). Finally the samples were viewed under the scanning electron microscope (JEOL-JSM-6360; JEOL, Japan).
The initial steps upto dehydration was similar for transmission electron microscopy (TEM). Dehydration was followed by clearing of the samples which was carried out using propylene oxide in two changes of thirty minutes each at room temperature. Infiltration was carried out using mixture of propylene oxide and embedding medium in varying ratios. Following infiltration, the samples were transferred into embedding molds and kept in an embedding oven at 50°C for 24 hr. For polymerization the temperature of the oven was further raised to 60°C, and maintained for 48 hr. Each sample was cut into 60–90 nm sections using ultramicrotome MTX (Boeckeler Instruments, USA) and stained using uranyl acetate and lead citrate. The sections were viewed under the transmission electron microscope (JEOL-JEM-2100, 120 kV; JEOL, Japan).
2.8. Biochemical Analysis
2.8.1. Pigment estimation
Effect of increasing cadmium concentrations was studied on various photosynthetic pigments, viz, chlorophyll a, carotenoids and phycobiliproteins.
Chlorophyll a was extracted in methanol and its concentration was determined and measuring absorbance of the extract at 663 nm using a UV-Vis spectrophotometer (SmartSpec Plus; BioRad, USA) [54].
Carotenoid concentration was assayed by measuring absorbance of the N,N-dimethyl formamide (95%) extract each at 461 and 664 nm according to the method described by Morgan [55].
For phycobiliprotein (phycocyanin PC, allophycocyanin APC and phycoerythrin PE) estimations, cells were disrupted by ultrasonication using Sonics Vibra Cell sonicator (VC-505, USA) and phycobiliproteins extracted in phosphate buffer saline. Absorbance of extracts were read each at 615, 562 and 652 nm and the amounts of PC, APC and PE were calculated using equations developed by Bennett and Bogorad [56].
2.8.2. Photosynthetic and respiratory activities
Photosynthetic and respiratory rates were measured as oxygen evolution and oxygen consumption respectively by cyanobacterial cells using a Clark-type oxygen electrode installed in a Plexiglass container with magnetic stirring (Rank Brothers, England). Cyanobacterial culture was added to sample chamber of the non-polarized electrode and each sample was equilibrated for 5 min with continuous stirring. The electrode was polarized and a linear rate of oxygen evolution was recorded under light supplied by a 100 W tungsten filament bulb, which was shielded from the sample by water bath acting as heat filter. Oxygen consumption was measured in dark with the chamber wrapped in aluminium foil. The rates of photosynthesis and respiration were expressed as nmol O2 evolved or consumed/min/μg chlorophyll a [57].
2.8.3. Heterocyst frequency and nitrogenase activity
Heterocyst frequency of the cyanobacterial cells was expressed as percentage of total cells and 500 cells were counted for each calculation [58].
Nitrogenase activity was measured by acetylene reduction assay method [59]. Acetylene gas at a final concentration of 10% (v/v) of air phase was injected into vials containing 5 mL cyanobacterial culture and incubated for an hour at 25°C under light with continuous shaking. A gas chromotagraph (Varian 3900, The Netherlands) fitted with a Porapak T column (stainless steel column 6′×1/8″, packed with a Porapak T of mesh size 80/100) and a flame ionization detector was used to estimate the amount of acetylene consumed by the cyanobacterial culture. Nitrogenase activity was expressed as nmol C2H2 consumed/μg chlorophyll a/hr.
3. Results
3.1. Identification
The cyanobacterial culture was identified as Anabaena doliolum Ind1 (GenBank Accession No: HM573455.1) based on nucleotide homology and phylogenetic analysis. Evolutionary history was inferred using Neighbor-Joining method [60] and the bootstrap consensus tree inferred from 1,000 replicates was taken to represent evolutionary history of the taxa analysed [61]. Branches corresponding to partitions reproduced in less than 50% bootstrap replicates were collapsed. Evolutionary distances were computed using the Kimura 2-parameter method [62] and are in the units of the number of base substitutions per site. The analysis involved 16 nucleotide sequences. Codon positions included were 1st + 2nd + 3rd + noncoding and all positions containing gaps and missing data were eliminated (Fig. 2).

Phylogenetic analysis of the organism.
3.2. Factors Regulating Metal Uptake
Effect of pH and temperature vs. metal uptake is presented in Table 1. Amount of cadmium removed by the cyanobacterial cells was highest (91.2%) at pH 7.0 and temperature 25°C compared to all other pH and temperature variations tested. Therefore, all further experiments were conducted at pH 7.0 and temperature 25°C.
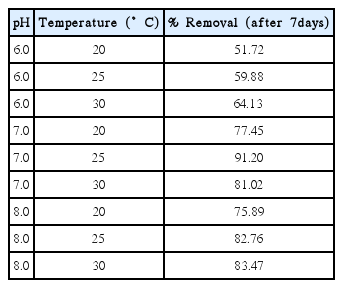
Removal of Cadmium Ions by Anabaena doliolum Ind1 Cells Exposed to 0.5 ppm Cadmium
3.3. Metal Removal
Percentage of cadmium ions removed by the organism was directly proportional to the initial metal concentration supplied in media. Amount of cadmium removed was 0.456, 0.734, 1.115 and 1.372 ppm by the cells from media containing 0.5, 1.0, 1.5 and 2.0 ppm cadmium after 7 days. When converted in terms of metal removed by per gram of cyanobacterial biomass, these values corresponded to 17.48 mg/g, 28.13 mg/g, 42.73 mg/g and 52.59 mg/g respectively. The same values represented 91.2%, 73.4%, 74.33% and 68.6% of metal removed when expressed in percentage. As seen from the above calculations, metal uptake increased from 0.456 ppm to 1.372 ppm when initial cadmium concentration in the experimental medium was increased from 0.5 ppm to 2.0 ppm, however, percent uptake decreased from 91.2% to 68.6% (Fig. 3).

Removal of cadmium ions by Anabaena doliolum Ind1 cells.
Analysis of the distribution pattern of the removed metal ions revealed that metal removal by the Anabaena doliolum Ind1 cells was primarily a surface phenomenon. A large proportion of the removed cadmium ions were adsorbed onto the cell surface. Of the total amount of metal that was removed by the organism from the media, the amount of cadmium adsorbed was 15.03 mg/g of cells (for 0.5 ppm); 23.63 mg/g (for 1.0 ppm); 32.91 mg/g (for 1.5 ppm) and 41.02 mg/g for (2.0 ppm) that corresponded to 86%, 84%, 77%, 78% respectively. Under same treatment much less amount of cadmium was accumulated intracellularly (7%, 11%, 16%, 15%). A very miniscule fraction of the removed cadmium ions was loosely bound to the cell surface which could be easily dislodged by vortexing with media a couple of times (Fig. 4).

Cellular distribution of removed cadmium ions within the Anabaena doliolum Ind1 cells.
3.4. Biosorption Isotherm
Cadmium biosorption fitted the Langmuir isotherm model (R2=0.9234) (Fig. 5). Langmuir isotherm parameters were calculated as Qmax=200 mg/g, b=0.167 and R2=0.9234. Maximum adsorption capability of the A. doliolum Ind1 cells for cadmium was found to be 200 mg/g at conditions tested.

Langmuir isotherm for biosorption of cadmium onto Anabaena doliolum Ind1 cells.
3.5. FTIR Analysis
FTIR spectral analysis of the extracted RPS of control and cadmium-treated cells showed significant variations at many regions (Fig. 6). A strong peak at 3,427 cm−1 in the spectra of cadmium treated cells compared to that of a relatively weaker peak in control cells indicated involvement of hydroxyl (–OH) groups in binding cadmium ions. Another strong peak at 1,635 cm−1 was due to C=O stretching mode of primary & secondary amides and hinted at the possible role of carbonyl (–C=O) functional group in binding. Major modifications in spectra of cadmium treated cells at wave numbers 1,534, 1,390, 1,241 and 1,024 cm−1 were due to amides, carboxyl, sulphate and carbonyl groups respectively, suggesting their involvement in metal binding.

FTIR spectra of exopolysaccharides of control and cadmium treated cells. C=control.
3.6. Morphology and Ultrastructure
No visible changes were noticed in cell morphology upon treatment with 0.5 ppm cadmium for seven days (Fig. 7(b)) compared to control cells (Fig. 7(a)). Beyond this concentration, degree of stress (manifested as distortion in cell shape and size) increased with increase in cadmium in media. Cadmium at a concentration of 1.0 ppm caused slight elongation of the cells (Fig. 7(c)). The extent of elongation and shrivelling increased in the cells and breakage in the filaments were apparent in cultures treated with 1.5 ppm cadmium (Fig. 7(d)). Considerable distortion and shrivelling of individual cells along with definite breaks in the filaments at several places were visible in cells treated with 2.0 ppm cadmium (Fig. 7(e)).
Scanning electron micrographs of control and cadmium treated cells. a: control, b: cells treated with 0.5 ppm cadmium, c: cells treated with 1.0 ppm cadmium, d: cells treated with 1.5 ppm cadmium, e: cells treated with 2.0 ppm cadmium.
Ultrastructural study using transmission electron micrographs of untreated cells showed even cellular content and intact thylakoid membranes (Fig. 8(a)). Internal organization of the cyanobacterial cells remained unchanged when incubated with 0.5 ppm cadmium for seven days (Fig. 8(b)). Increase in inter-membrane space was the most prominent change noticed in cells treated with 1.0 ppm cadmium (Fig. 8(c)). Disintegration of thylakoid membranes and appearance of intra-thylakoid spaces were visible in cells exposed to 1.5 ppm cadmium (Fig. 8(d)). Severe damage to all the cellular components and complete disintegration of the inner membrane was obvious in cells treated with 2.0 ppm cadmium (Fig. 8(e)).

Transmission electron micrographs of control and cadmium treated cells. a: control, b: cells treated with 0.5 ppm cadmium, c: cells treated with 1.0 ppm cadmium, d: cells treated with 1.5 ppm cadmium, e: cells treated with 2.0 ppm cadmium.
3.7. Effect on Biochemical Parameters
3.7.1. Photosynthetic pigments
Growth of cyanobacterial cells is conventionally measured as an increase in their chlorophyll a concentration. At the end of seven day treatment no significant inhibition in growth was noticeable in cells treated with 0.5 ppm cadmium. There was only 4% reduction in the chlorophyll a content as compared to the control. With increasing metal concentrations, growth was considerably affected. Cells treated with 1.0, 1.5 and 2.0 ppm cadmium recorded 28%, 68% and 87% reduction in their chlorophyll a content. Cadmium at 0.5 ppm concentration did not significantly alter any of the other pigments. Beyond 0.5 ppm, increasing inhibition in the concentration of all pigments was seen. Significant adverse effects (54%) in phycoerythrin followed by carotenoid (49%), allophycocyanin (41%) and phycocyanin (27%) were visible upon exposure to 1.0 ppm cadmium. The reduction in pigment concentration in cells treated with 1.5 ppm cadmium was in the following order: phycoerythrin (69%), allophycocyanin (67%), carotenoids (66%) and phycocyanin (58%). Synthesis of all five pigments was severely inhibited (85–90%) in cells incubated with 2.0 ppm cadmium by the seventh day (Table 2).

Pigment Concentration (in μg/mL) on day 7 in Control and Cadmium Treated Cells (All values are mean ± Standard deviation)
3.7.2. Photosynthesis and respiration
Respiration was found to be more affected by cadmium compared to photosynthesis at all concentrations tested. Exposure to 0.5 ppm cadmium inhibited photosynthetic and respiratory rates only by 9% and 13% respectively. Photosynthetic rates reduced by 29%, 46% and 77% in cells treated with 1.0, 1.5 and 2.0 ppm cadmium, whereas, these values were 46%, 62% and 80% respectively in case of respiration (Fig. 9).
Photosynthetic and respiratory rates in control and cadmium treated cells. C=control.
3.7.3. Heterocyst frequency and nitrogenase activity
The percentage decline in nitrogenase activity and heterocyst frequency in 0.5 ppm cadmium treated cells were 7% and 5% respectively. Decrease in nitrogenase activity was 31%, 55% and 87% in cells incubated with 1.0, 1.5 and 2.0 ppm cadmium respectively. Heterocyst frequency reduced by 37% and 55% in 1.0 and 1.5 ppm cadmium treated cells. The cyanobacterial filaments were fragmented in 2.0 ppm cadmium exposed cultures due to which heterocysts could not be counted at that concentration (Fig. 10).

Heterocyst frequencies and nitrogenase activities in control and cadmium treated cells. C=control.
4 Discussion
Best removal of cadmium by the cyanobacterium was found under conditions of temperature 25°C and pH 7.0. As seen from the Table 1, the organism showed good percentage of cadmium removal even at pH 6.0. Substantial cadmium removal was also noted at pH 8.0 indicating the inherent ability of this organism in amassing cadmium from its surrounding. However, maximum cadmium removal seen at pH 7.0 may be explained from the total number of ionic charges present around the vicinity of the organism. At pH 6.0, the lower percentage of cadmium removal could be due to the fact that at low pH the increased concentration of H+ ions competes with metal ions for the negatively charged metal-binding sites on the cell surface. Again at pH 8.0, number of hydroxyl ions would have been definitely more in the medium than that were present at pH 7.0. Some may form hydroxides with the available metal ions thereby effectively reducing the concentration of positively charged metal ions in the cell surface surroundings. Thus this could be a reason for low metal binding efficiency at a high pH 8.0 [63–65]. Table 1 also showed that adsorption of metal ion by the Anabaena doliolum Ind1 biomass increased with increase in temperature, which is typical for the biosorption of most metal ions from their solution [66–69]. However, beyond a certain increase in temperature, the thickness of the boundary layer decreases, due to the increased tendency of the metal ions to escape from the biomass surface to the solution phase, which results in a decrease in adsorption as the temperature increases [70]. At lower temperature, binding may be favoured as the kinetic energy is low for the molecules in the solutions. For the same reason, some degree of reduction in metal binding is expected as the attractive forces between cell surface and metal ions tend to weaken due to increase in kinetic energy of the molecules at a higher temperature [71]. The actual effect of pH and temperature seen on metal removal by Anabaena doliolum Ind1 may be the result of the combination of these factors that additionally influence growth of the organism which would play a decisive role in metal sorption by modulating biomass production.
Atomic absorption spectroscopic studies established that the cyanobacterial isolate was capable of removing significant amount of cadmium from media. Amount of cadmium removed was directly proportional to the initial metal concentration supplied, suggesting that increasing metal concentration was the driving force behind uptake of metal ions by the cells. Cadmium sorption on the cyanobacterial biomass followed Langmuir isotherm model. Although an increase in metal uptake was observed with increasing metal concentration in the medium, there was decrease in percentage removal (91% to 69%) under these conditions. Since there was fixed amount of biosorbent cells in different experimental setups containing increasing amount of metal ions (0.5–2.0 ppm), functional groups available on the cell surfaces for metal binding remained constant despite increasing metal concentration in the medium. Thus the lack of sufficient surface area to accommodate more metal available in the solution was responsible for observed decreased percent metal removal [72–74]. AAS also showed that most of the removed cadmium ions were adsorbed onto the cell surface, with only a small fraction entering the cells. This indicated that metal sorption was primarily a surface phenomenon. The low intracellular accumulation of cadmium could be a result of the cell’s strategy to exclude non-essential and toxic metals from its internal milieu [11]. Major cell surface functional groups responsible for cadmium binding were found to be hydroxyl, carbonyl, carboxyl, amides and sulphate groups. Our finding was consistent with several researchers who have also reported these groups to play primary role in binding of metal ions [23, 41, 75–77].
From Langmuir’s isotherm study, maximum adsorption capability of the A. doliolum Ind1 cells was found to be 200 mg/g for Cd. This proved to be highest when compared to maximum adsorption capabilities of few other microbes reported by other researchers (Table 3) [77–79]. This finding is significant and relevant while considering the organism as metal remediator in future environmental clean-up operations.
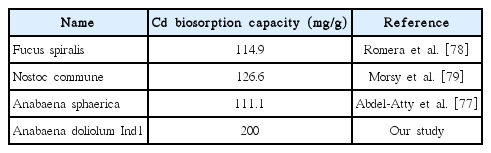
Comparison of the Cadmium Biosorption Potential of Anabaena doliolum Ind1 Cells with Few Recent Studies on Other Microbes
Cadmium at a concentration of 0.5 ppm did not visibly affect morphology and biochemistry of the organism suggesting that the organism was tolerant to Cd at 0.5 ppm concentration. Beyond 0.5 ppm, cadmium proved to be inhibitory to the organism. Most prominent change in morphology was disintegration of the thylakoid membranes and appearance of intra-thylakoid spaces. Since photosynthetic machinery is present on the thylakoid membranes, breakdown of thylakoid membranes led to loss in photosynthetic activity compounded by reduction in levels of chlorophyll a and other accessory pigments [12, 80]. Inhibition of photosynthesis affects energy pool of the cells, ultimately hampering all vital physiological processes as can be seen from the study.
5. Conclusions
Removal of cadmium from media by Anabaena doliolum Ind1 was a concentration dependent process and the primary mode of metal removal was by adherence to cell surface functional groups. The cyanobacterium showed tolerance to cadmium at 0.5 ppm concentration, however, 1.0 ppm onwards cadmium proved to be toxic to the organism. A small fraction of the removed cadmium ions was accumulated intracellularly (7–15%), but this amount was enough to bring about inhibition of various physiological processes essential for growth and survival of the organism, may be through generation of reactive oxygen species (ROS). Levels of cadmium in industrially polluted regions are often equal to or less than 0.5 ppm. This study provided evidence that the Anabaena doliolum Ind1 cells were considerably resilient to cadmium at 0.5 ppm concentration and recorded a maximum adsorption capability of 200 mg/g for Cd. These parameters make Anabaena doliolum Ind1 a likely candidate to be researched for future bio-remediation programmes.
Acknowledgement
The authors thank University Grants Commission [41-1254/2012 (SR)] and the Department of Biotechnology, Government of India (BT/216/NE/TBP/2011) for providing the necessary financial support for this research work.