Proactive Approach for Biofouling Control: Consequence of Chlorine on the Veliger Larvae of Mytilus edulis under Laboratory Condition
Article information
Abstract
Macro fouling due to blue mussels (Mytilus edulis) has affected negatively on the operation efficiency and eventual system failure of offshore structures and coastal power stations. A certain range of chlorine (0.05, 0.1, 0.3, 0.5, 0.7 and 1.0 mg/L) was applied on the mussel larvae to identify the survival rate with respect to various exposure times under laboratory condition. The ciliary movement of the larvae was used to check their survival. The 1.0 mg/L of chlorine shows to 97% of larvae mortality whereas 0.7 mg/L of chlorine shows only 16% of larvae mortality. Minimum exposure times for 100% larvae mortality ranged from 300 to 20 min for increasing concentrations of chlorine (0.05~1.0 mg/L). It was found that 1 mg/L of chlorine was 4 times more efficient than 0.7 mg/L of that, and 15 times more than 0.05 mg/L of chlorine dose. Data collected and analyzed here will help plant operators to optimize chlorine dosage and its scheduling.
1. Introduction
Fouling caused by large organisms, such as oysters, mussels, clams, and barnacles, is referred to as macrofouling. Typically, organisms are a problem only in large once-through cooling systems or low cycle cooling systems that draw cooling water directly from natural water sources (rivers, lakes, coastal seas) [1]. The problems associated with biofouling are numerous. Larvae and/or juveniles go inside the water systems of the drinking water plants, refrigeration systems of industries and power plants in the human environment, and then they settle and maturate producing macrofouling problems [2]. This decreases the efficiency of the system and may ultimately result in system failure [3].
Mussels are bivalve mollusks belonging to the family Mytilidae. The common or blue mussels, Mytilus edulis, is among the most abundant and widely distributed invertebrate species inhabiting intertidal and shallow subtidal waters in the North Atlantic [4]. It is also found in Arctic waters, as far north as Greenland and its southern distribution extends to South Carolina on the Atlantic coast. Mytilus edulis also inhibits the pacific coast as far south as California and west to Japan and Korea, as well as in European waters as far south as Mediterranean and North Africa. Range limitations seem to be governed mainly by temperature. Although mussels are able to survive freezing for prolonged periods, elevated temperatures of about 27°C (surface) limit their southern distribution [5].
The control of blue mussels can potentially be achieved by several strategies. One can be accomplished by killing veliger before they settle. Alternatively, biofouling can be prevented if blue mussels are kept from settling by the creation of environment in which settlement is postponed. Finally, another control can be exerted to kill the mussels after they have settled, by either continuous or periodic control measures. However, continuous treatment is designed to discourage any settlement in the system. Although incoming larvae may not suffer 100% mortality, the presence of the chlorine may be adequate to discourage settlement. Low level chlorine addition, if carried out over the entire breeding season, will cause any established mussels to succumb, or detach and attempt to leave the treated area. The concentration of antifoulant can be quite low, but the application must be continuous. Mussels constitute a very successful group of fouling organisms in the cooling circuits of coastal power plants [6]. Previous industry surveys have estimated that condenser biofouling, on average, accounts for a 3% loss in generating unit availability, of which 40% can be attributed to macrobiological fouling [7]. Approximately, 12% of power stations in the US use saltwater cooling circuits, and a considerable body of power plant experience has been developed in coping with salt water macrofouling. Research into more selective and environmentally benign control methods has been ongoing for several years in the public and private sectors, notably EPRI (Electric Power Research Institute) [8]. Fouling mussels can be economically controlled by proper application of the toxic chemicals [9]. For decades, chlorine has remained as a chemical agent of choice to control a wide variety of fouling organism (e.g., bacteria algae, fungi and invertebrates), since it was first used in 1947 by the Commonwealth Edison Company [10]. Its advantages include cheap and flexible availability (in gaseous, liquid and solid forms), ease of dosage and broad spectrum activity [11].
Environmental pollution abatement programs launched by various governments have led to severe restriction, being placed on the release of toxic chemicals into natural waterways [12]. In the case of chlorine, it has been shown that byproducts of chlorine include carcinogenic compounds such as trihalomethans [13]. Power stations are, therefore, required to ensure that their cooling water effluents do not contain any detectable amount of chlorine [6]. Thus, it has become imperative to generate data on the optimum level of chlorine required to control the various species for efficient biofouling control. The goal of this study, therefore, was to determine the 100% mortality of blue mussels’ larvae when exposed to different chlorine concentrations, and to assist utilities in planning chlorine regimes for control of them. It is expected that this work will help plant operators to optimize application of chlorine, so that maximal mussels control could be achieved in a cost-effective and environmentally acceptable manner.
2. Materials and Methods
2.1. Residual Chlorine Measurement and Stock Solution Preparation
Temperature, pH, dissolve oxygen and salinity of seawater were measured prior to tests and the parameters were initially set at 20°C, 7.8, 6.2 mg/L, 33.47 ppt, respectively (YSI 52; YSI Incorporated, USA). HACK pocket colorimeter TMii (China), was used for residual chlorine measurement. The color intensity (in DPD colorimeter) is proportional to the total chlorine concentration. To determine the concentration of residual chlorine (combined chlorine), we have performed free chlorine test and total chlorine test as well. The difference between free chlorine and total chlorine tests tells the residual chlorine (combined chlorine) concentration. Eight percent of NaOCl (Junsei Chemical Co. Ltd., Japan) solution was used for preparing stock solution. 12.5 mL of the NaOCl were added into a 1,000 mL volumetric flask and were made up to 1,000 mL by distilled water. This stock solution was used for all our experimental work. 2-L glass beaker was filled with adequate filtered sea water (mark up to 1000 mL). Each beaker was prepared for different residual chlorine concentrations (0.05, 0.1, 0.3, 0.5, 0.7, and 1 mg/L).
2.2. Mussel Larvae
Mytilus edulis larvae, fostered by Gyeongsangnam-do Fisheries Resources Research Institute, South Korea, has been grown up to their veliger (D stage larvae) stage. The larvae were preserved in a plastic container (10 L) and stirred at samplings for mortality test. For each test, 100 μL of larvae solution was used.
2.3. Larvae Counting
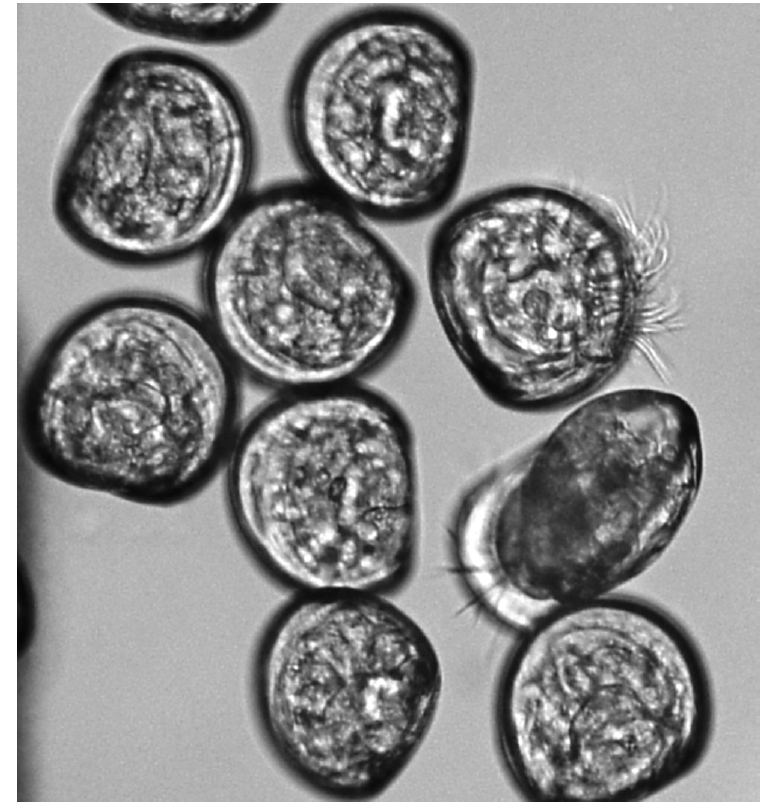
A 100 μL larvae solution was transferred into residual chlorine comprising glass beaker by micropipette. The larvae containing solution was filtered using a 40 μm pore size mesh at the end of the exposure time and then the filtered larvae were transferred to Sedgwick Rafter Counting Cell (Olympus BX40; Olympus America Inc., USA) for counting (200× magnification). The distinction between live and dead veligers was based upon ciliary movement, either inside the translucent shell or on an extended velum (Fig. 1) [10]. Triplicate counts were used for statistics.
2.4. Chlorine Chemistry in Seawater
Sodium hypochlorite (NaOCl) instantaneously forms hypochlorous acid (HOCl) if it is in water. As shown in the following chemical equation, both chlorine (Cl2) and NaOCl turn to HOCl in water.
This equilibrium is pH dependent. It is known that HOCl is a better biocide than OCl− due to its (a) electrical neutrality and (b) easy penetration through cell wall [14]. Chlorine can be present in water as free chlorine and as combined chlorine. Both forms can coexist in the same solution and can be determined together as total chlorine. Free chlorine is present as hypochlorous acid or hypochlorite ion. Combined chlorine represents a combination of chlorine-containing compounds including but not limited to monochloramine, dichloramine, nitrogen trichloride, and other chloro-derivatives. The combined chlorine oxidizes iodide (I−) to iodine (I2). The iodine and free chlorine reacts with DPD (N,N-diethyl-p-phenylenediamine) to form a red solution (Eq. (2)).
2.5. Kinetic Analysis: Determination of Larvae Death Rates
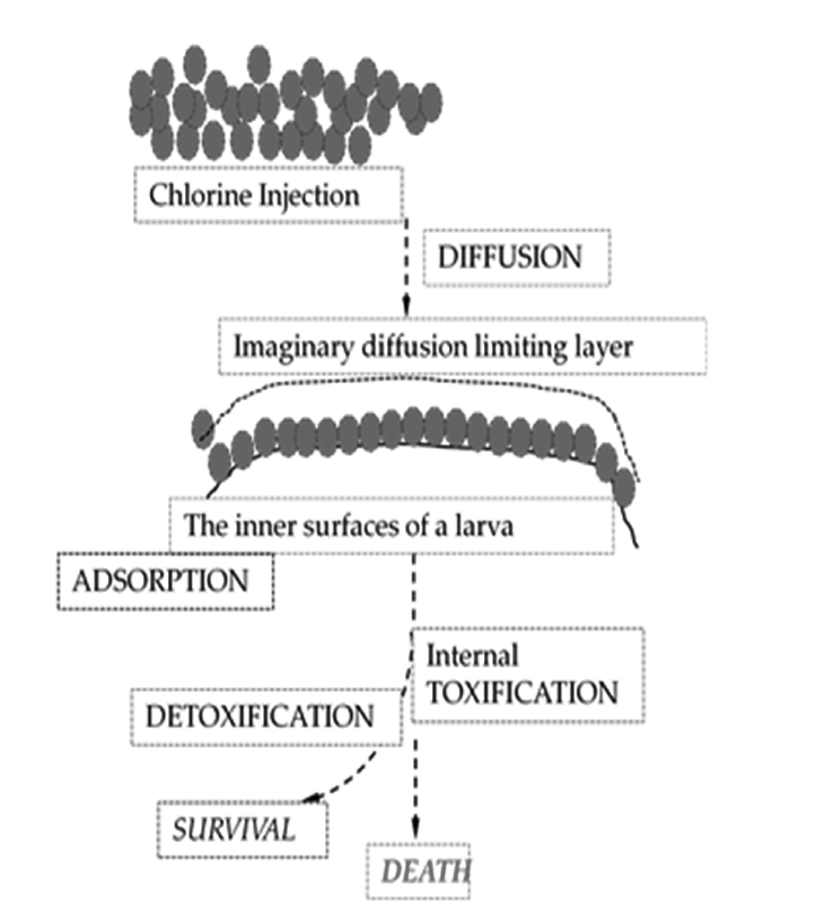
It is assumed that a multi-cellular organism may have a self-defensive mechanism against foreign toxic molecules, such as immunity and detoxification. Larvae can be dead through a complex biological toxification mechanism if chlorine gas diffuses into the shells. Before the biological chemistry, larvae should be exposed to the conditions of physical mass transfer. That is, they experience inward diffusion of the toxic substance, which will be governed by a mass action law, so called Fick’s law. Fick’s law depicts how molecular diffusion proceeds in a function of time and distance. Right after that, the toxic molecules would be adsorbed or absorbed onto the flesh surface of larvae, and toxification chemistry would activate to kill them. Now the mentioned two mechanisms may work for our estimation for larvae killing with varied doses of the toxin: one is a diffusive mass transfer limitation, being followed by molecular adsorption and the other is the biological toxification/detoxification. Fig. 2 shows a plausible picture of two main physical principles (diffusion and adsorption) and of a related biological activity (toxification/detoxification reactions) on death of larvae.
Then death of larvae can be described in a simple mathematical way. Let N be the present number of living larvae, and k be the physical law-driven death rate coefficient, a function of toxin dose and contact time. On the other hand, let a toxin molecule is instantly transformed into an activated form, and some detox molecules are being internally secreted to combine with toxin molecules, thus eventually retard the death rate. We, therefore, may introduce a recovery rate coefficient, k′, are influenced by some biochemical reactions (representing detoxification). Then, we have
The toxin molecules introduced into the cell wall occupy the flesh surface of the larvae in a mono-layered manner. While the surface is being covered by the molecules, the larvae get killed. This approach is called ‘Langmuir type.’ Also, if toxin molecules near the flesh surface induce defending agents or inhibitors, k′ could be simply expressed as −k′ C since more invaders may tend to attract more defenders. Reflecting this approach on Eq. (3), we get
As mentioned earlier, the toxin concentration, C can be governed by Fick’s law as follows:
In Eq. (5) D denotes the diffusion coefficient of the toxin in water, and the toxin concentration at the flesh surface needs to be calculated. With appropriate initial and boundary conditions we have
Finally, Eq. (4) reduces to
Since C is also a function of time Eq. (6) can be integrated over t=0 to t=t to result in
3. Results and Discussion
Continuous chlorination toxicity test were conducted on Mytilus edulis larvae. The effectiveness of disinfection usually depends on the rate at which disinfection process occurs. Many parameters have been identified as having a significant impact on the rate of disinfection, including: disinfection type, disinfection concentration, organism type (including strain and metabolic state), organism density, contact time, and temperature [10]. Contact time plays an important role in toxicity affection and after all mortality. Larvae mortality was observed at times of 10, 20, 30, 60, 90, 120, 150, 180, 210, 240, 270, 300 min for 0.05 mg/L of residual chlorine. Chlorine toxicity affects to larvae and breaks intrinsic resistance in a certain period of time; after that larvae will expire. For 0.05 mg/L residual chlorine it took 300 min for all larvae to be killed. Larvae mortality has increased with residual chlorine concentration as well as contact time. At 10 min larvae mortality has shown 2.59%, 8.29%, 11.25%, 16%, and 97.57% for 0.1, 0.3, 0.5, 0.7, and 1 mg/L of chlorination, respectively. Generally larvae killing are supposed to happen via actions of sodium hypochlorite species (HOCl and OCl−). Bacterial cell wall is confronted by injury (lesion) thru biocide. A conventional theory recognizes progressive injury arising from initial lesions and if the inimical (biocide) challenge is maintained for sufficient duration or the applied concentration is sufficiently high and then initial bacteriostatic damage may develop to cause eventual cell death [15]. As suggested in past work, lower dosage of chlorine needs more duration time for 100% mortality (Fig. 3). For instance, 0.1 mg/L of chlorine dose took 240 min to kill all larvae in tests. Meanwhile 1.0 mg/L dose took only 20 min, which meant 12 times faster. Note that the highest dose of chlorination was found to be highly more effective than 0.7 mg/L, though the concentration difference is small enough. Summarizing the results, it seems that diffusion of the toxin into the cell wall considerably controls the mortality of larvae even if the early mentioned biocidal mechanism is critical in this work. On the other hand, the oxidizing effects of chlorine as a biofouling agent have been well documented. However, the mechanism is still not well understood. The effects of chlorine seem to concentrate on certain tissues in marine organisms, but further research is required to fully understand the mode of action [3].
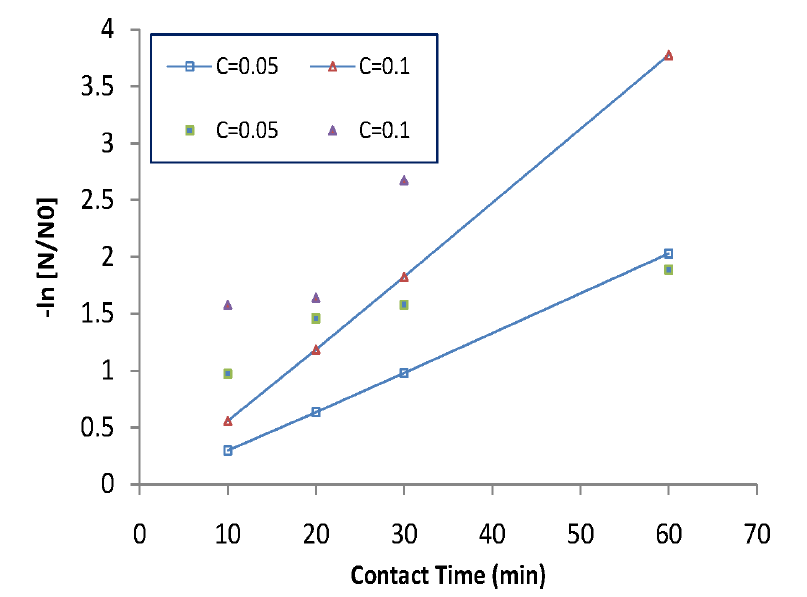
The current theory postulates that oxidation occurs following diffusion through the cell wall [14] (Fig. 2). And the toxin molecules are absorbed or adsorbed onto or through the cell wall. Then a certain ‘biocidal pathways’ operates in the inner phase of the cells eventually leading to cell death. More detailed description can be found in section 2.5. Based on diffusion-oriented larvae death we presented a kinetic mortality data and analyses in Fig. 4 and 5. Eq. (6) can be numerically solved along with Eq. (4) to compare with a set of experimental data. Fig. 4 is a plot of experimental data for extinguished larvae according to normal sterilization kinetics (e.g. bacterial sterilization). In Fig. 4 we may see that initial death rates are higher than what would be expected, which meant a sort of initial shock for a few number of the defenseless larvae. Counting this overkilling, the curves might fit to the normal sterilization kinetics (all regression lines would pass through zero point if data get drawn down). Also Fig. 5 shows, in overall, a fair agreement between real data and the calculated fitting curves for low doses of toxin except for the short-term extinction of larvae, even if number of real data is not enough. The quick death might owe underestimated convective or agitating effect of chlorine gas right after injection. This gaseous convection should have been included in our kinetics, which suggests further research for the short-term mass action law is needed. Besides, R2, the coefficient of determination for figure 5 plot is about 0.78, which is relatively good in regression analysis.

Transformed experimental data according to normal sterilization kinetics. The log term versus time should be strictly linear.
It is expected that through this work problems such as large fluctuations in veliger number concentrations, high natural mortality and difficulties in how to access mortality arise. Though effects of chlorine on veliger stage of the blue mussels have not been widely investigated, some data against M. edulis and Drassina polymorpha veliger are available (see Table 1).
4. Conclusions
This study has revealed that larvae killing capability of chlorine are excellent as we know, but it is erratic against M. edulis larvae. Low concentrations (0.05 mg/L, 0.1 mg/L, 0.3 mg/L) of chlorine have taken long time and it is not congenial for controlling macro fouling, especially caused by larvae. Long exposure is a big challenge for applying chlorination in field level due to its effervescence properties, although put on by way of continuous process. But 0.5 mg/L and 0.7 mg/L chlorine concentrations have shown reasonable time that could help for planning of chlorine regime. One mg/L chlorine could be excellent for controlling macro fouling via unsettling larvae, but this residual chlorine concentration might be harmful for environment. Thus effective concentration of chlorine might be helpful for controlling larvae as well as for managing the macro fouling problem in cooling water system. The proposed diffusion based poisoning steps, expressed in a mathematical way, can predict the experimental data or death rates of larvae fairly with the modified sterilization kinetics.
Acknowledgment
The authors are grateful to POSCO E&C for research funding. Also thanks to Gyeongsangnam-do Fisheries Resources Research Institute for providing their lab facility and assistance in experiment work. This research was supported also by BK21 plus program.


