Colonization of Microbial Biofilms in Pipeline of Water Reuse
Article information
Abstract
Aim of this study was to investigate biofilms attached in pipeline of water reuse from the MBR system treating sewage without chlorination in correlation to the outflow water quality. Two general pipe materials: polyvinyl chloride (PVC) and polyethylene (PE) were employed in the experiment. The peak growths were found at week 4 in both pipes. The maximum biofilms in PE pipe was 33 mgVSS/cm2 with the growth rate of 4.75 mgVSS/cm2-d which was significant higher than that of PVC pipe. Biofilms examined by PCR-DGGE technique revealed five bacterial species in PE biofilms namely Sinorhizobium medicae WSM419, Sinorhizobium fredii NGR234, Geobacter sp. M18, Parachlamydia acanthamoebae UV-7, and Mycobacterium chubuense NBB4. The VSS concentrations in outflow had directly correlated to the biofilm attachment and detachment. High COD concentrations of outflow appeared during biofilm detaching phase. In summary, water quality of reuse water corresponded to the biofilms attachment and detachment in the pipeline.
1. Introduction
Biofilms are typically considered a primary source of micro-organisms in water distribution systems in particularly the old pipes [1]. There are several factors which can influence the formation of biofilms such as nutrients, pipe materials, disinfectants, indigenous microorganisms in the water, and the hydraulic regime [2]. Biofilms can predominate inside pipe because the attached cells have certain advantages over planktonic cells such as the ability to metabolize recalcitrant organic compounds [3, 4] and develop resistance to chlorine and other biocides [4, 5]. In addition to biofilm growth, formation of nitrogenous compounds inside pipeline system, growth of microorganisms associated pipe corrosion can deteriorate water quality and corrode pipeline respectively [6].
Recently, water demand is increasing dramatically due to increasing population and expanding economic in the world even in the tropical regions with common high precipitation. For example in Thailand, water withdrawal for use in the country is primarily in agriculture (85%), domestic sector (7%) and the rest by industry. It is predicted that water demand has increased from 57,452 million cubic meters in 2008 to 65,452 million cubic meters in 2016 while the recent capacity for water storage for summer use is only 74,000 million cubic meters for this country [7]. Water reuse becomes an alternative option in many countries in order to overcome water shortage in the near future. Actually the degree of water treatment depends on raw water quality and purposes of use. One of the concern properties of water quality is microbial contamination which causes an increase health risk to the people. More considered to water supply system, microbial re-growth in particular the persistence pathogens in water reuse distribution must be controlled. The treated wastewater often contains enteric microorganisms especially from the biological treatment process without chlorination. However, rare reports on distribution system in relation to water reuse have been investigated especially for microbial diversity in pipeline. In this study, the effluent without chlorination from the pilot scale of membrane bioreactor treating sewage from Bangkok, Thailand has been considered to be reused for public green area in the city. Therefore, the distribution system for this type of water has been simulated to investigate development of biofilms inside pipeline of reused domestic wastewater in associate with water quality. Better understanding of biofilm formation is useful for re-growth controlling in distribution system. This study focused on effect of pipe types on microbial growth and species in biofilms using a real-time PCR-DGGE technique. Besides, water quality of outflow effected by biofilm formation in the experiment unit has been also evaluated.
2. Materials and Methods
2.1. Experimental Set-up
Fig. 1 shows a schematic diagram of experimental water distribution unit in this study. The effluent from the pilot-scale membrane bioreactor (MBR) treating Bangkok Metropolitan Administration’s (BMA) sewage had been used as a continual feed-water for 7 weeks. The 4 membrane modules (Hollow-fiber membrane PVDF) were the submerge type (hollow fibers, 0.4 μm pore size, total area of 36 m2) with a normal operation mode maintaining constant flux of 17 LMH or 0.4 m/d or constant effluent flow rate at 610 L/hr. The treated wastewater had been stored in 1 m3 storage tank and pumped into the distribution unit with a flow rate of 360 L/hr equivalent to a velocity of 0.8 m/s (full pipe flow measured by a liquid flow meter) without any chemical disinfection. This running flow is a similar rate as a typical application in the water supply system. Two types of pipe materials with similar in size (0.03 m length and a diameter of 0.018 m) were employed: polyvinyl chloride (PVC) and polyethylene (PE). The 0.03 m of each test pipe were inserted in the PVC pipe supporter of the distribution unit. Then they were connected by PVC joints. This arrangement is one test set of water distribution unit as shown in Fig. 1a. There were a total of 12 test set arranged in series (Fig 1b). One pipe of each test pipes was removed out from the distribution unit on weekly basis for further examination of biofilms. When the test pipes were removed, the new pipes of were replaced. The inflow and outflow of water distribution unit and the biofilms were analyzed for chemical and biological properties in weekly basis throughout 7 weeks of experimental period.
The water distribution unit (a) schematic ‘diagram; (b) photograph.
2.2. Analyses of Water Samples
The sewage, water samples from effluent of the pilot-scale MBR (storage tank) and the outflows of pipeline were analyzed for basic chemical parameters: BOD, COD, SS, VSS, TKN, NH3-N, NO2-N, NO3-N, PO43−, pH, DO [8]. Beside, a 40 mL of sample was centrifuged at 8000 rpm, 4°C, 5 minutes by aseptic technique for biological analysis: plate count agar, total coliforms [8] and molecular examination [9, 10]. It was noted that the treated water kept stagnantly in the storage tank was examined for total organisms with interval time of 80 hours in order to check over possibility of re-growing of microorganisms prior to run the distribution unit.
2.3. Biofilm Samples
The outsides of PVC and PE test pipes were cleaned by 70% ethanol. Then, the test pipes were submerged in the 20 ml of sterile 0.85% NaCl for microbial suspension. Then, the biofilms were eluted from the test pipes using a vortex mixer for 5 minutes followed by ultra-sonication in sonication bath for 5 minutes. Thereafter, the suspension was centrifuged at 8000 rpm, 5 minutes. Then, the biomass precipitate was aseptically collected for molecular analysis. In addition to the biological analysis, the microbial suspension was analyzed for some chemical properties i.e. SS, VSS and COD. The biomass were calculated as mg solids/cm2 as shown in eq. (1).
Inside surface area of test pipe (cm2)
2.4. Molecular Analysis
The microbial DNA of the biofilm was extracted using the soil DNA isolation kit (FavorPrep™). The 16S rRNA was amplified using universal primer (U968F-GC and 1401R) [9] via the real time PCR, Light Cycler® Nano, Roche. The PCR products were analyzed by DGGE technique (Bio Rad DCode™). The DNA was eluted and purified using HiYield® Gel/PCR DNA Fragments Extraction kit (RBC Bioscience). Finally, the DNA products were sequenced by a DNA sequence analyzer (AITbiotechPte Ltd, Singapore). The DNA sequences obtained were compared to 16S rRNA gene sequences in the National Center for Biotechnology Information (NCBI, Thailand) database using the BLASTn search option. The concentration of DNA product was calculated using the equation (2) [10]. It is noted that DNA length of primer 988GC-F and 1401R is 500 bp.
DNA length (bp)×660 (g/mol/bp)
3. Results and Discussions
3.1. Water Quality
The average physical and the chemical characteristics of sewage of Bangkok and the storage water of MBR effluent and outflow of pipeline during 7 weeks of experiment are shown in Table 1. It is seen that Bangkok’s sewage contains less biodegradable organic matters (32 mgBOD5/L) including nitrogenous compounds as compared to the common domestic wastewaters (100–500 mgBOD5/L) [11]. This is because there is high biodegradation commonly found in the sewage collection system in warm climate [12]. Moreover, Bangkok locates in lowland closed to Chao-Praya River which the water saturated soils are always present in most Bangkok’s area, therefore high infiltration in sewer system is highly possible. The main impact of sewer infiltration is to dilute waste-water [13]. In addition to the infiltration, Bangkok is in tropical area which heavy rainfalls are common, therefore stormwater flows is other cause of dilute sewage [13] because the sewer system in Bangkok is the combined type. Apart from this occurrence, stormwater flows can carry roadside particles into the sewer system which makes high total solids content in this sewage (1,330 mg/L). After treatment by MBR, most of the controlled parameters by national standard such as BOD, TN, and suspended solids were acceptable. More investigation on water quality of the storage water were performed. It was found that most of parameters were slightly reduced exception for the bacterial counts. Bacteria had been re-growing in stagnant water (Fig. 2), however none of coliform bacteria was found. The peak growth appeared at 40 hours and decreased afterward (Fig. 2). This evidence correlated to the decrease in organic matters and nutrients in this water. It suggests that there were assimilation of the remaining compounds in the treated water by the indigenous microorganisms. When the water was fed into the distribution unit, it was found that phosphorus, nitrogenous compounds and degradable organic matters (BOD) in outflow had decreased further as compared to the storage water. Similarly to the storage tank, it indicates assimilation of those compounds by microorganisms in distribution pipe. As the results, it is obviously seen that amount of microorganisms as total plate count (TPC) in outflow increased significantly (389 CFU/ml) as compared to the inflow (8.8 CFU/ml). Corresponding to SS, VSS and COD concentrations, these parameters in outflow also increased in concentrations remarkably from 5 mgSS/L to 13 mgSS/L, 3.7 mgVSS/L to 10.3 mgVSS/L and 56 mgCOD/L to 72 mgCOD/L, respectively (Table 1). From the results, they suggest that the treated water from MBR system treating domestic wastewater was lower in quality for COD, SS and VSS and total organisms after supplied as the reuse water into the distribution system.
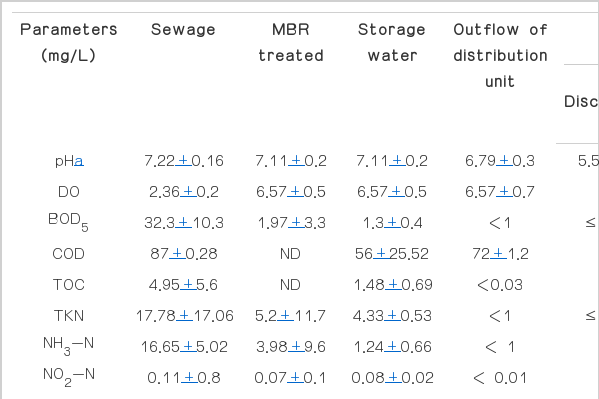
Average of Water Quality
Changes of culturable bacteria of storage water of MBR effluent with time.
Consideration changes of these parameters with time as shown in Fig. 3, the biomass as VSS concentrations of outflow gradually increased with time which were different from the inflow after week 3 of operational time. This indicates transformation of organic matters (both soluble and solid forms) in inflow into the biosolids in outflow throughout 7 weeks of water distribution period. The first 4 weeks, the VSS represented as the suspended microorganisms, whereas the latter 4 weeks, they were the combination of the suspended microorganisms and the detaching biofilms. The biofilm formation/detachment will be discussed in the next section. As shown in Fig. 3b, organic matters as COD in the inflow and outflow had similar concentrations from the beginning until week 4. This implies slight changes of total organic matters between inflow and outflow during the first four weeks. However, after week 4 the outflow COD concentrations gradually increased as compared to the inflow during week 5 and 6. This was the results from biofilm detaching from the pipes (Fig. 4a) which is more discussion in section 3.2. Finally, the outflow showed a sharp peak of organic matters as COD at week 7 which correlated to the highest VSS concentration at the same time of the experimental period (Fig. 3a). More discussions on this evidence was presented in following sections.

Changes mass concentrations of the inflow and outflow of distribution unit with time (a) VSS, (b) COD.

Biofilm mass in two types of pipes with operational time (a) VSS/SS, (b) COD.
3.2. Development of Biofilms in Pipeline
Fig. 4 shows the biofilm mass in two types of pipes with operational time. Biofilm growth as VSS concentrations tended to increase rapidly especially for PE test pipe. It maximized at week 4 and then reduced gradually thereafter. This indicates that the attaching phase of biofilms was in ranges of week 1 to week 4 while the detaching phase was during week 4 to week 7 (Fig. 4a). The reduction of VSS concentrations in test pipes during detaching phase was well correlated to the increase in that in the outflow (Fig. 3a). It indicates that the biofilm attachment/detachment influence to outflow quality. During attachment, the peak of biofilms in PE pipe was 33 mgVSS/cm2 with a growth rate of 4.75 mgVSS/cm2.d, which was significant higher than that of PVC pipe giving 6 mgVSS/cm2 and a growth rate of 1.01 mgVSS/cm2.d. This may be because PVC pipe commonly coated with antimicrobial agent in manufacturing process [14] while none of that for PE pipe. Consideration of the influence of the flow velocity, because the velocity fluctuation in water distribution is typical in a network, therefore biofilm density commonly decreased with decreasing flow velocity [10]. In case in this study, the fed reuse water was continual 24 hours under laminar flow (full pipe flow; RE = 114.55) of which the full pipe flow or a velocity of 0.8 m/s was used. Therefore this simulation of water distribution was represented the potential of maximum biofilm formation in the pipeline system. The amount of biofilms implied the highest growth rate of biomass than the real situation for both material pipes.
Difference from organic matters, COD contents of biofilms in PE and PVC pipes began to increase obviously after week 4 and week 6 respectively by giving the highest contents of 0.95 and 0.37 mgCOD/cm2 respectively at a final week of experimental period (Fig. 4b). Correlation to the VSS concentrations, it indicates that the biofilms contained high soluble organic matters during detaching phase. The soluble organic matters normally released from the dead cells by autolysis mechanism of microorganisms [15]. Higher soluble organic matters had been produced in the PE’s biofilms than in PVC’s biofilms during the final week of operation according to more growth in the attaching phase. It is concluded that PE pipe gave higher biofilm production than the PVC pipe for water reuse distribution system. As compared to the clean water distribution system, it was reported that PE pipe in drinking water with the concentration of free chlorine of 0.06 mg/L, the microbial concentration could be detected firstly at day 37 and maximum at day 111 of the experimental period [16]. In case of PVC pipe, similar lower biofilms growth rate in PVC pipe were found than those in PE pipe in clean water distribution [17].
From the results, they indicate that the microorganisms could be fast growing in the water reuse pipeline due to remaining supplement compounds in the treated water for microbial growth. Besides, this reuse water had been supplied into distribution system without any chemical disinfection in order to supply for agriculture purpose. Although chlorination is commonly used for disinfecting tap water are known in possible reaction with natural organic matters and ammonia in the water. However, it is carefully considered in chlorination of water reuse to control pipeline biofilms due to high possible formation of carcinogenic compounds such as trialo-methanes (THMs)/trichloramine. From the results, alternative option such as flushing out the biofilms in periodically from the distribution system to control biofilm growth is recommended to control water quality. Flushing of distribution line is an important method to control microbial contamination in reclaimed water systems [18]. In this study, the pipe network was not flushed prior to be used therefore, the biofilm growth in pipeline may be from indigenous microorganism contamination of pipeline. In addition, the velocity of the water flowing through pipe system can impact on the growth of biofilm detachment to the bulk water. Therefore, a full pipe flow velocity of 0.8 m/s of the feed flow could enhance high possibility in detachment of less dense biofilms.
3.3. Identification of Microorganisms
Identification of microorganisms by molecular technique suggests that 5 species of bacteria could grow in PE pipe in different periods and one species of bacteria had existed in outflow (Fig. 5). It was noted that the PCR products of inflow and PVC test pipe could not be detected in this study. It might be the very low concentrations of microorganisms in those samples. From Fig. 5, band 1 and 4 were nitrogen fixing bacteria: Sinorhizobium medicae WSM419 (88% similarity) and Sinorhizobium fredii NGR234 (90% similarity), respectively. Band 2, 3 and 5 were Geobacter sp. M18 (88% similarity), Parachlamydia acanthamoebae UV-7 (93% similarity) and Mycobacterium chubuense NBB4 (98% similarity), respectively. The characterization of microorganisms of biofilms in PE Pipe is summarized in Table 2 [19]. The microbial communises in all samples consisted mostly of gram-negative bacteria. Only P. acanthamoebae is reported as pathogen in lower respiratory tract causing pneumonia [20].
DGGE patterns of biofilms using polyacrylamide gel 8% at 30–70% denaturing gradient. (a) inflow, (b) PVC, (c) PE and (d) outflow.

Consideration of water quality changes with time as shown in Fig. 3a, the SS/VSS in outflow water had tended to increase with time and highest at week 7. It was seen that some micro-organisms (Band 1 and Band 5) had been appeared in the outflow at week 7 correlated to the outflow of SS and VSS concentrations as discussed in previous section. Similarly to the COD, the highest COD increased sharply at week 7, in which correlated to appearance of band 1 in Fig. 5d. The results suggest that water quality of outflow was directly affected by the microorganism detachment in the pipeline.
Calculation the concentrations of 16rRNA genes of microorganisms in PE pipe with time are shown in Figure 6a. The amount of S. medicae and Geobacter sp. at initial were equally of 3.04 ×10⁹ copies/g biofilms. The S. medicae increased maximally at week 4 (7.95×10⁹ copies/g biofilms) and minimized to 1.01x10⁹ copies/g biofilmsat week 7. While the Geobacter sp. had sharply decreased at week 4 and remained consistency in the concentration of 3.72×10⁹ copies/g biofilms throughout the experimental period. P. acanthamoebae firstly attached at week 4 (9.35×10⁸ copies/g biofilms) and increased thereafter, and had given a constant of 3.72×10 9copies/g biofilms during weeks 5 to 7. The S. fredii and M.chubuense firstly appeared at week 5 and tended to increase with time with the highest DNA copies of 2.61×10⁹ copies/g biofilms and 1.87×10⁹ copies/g biofilms, respectively.

Changes of microorganisms in PE biofilms with time (a) DNA copies (b) population percentages.
The relative population of microorganisms in PE biofilms is shown in Figure 6b. The results of identified bacterial DGGE band in PE pipe at week 2–7 showed that S. medicae and Geobacter sp. were the major microbes during week 2 to week 4, thereafter S. medicae had decreased remarkably with time, followed by the growth of P. acanthamoebae, M. chubuense and S. fredii in slight different proportion at week 7 (20–25%). In summary, the results suggest that the S.medicae was the species with fast attaching and fast detaching as compared to the others in this study, which directly influenced to the water quality of outflow.
4. Conclusions
Microbial re-growth as biofilms could be formed in pipeline of distribution system of water reuse of sewage treated by MBR. The peak of growth was found at week 4 of which the PE pipe gave more biofilms than that of PVC pipe. S. medicae was the species with fast attaching and fast detaching as compared to the others, which directly influenced to the water quality of outflow. One of five species within biofilms, P. acanthamoebae was reported as the pathogen in lower respiratory tract. The biofilms detachment lowered the outflow quality.
Acknowledgement
This study was supported by AUN/SEED-Net under cooperative research with industry program.