Assessment of Water Quality using Multivariate Statistical Techniques: A Case Study of the Nakdong River Basin, Korea
Article information
Abstract
This study estimated spatial and seasonal variation of water quality to understand characteristics of Nakdong river basin, Korea. All together 11 parameters (discharge, water temperature, dissolved oxygen, 5-day biochemical oxygen demand, chemical oxygen demand, pH, suspended solids, electrical conductivity, total nitrogen, total phosphorus, and total organic carbon) at 22 different sites for the period of 2003–2011 were analyzed using multivariate statistical techniques (cluster analysis, principal component analysis and factor analysis). Hierarchical cluster analysis grouped whole river basin into three zones, i.e., relatively less polluted (LP), medium polluted (MP) and highly polluted (HP) based on similarity of water quality characteristics. The results of factor analysis/principal component analysis explained up to 83.0%, 81.7% and 82.7% of total variance in water quality data of LP, MP, and HP zones, respectively. The rotated components of PCA obtained from factor analysis indicate that the parameters responsible for water quality variations were mainly related to discharge and total pollution loads (non-point pollution source) in LP, MP and HP areas; organic and nutrient pollution in LP and HP zones; and temperature, DO and TN in LP zone. This study demonstrates the usefulness of multivariate statistical techniques for analysis and interpretation of multi-parameter, multi-location and multi-year data sets.
1. Introduction
The Nakdong river basin, which is one of the four major river systems in Korea, serves as an important water resource for the south eastern area. During the last several decades, the combination of rapid population growth coupled with industrial and urban development had resulted in a serious deterioration of water quality in downstream area. Major pollution sources include domestic sewage, industrial wastewater, livestock discharge, and urban and agricultural runoff.
The application of different multivariate statistical techniques, such as cluster analysis (CA), principal component analysis (PCA), and factor analysis (FA) helps in the interpretation of complex data matrices to better understand the water quality and ecological status of the studied systems, allows the identification of possible factors/sources that influence water systems and offers a valuable tool for reliable management of water resources as well as rapid solution to pollution problems [1–6]. Multivariate statistical techniques have been applied to characterize and evaluate surface and freshwater quality, and it is useful in verifying temporal and spatial variations caused by natural and anthropogenic factors linked to seasonality [7, 8]. In the present study, a large data matrix, obtained during an 9 years (2003–2011) monitoring program, is subjected to different multivariate statistical techniques to extract information about the similarities or dissimilarities between sampling sites, identification of water quality variables responsible for spatial and temporal variations in river water quality, the hidden factors explaining the structure of the database, and the influence of possible sources (natural and anthropogenic) on the water quality parameters of the Nakdong river basin.
2. Materials and Methods
2.1. Study Area
Total watershed area of the basin is 23,384 km2 (Fig. 1). The 525 km long river originates at the junction of Cheolamcheon and Hwangjicheon streams in Dongjeom-dong, Taebaek city, Gangwon province and then flows from the Taebaek Mountains to the south sea of Korea. The width of the river ranges from only a few meters in its upper reaches, to several hundred meters towards its estuary. Major tributaries include the Yeong, Geumho, and Nam rivers. Together with its tributaries, the Nakdong drains most of north Gyeongsang and south Gyeongsang provinces, along with small portions of north Jeolla, south Jeolla, and Gangwon.

Location of the study area, river networks and monitoring stations.
2.2. Monitored Parameters and Analytical Methods
The data sets comprises of 11 water quality parameters at 22 monitoring stations observed monthly during 9 years (2003–2011). The parameters include discharge, water temperature, dissolved oxygen, 5-day biochemical oxygen demand, chemical oxygen demand, pH, suspended solids, electrical conductivity, total nitrogen, total phosphorus, and total organic carbon. Basic statistics of all the parameters at all the 22 stations are summarized in Table 1.
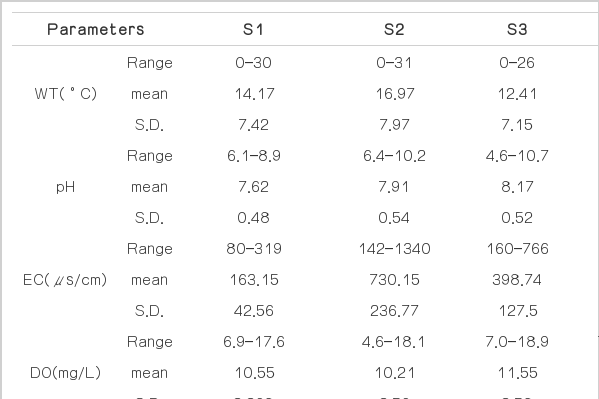
Range, Mean and Standard Deviation (S.D.) of Water Quality Parameters at 22 Stations in the Nakdong River Basin during 2003–2011
2.3. Data Treatment and Multivariate Statistical Methods
PCA, FA and CA were applied to the observed data standardized through z-scale transformation to avoid misclassifications arising from the different orders of magnitude of both numerical values and variance of the parameters analyzed as discussed in Simeonov et al.[6], Liu et al.[9] and others. All mathematical and statistical computations were made using Microsoft Office Excel 2010 and SPSS 18.
Hierarchical agglomerative CA was performed on the normalized data set to assemble objects based on the similarity characteristics they possess. Ward’s method with squared Euclidean distances was used as a measure of similarity. The Ward’s method uses an analysis of variance approach to evaluate the distances between clusters in an attempt to minimize the sum of squares (SS) of any two clusters that can be formed at each step [4, 6, 8]. Following CA, PCA was applied on normalized variables to translate the original variables into new, uncorrelated variables (axes), called the principal components (PCs), which are linear combinations of the original variables [10]. A few PCs that can explain most of the variances in the data were selected based on Eigen value criteria (Eigen value > 1). Factors were generated by varimax rotation (raw) of the PCs [11]. And the factors were analyzed further using FA.
3. Results and Discussion
3.1. Water Quality Variations
The industrial and urban development and corresponding deterioration in river water quality has affected drinking water supplies to the Busan metropolitan area, the second largest city in Korea, located downstream of the Nakdong river. Observed profiles of dissolved oxygen (DO), 5-day biochemical oxygen demand (BOD5), chemical oxygen demand (COD_Mn), suspended solid (SS), total nitrogen (TN), and total phosphorus (TP) in the main stream and major tributaries are shown Fig. 2 (9 years average). As shown the Fig. 2, water qualities are generally good in the upstream area but become seriously deteriorated in middle stream, especially after the confluence of the Keumho river, where the Daegu metropolitan area, the third largest city, is located.

Observed profiles of selected water quality parameters in the nakdong river and its major tributaries. (■Main stream, ▲Tributary)
Construction and upgrading of several municipal wastewater facilities and the enforcement of effluent requirements at some of the industrial sources has resulted in noticeable improvements in the water quality of some of the tributaries. In spite of that, the downstream water quality remains seriously polluted as before.
3.2. Cluster Analysis
Hierarchical cluster analysis was used to detect the similarity groups between the sampling sites. It yielded a dendrogram (Fig. 3), 22 sampling sites and 11 variables of the basin into three statistically significant clusters in meteorology seasons (March–May (spring), June–August (summer), September–November (autumn), December–February (winter)). Based on water quality in the three zones, they were named as relatively less polluted (LP), medium polluted (MP) and highly polluted (HP). Cluster 1 (LP zone) consisted of the stations S1, S3, S4, S5, S6, S7, S8, S17, S18, S19, S20, S21, and S22 for winter, spring, and summer; and the stations S1, S5, S7, S8, S18, S19, S21, and S22 for autumn.
Dendrogram showing clustering of sampling sites.
The LP zone grouped mostly the stations in up-stream and tributaries. Cluster 2 (MP zone) comprised of the stations S9, S10, S11, S12, S13, S14, and S15 for winter and spring; the stations S9, S10, S11, S12, S13, and S14 for summer; and the stations S4, S9, S10, S11, S12, S13, S14, and S20 for autumn. The MP zone grouped mostly the stations in middle stream. Finally, cluster 3 (HP zone) comprised of the stations S2 and S16 for winter and spring; the stations S2, S15, and S16 for summer; and the stations for S2, S3, S15, S16, and S17 for autumn. After confluence of S2 deteriorates water quality of S3 in autumn. The HP zone grouped highly populated region and concentrated industrial factories in the river basin. The results exhibit that the CA is useful in presenting accredited classification of surface waters in the whole river basin.
3.3. Factor Analysis/Principal Component Analysis
Principal component analysis/factor analysis was performed on the normalized data sets (18 variables) separately for the three different regions (viz., LP, MP and HP) delineated by CA to compare the compositional pattern between analyzed water samples and identify the factors influencing each one (Fig. 2). PCA of the data sets yielded four PCs for the LP, MP and HP sites, explaining 83.0, 81.7 and 82.7% of the total variance, respectively. The PCs with Eigen value of 1.0 or greater were considered significant, and therefore, selected. FA, performed on the PCs, resulted equal numbers of varifactors (VFs) for the three zones. Corresponding VFs, variable loadings and explained variance are presented in Table 2. Liu et al.[9] classified the factor loadings as “strong”, “moderate” and “weak”, corresponding to absolute loading values of >0.75, 0.75-0.50 and 0.50-0.30, respectively. The first varifactor (VF1) for the three pollution zones (viz. LP, MP and HP) explained 38.0, 39.7 and 41.1% of total variance, respectively. This factor has strong positive correlation with discharge and total pollution loads. This factor explains the erosion from upland areas during rainfall events and the positive correlation with pollutant loads indicates the loading of partially decayed organic matters from non-point sources. The second varifactor (VF2), explaining 20.3, 18.3 and 14.8% of the total variance, for LP, MP and HP, respectively, shows strong positive correlation with BOD, TP and TOC in LP zone, with Temperature, DO and TN in MP zone, and with TN, TP and TOC in HP zone. The VF2 explains pollution pattern of the non-point source pollution. The inverse relationship between BOD, TP and TOC, VF3 (LP, MP, HP) can be explaining 17.2, 15.6 and 14.1% of the total variance, have strong positive loadings for organic material and nutrient.
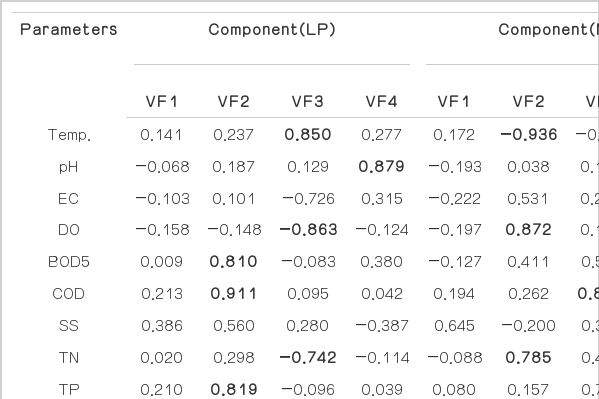
Results of PCA and FA for LP, MP, HP Zones
4. Conclusions
Hierarchical cluster analysis grouped 22 sampling sites into three clusters of similar water quality characteristics. The clusters are identified as relatively LP, MP and highly HP. Based on obtained information, it is possible to design optimal sampling strategies, which could reduce the number of sampling stations and associated costs. The results of factor analysis/principal component analysis helped to identify four principle components and VFs that explained up to 83.0%, 81.7% and 82.7% of total variance in LP, MP, and HP zones, respectively. Although the factor analysis/ principle component analysis did not result in a significant data reduction, it helped extract and identify the factors/sources responsible for variations in river water quality in the three zones with different levels of pollution (viz., LP, MP and HP). VFs obtained from factor analysis indicated that the parameters responsible for water quality variations are mainly related to discharge and total loads (non-point pollution source) in LP, MP and HP zones; organic and nutrient pollution in LP and HP zones; Temperature, DO and TN in LP zone.