Effect of operating parameters on dye wastewater treatment using Prosopis cineraria and kinetic modeling
Article information

Abstract
Textile dye effluent treatment was investigated using a novel biosorbent synthesized from Prosopis cineraria. The influence of operating variables, namely initial COD of the effluent (352–1,303 mg/L) and adsorbent dosage (0.25–4.0 g/L) on the removal efficiency was studied. The results of the biosorption experiments indicated that the equilibrium COD removal efficiency attained was 68% and COD uptake achieved was 90.52 mg/g at an optimal sorbent dose (2.0 g/L). Pseudo second order model fitted well to the experimental data and the rate constant was estimated as 0.098 x 10⁻⁵ g /(mg min). Chemisorption was identified as the removal mechanism involved. Power function model represented the kinetic data in selected range of COD and kinetic constants were estimated. XRF analysis of the biosorbent confirmed the presence of potassium oxide and calcium oxide as the two major components.
1. Introduction
Due to rapid growth in human population and emergence of modern living, the number and production capacities of textile industries have increased globally. Textile industries involve the use of colorants, namely dyes, to impart color to the fabric. Dyes are natural and synthetic in origin and can be classified based on their chemical structure and mode of application. Due to process inefficiency, it is reported that 10–15% of the dyes are lost into the waste streams [1]. Traditional textile industries approximately 100 L of process water for every kilogram of textile processed [2]. The release of dyes into the water streams causes ecological imbalance by affecting the penetration of sunlight, reducing the dissolved oxygen, causing eutrophication, inducing anaerobic digestion and entering the food chain through aquatic organisms. Dyes tend to accumulate in solid medium due to their resistance to biodegradation which is related to their synthetic origin and complex molecular structure. Azo dyes represent the common group of compounds widely employed in textile industry due to their better coloring properties [3]. With approximately 80% of the dyeing operations using azo dyes, the presence of azo dyes in untreated effluent is inevitable. Azo dyes are reported to be carcinogenic and mutagenic in nature [4]. Many dyes are derivatives of benzidine and napthoic acid and lead to generation of carcinogens. In addition, excess dye in water are reported to cause blood clotting and respiratory disorders [5]. Textile dye effluents are characterized by highly alkaline pH and low BOD/COD ratio. Treatments of textile dyeing effluents are considered important in aesthetic point of view, as the presence of color is easily noticeable and objectionable. Conventional methods of treatment like ozonation, adsorption, photo oxidation, reverse osmosis, ion exchange, froth floatation and coagulation have been employed and found to suffer from some of the de-merits like low efficiency, expensive, excessive use of chemicals during treatment and generation of secondary waste [6]. Biological treatment of dye effluent using fungi and bacteria has been reported to perform satisfactorily [7]. Maximum decolorisation efficiency of 69.5% was reported in study using Pseudomonas putida using a simulated dye effluent [8]. Novel treatment methods using ZnO/ZTO composites reported 77% COD removal with textile wastewater [9]. Even though biological methods involving aerobic, anaerobic and facultative cultures were applicable, the dye molecules are reported to be resistant and re-calcitrant in nature. To overcome the disadvantages associated with these abovementioned treatment methods, a need to identify an economical and suitable alternative is proposed by the environmental scientists. Biosorption, a technique involving the use of natural biomass (either in original or modified form) for removing the pollutants from wastewater, is identified as a solution to this problem [10]. This method involves passive uptake as the mechanism of removal and thus proved suitable for the highly resistant dye molecules. Research studies on removal of basic dye using dried activated sludge [5], acid blue by cone biomass [11], dyes by apricot [12], Acid black 1 biosorption by Cystoseira indica and Gracilaria persica [13], malachite green on rice husk activated carbon [14] and congo red by clay [15] have been reported. Smectite rich natural clays have been employed for the adsorption of anionic and cationic dyes [16]. In this research study, a cheap locally available biomass, Prosopis cineraria, was identified as a potential biosorbent after thermal activation. The ability to treat various concentrations of the dye effluent was studied. Kinetic modeling was carried out and the model parameters were estimated. The biosorbent was analysed using X-ray fluorescence technique.
2. Materials and Methods
2.1. Physico-chemical Characterization of Textile Dye Effluent
The textile dye effluent was collected from an industry located in Muscat, Oman and the essential physico-chemical characteristics were evaluated using standard methods [17]. Table 1 presents the physico-chemical parameters determined.

Characteristics of Textile Dye Wastewater
2.2. Synthesis and Activation of Biosorbent
Prosopis cineraria, a member of Fabaceae family, are commonly found in Oman. The tree well is known for its climate adaptation and grows in height from 3–5 m. This locally available tree biomass was chosen and the tree barks were cut and washed using tap water more than once to clean and make it free from impurities. The cleaned wood was broken into small pieces and dried in sun for 5 days. The dried wood was thermally activated by heating in a furnace in two phases: a primary phase of 2 h heating at 60°C followed by a secondary phase of 1 hour heating at 100°C. The thermally activated tree biomass was powdered and sieved. The particles in the size of 150–300 μm were chosen and used for the study. The synthesized biomass was termed as Thermally Activated Prosopis cineraria Biosorbent (TAPB).
2.3. Kinetic Experiments
The experiments were conducted at the actual dye effluent pH, room temperature and constant shaking conditions of 250 rpm. In the first set of experiments, the effects of contact time and effluent concentration was investigated by varying the effluent concentrations in the range of COD values 326–1,303 mg/L over an equilibrium time of 360 min. The time versus COD data was recorded at periodic intervals of time. In the second set of experiments, the influence of biosorbent dose was studied in the range of 0.25–4.0 g/L with an initial COD value of 1,303 mg/L at actual pH and room temperature. The COD removal and uptake values were recorded. The treated dye effluent samples were filtered through filter paper and then the filtrates were collected and analyzed for remaining COD. The % COD removal and COD uptake were defined in Eq. (1) and Eq. (2), respectively.
Where qe (mg of COD removed /g of TAPB) is the COD uptake (amount of COD adsorbed on TAPB), Ce and Co (mg L−1) are the initial and equilibrium COD values, respectively, V is the volume of the effluent (L) and m is the mass of TAPB (g). To identify the mechanism of COD removal, three kinetic models, namely pseudo second order, power function and Elovich models, were fitted to the experimental data.
3. Results and Discussion
3.1. Characteristics of the Sorbent
The characteristics of the adsorbent were studied by carrying out an chemical composition using XRF analyzer (PANalytical - Axios max, Netherlands). The component analysis of the selected biosorbent, TAPB, was presented in Table 2. Calcium oxide was found to be the major component with a concentration of 21.32% followed by potassium oxide.
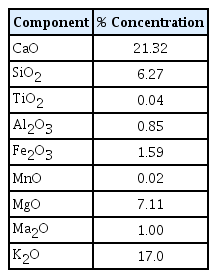
Chemical Composition of TAPB Using XRF
3.2. Effect of Effluent COD and Contact Time
The effluent characteristics, represented in terms of COD, are expected to vary depending on the process conditions. To evaluate the relationship between effluent concentration and COD removal efficiency, the experiments were conducted at four different initial COD values. The variation in COD removal efficiency was plotted in Fig. 1. At actual pH and room temperature, the equilibrium COD removal percentage was observed to be 92% with an initial COD of 326 mg/L. With increase in effluent COD, the removal efficiency decreased. The maximum COD removal efficiency achieved with the undiluted dye effluent (COD = 1,303 mg/L) was 68%. The removal curves showed two phases: a steep initial curve followed by a plateau. Higher removal rates during the initial phase of contact (90 min) were related to the increased availability of unoccupied surface sites for biosorption. The decrease in rate of COD removal during the later stages of contact was attributed to the occupancy of the surface sites by the organic molecules present in the dye effluent. Decrease in removal percentages and requirement of higher contact time at high concentrations of dye effluent were reported in a metal hydroxide sludge based biosorption study [5]. Biosorptive removal of mercury using Phoenix Dactylifera biomass presented similar views on effect of pollutant concentration [6]. Studies on removal of direct dyes Solar red BA and solar brittle blue onto using Eucalyptus angophoroides bark reported an uptake of 49 mg/g and 43.5 mg/g, at pH 2.0 [18]. Adsorption of malachite green on acid treated Prosopis cineraria sawdust reported decrease in removal efficiency with increase in dye concentration [19]. Phenol removal using activated carbon derived from the Prosopis cineraria pods reported decrease in percentage removal when phenol concentration was increased from 10 to 100 mg/L [20].

Effect of initial COD of dye effluent and contact time on removal efficiency.
3.3. Effect of TAPB Dosage
The quantity of the adsorbent is a measure of surface area and number of active sites available for contact with the dye effluent. The TAPB dosage was varied in the range of 0.25–4.0 g/L and the experimental results were presented in Fig. 2. The COD removal efficiency increased from 28% to 72% with increase in sorbent dose from 0.25 to 4.0 g/L. The removal efficiency increase was related to higher ratio of sorbent sites/ sorbate molecules. The increase was proportionate in the range of 0.25–2.0 g/L sorbent dosage and a flat pattern with limited change in removal efficiency was observed in the dose range of 2.0–4.0 g/L. Superficial sorption occurring at higher sorbent dosage could be a reason for this phenomenon. The COD uptake exhibited an inversely proportional relationship with sorbent dose and the uptake decreased from 147.9 to 70.96 mg/g when the dosage increased from 0.25 to 4.0 g/L. Improper interactions, electrostatic attraction and interference between binding sites at higher dosages were presented as the reasons for decrease in uptake. Treatment of tannery effluent using fungal biosorbent presented similar observations on uptake [21]. Research studies on removal of direct dyes using Eucalyptus angophoroides bark reported good uptakes at optimal biosorbent dose of 0.1 g [18].
Effect of TAPB dose on the dye effluent COD removal and uptake.
3.4. Kinetic Modeling and Estimation of Parameters
The rate controlling mechanisms are identified through kinetic experiments. Adsorption process could be represented by any of the following mechanism: (1) Intraparticle diffusion, where adsorbate molecules percolates into the interior of adsorbent particles pores, (2) liquid film or surface diffusion where the adsorbate is transported from the bulk solution to the external surface of adsorbent and (3) adsorption on the interior sites of the sorbent [19]. The COD removals versus time observations were fitted using three different kinetic models. The pseudo-second-order equation was proposed for solid phase sorption [20] and the linear form of this equation presented as Eq. (3) was fitted.
where q1 (mg g−1) is the maximum adsorption capacity and q (mg g−1) is the COD adsorbed at time, t, and k1 (g (mg min)−1) is the equilibrium rate constant for pseudo-second order adsorption.
The power function model represented as Eq. (4) relates the uptake capacity as a power function of time and it becomes a parabolic equation resembling intra particle diffusion when the value of n is 0.5 [10].
where kp and n (usually positive and < 1) are model constants.
The Elovich equation, originally presented is usually applied in chemical adsorption processes and suitable for systems with heterogeneous adsorbing surfaces [24].
The linearized form of Elovich model is represented by Eq. (5).
where α denotes the initial adsorption rate (mg/g min) and β denotes the desorption constant (g/mg). The three kinetic models were fitted to the experimental observations and shown in Fig. 3, 4 and 5. The slopes and intercepts of the linear plots and the best fit equation parameters for exponential curve were respectively used to find the kinetic constants. Table 3 presents the various model constants n along with the goodness of fit parameter, R2. Pseudo-second order model was found to represent the dye effluent COD removal in a better way with comparatively higher values of R2 (> 0.97). The pseudo second order rate constant decreased from 0.93 x 10⁻⁵ to 0.098 x 10⁻⁵ g/(mg min)when the effluent COD increased from 326 to 1,303 mg/L. The uptake values predicted by pseudo second order model resembled with the experimental values. The power function model, represented by Fig. 4, fitted to parabolic relation for the effluents with COD values 652 and 1303 mg/L and intraparticle diffusion could play a role in this variable range. Elovich model was represented in Fig. 5 and proved to be an inferior fit compared to the other models. But, a mixed goodness of fit with two models, namely pseudo second order model in the entire COD range 326–1,303 mg/L and power function model in the COD range 652–1,303 mg/L, confirmed the presence of more than one rate controlling mechanisms. The agreement of the pseudo second-order kinetic model with experimental data confirmed that the rate limiting step was chemisorption. This could be due to the involvement of valence forces through sharing or exchange of electrons between adsorbent and adsorbate [25]. Studies on the removal of Methylene Blue using raw kaolin reported good fit of experimental data with pseudo-second order model [26]. Adsorption studies on textile dyes using an activated carbon and crosslinked polyvinyl phosphonic acid composite reported good representation by pseudo-second order model [27]. The future application of this novel sorbent is proved through the experimental studies conducted.

Pseudo-second order model plot for treatment of dye house effluent.

Power function model plot for the treatment of dye house effluent.
Elovich model plot for the treatment of dye house effluent.

Kinetic Model Parameters for Treatment of Dye Effluent
4. Conclusions
The present investigation revealed that Prosopis cineraria, which are abundantly available cheap biomass, can be successfully employed for treating the dye effluent after thermal activation. The synthesized adsorbent treated the dye effluent satisfactorily with a maximum COD removal efficiency achieved at the actual pH. The optimal TAPB dose was identified as 2.0 g/L and the COD removal efficiency increased with increase in dose. The kinetic modeling proved the suitability of pseudo second order model to represent the entire range of experimental data and the model constants were determined. Power function model represented the observations partly and approached parabolic equation. The equilibrium COD uptake achieved with the actual dye effluent was 95.7 mg/g and comparable with the uptake capacities achieved through other methods. A novel dye effluent treatment alternative was proposed and proved though this experimental study.
Notes
Author Contributions
R.N. (Associate Professor) conducted all the experiments and prepared the manuscript. R.M. (Professor) performed data analysis and supported in the manuscript preparation.