1. Introduction
Landfills are usually considered as anthropogenic methane (CH4) sources that contribute significantly to the greenhouse gas emission totals [1]. Landfill methane emissions must therefore be accurately quantified to establish appropriate reduction or utilization strategies regarding methane. In addition, the design and operation of landfill gas extraction and utilization projects require reliable emission forecasts in terms of the project feasibility assessment [2].
Mathematical models have been developed to evaluate the methane emissions from landfills. The Intergovernmental Panel on Climate Change (IPCC) and the U.S. Environmental Protection Agency (USEPA) have provided first-order decay (FOD) models for the estimation of methane emissions from landfills [3–4].
The methane generation potential (represented by the L0, tCH4/t wet waste) and the methane-generation rate constant (represented by the k, y−1) are the two primary parameters in the FOD model [5]; a major challenge in landfill gas modeling is the estimation of these parameters [6]. The IPCC recommends that every country should develop country-specific emission factors that are appropriate for its circumstances and characteristics.
The k value represents the waste decomposition rate constant [7]. In general, two different approaches are used for the estimation of a landfill k value. For one of the approaches, the actual field data are used in comparison with the modeled data [6, 8]; however, this approach is limited by the spatial and temporal characteristics of the landfill. When the k value is estimated using the field data, the used-L0 errors can significantly affect the k estimates [9–10]
The other approach is the collection of landfill-waste samples, followed by the measurement of their waste biodegradability as a function of the waste age [7]. As biodegradability is a surrogate for the landfill age, a lower biodegradability is expected in older samples. The biodegradability of waste is typically evaluated using the biochemical methane potential (BMP) and large-scale anaerobic-biodegradability test methods [11–12]. Both the BMP and the large-scale anaerobic-biodegradability tests including the lysimeter test, measure the biodegradability of wastes under the anaerobic conditions that characterize landfills, and therefore are appropriate for the assessment of the possible gas generation in these settings. Because only a few grams of a sample are used for the BMP test, however, their effectiveness as a tool for the waste biodegradability assessment has been questioned; furthermore, it may be difficult to accurately characterize heterogeneous wastes. In actuality, given that the size of biodegradable waste components (e.g., food waste and paper) typically become reduced as the waste stabilization progresses, a simple fine fraction separation to remove the soil prior to the BMP test could be problematic [7].
In contrast to the BMP test, sample amounts that are more representative of the mixed waste without any segregation are used for the large-scale anaerobic biodegradability tests, and therefore more reliable and valid data are provided [12]. The major disadvantage of the large-scale anaerobic biodegradability tests, however, is the requirement of a long-term time scale. In addition, the accumulation of high concentration volatile fatty acids may decrease the reactor pH and delay the methanogenesis. For this reason, it is important to find correlations between the anaerobic-biodegradability tests and other tests that would be easier to implement [13].
Biodegradability-test methods that are based on the use of aerobic respiration indices have been recently reviewed for the waste biodegradability assessment. The basic principle of the tests for the biodegradability estimation is the amount of carbon that can be mineralized. Accordingly, the aerobic biodegradability tests have been proposed to overcome the limits of the anaerobic biodegradability tests. These aerobic biodegradability tests measure the respiration activity using the oxygen (O2) consumption or the amount of carbon dioxide (CO2) that is released under aerobic conditions [14]. Although these tests are conducted under aerobic conditions, they are currently used to assess the methane production potential of waste under anaerobic conditions. A sound correlation has been found between the anaerobic and aerobic tests for the characterization of the biodegradability of solid wastes [15]. The aerobic tests offer the advantage of a lesser time consumption compared with the anaerobic tests, and they can be implemented with all kinds of waste [16–17].
The disadvantage of the existing aerobic tests, however, is related to the sample heterogeneity. Even though Sapromat® and OxiTop® are commonly used in Austrian and German laboratories to measure the respiration activity, the tested waste samples are only from 30 g to 65 g, meaning that they may not be truly representative of landfill waste as a whole [18].
Therefore, the objective of this study is the evaluation of the use of the performance of a 17.7 L large-scale respirometer (LSR) as a biodegradability test to determine a k value for waste. A potential advantage of the LSR is the potential for a greater microbial diversity to lessen the impact of the chemical inhibitors. In addition, a comparison between an anaerobic test (GB21) and the LSR test was conducted to validate the estimated k value for which the LSR was used.
2. Materials and Methods
2.1. Site Description
The waste samples were collected at a landfill located in Yecheon City, Republic of Korea (ROK). The annual temperature in the city ranges from - 18.6°C to 38.0°C (mean of 12.2°C), and the average annual precipitation is 1,047 mm. The landfill is a valley-type landfill that received municipal solid waste from 1990 to 2010, and its volume is 123,100 m3 (area of 15,400 m2 and height of 8 m). A high-density polyethylene (HDPE) sheet was installed at the base of the landfill to prevent leachate leakage, and the landfill gas that was collected through the vertical wells was emitted into the atmosphere. The composition of the landfill gas (LFG) was determined using a portable gas analyzer (LMSxi; Gas Data Ltd., UK). By volume, the methane concentration is 29.5%.
Table 1 provides an overview of the amounts of the major landfill-waste categories from 1990 to 2008. Food and paper wastes are the major fractions, constituting about 62.9% of the total disposed amounts; however, the Ministry of Environment in ROK banned the direct landfilling of food wastes in 2005, and since then, food waste is no longer disposed into landfills. The “other” category refers to all of the materials that cannot be categorized, such as vinyl, plastic, and non-combustible wastes.
2.2. Waste Sampling and Characterization
Previous researchers have suggested that age-defined wastes should be sampled from the actual landfill sites because the coefficients in the FOD model should be determined under more realistic landfill site conditions [7, 19]. Accordingly, the landfill site was separated into four areas based on the landfill age, and four samples were collected from each area. The landfill age was estimated through an identification of the shelf life that is printed on the snack bags that were collected from the excavated wastes.
Waste sampling was conducted in 2009. To reduce the heterogeneity of the waste samples, a back hoe was used to remove the top cover soil, and then approximately 10 tons of landfill waste were excavated. The excavated wastes were sorted using a ballistic separator, whose operation is based on the differences between the specific densities and sizes of the waste components. The separator combines the separation with the classification, resulting in the following three output streams: combustible, non-combustible, and soil.
Each output-waste stream was reduced to approximately 50 kg using a conical-quartering method, and then the waste samples were sorted by hand into the following 10 types of waste: (1) food, (2) paper, (3) wood, (4) rubber, (5) vinyl/plastic, (6) textile, (7) metal, (8) glass/ceramic, (9) soil, and (10) other types of waste. The “other types of waste” refers to all of the materials that were not categorized into the types from (1) to (9) by visual examination.
2.3. Estimation of the k Value
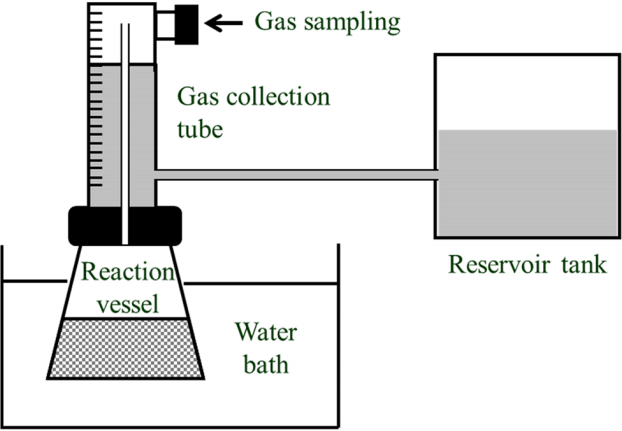
The k value of the sampled waste was determined via anaerobic-and aerobic-biodegradability tests. The anaerobic test (GB21), which is used in Germany, was conducted to estimate the biodegradability of the waste samples. The shredding of the combustible waste samples to < 10 mm, which is required for the biodegradability-test methods, was carried out before the measurements of the respiration index and the biogas-production potential. The GB21 apparatus consists of a gas-collection tube with a volume of 400 mL, and it is graduated from the upper part down (scale-graduation intervals of 5 mL). This tube is placed on a glass bottle (500 mL) via a ground-glass connection, as shown in Fig. 1. The gas-collection tube was filled with 25% NaCl. Air-tight glass bottles were filled with 50 g of sample and inoculum sludge (50 mL) and were then filled to 300 mL of water. The pH was adjusted to 7.0. The experiment was conducted for 21 days at 35°C, which is the optimal temperature for mesophilic methanogenic bacteria. The total biogas production amount was measured regularly during the experiment. The background methane production from the inoculum was subtracted from the methane production that was obtained from the sample assays. The GB21 experiment was performed in duplicate.
In contrast to the GB21 test, the LSR test does not assess the potential of a sample, but rather its activity. Binner and Zach [15] recommend a test period of seven days for a respiration-activity determination because oxygen consumption remains constant over a period of 7 to 10 days following a short lag phase. In this study, the k value of the excavated waste was determined via the LSR for 14 days at 35°C because of a lag phase.
To reduce the sampling errors that are caused by the heterogeneity of the waste samples, a 17.7 L stainless-steel drum (D 260 mm, L 500 mm) was used as a large-scale respirometer (Fig. 2). A 5 kg sample (dry base) of combustible waste was placed into the respirometer. To inoculate the sample waste, an aqueous inoculum containing microorganisms, which were extracted from compost, was added at 1% (v/v) of the nutrient medium. The components of the nutrient medium per liter are as follows: 0.25 g of FeCl3, 22.5 g of MgSO4·7H2O, 27.5 g of CaCl2, 40.0 g of (NH4)2SO4, 8.5 g of KH2PO4, 21.75 g of K2HPO4, 33.4 g of NaHPO4·7H2O, and 1.7 g of NH4Cl. The moisture content of the waste was adjusted to 50% (based on the dry matter) through the addition of water [20]. The drum lids were fitted with a pressure meter and an oxygen sensor. During the aerobic degradation, the microbes consume the O2 and produce an equivalent volume of CO2, so the measurement of the O2 consumption requires the placement of an NaOH solution so that it acts as a CO2 trap. The respiration-produced CO2 is absorbed by the NaOH so that the pressure drops in the respirometer. The pressure drop correlates with the O2 consumption, which is determined through the measurement of the pressure decrease inside the respirometer over a specified length of time. O2 limitation usually does not occur, because the O2 is supplied for consumption by the microorganisms when the O2 concentration in the respirometer is at a concentration of 18 %. All of the experiments were performed in duplicate.
where P is the pressure of the gas (atm), V is the volume of the gas (L), n is the number of moles, R is the ideal gas constant (0.082061 L-atm/mol-k), and T is the temperature (K).
where 32,000 is the molecular mass of the O2 (mg-O2), and w is the weight of the solid waste (g-Dry Matter).
The k value is the biodegradation half-life in y−1 for the landfill waste. The post-landfilling biodegradation potential of the waste is Pt (Nl/kg-DM or mg-O2/g-DM) at t years, which means that the remaining waste biodegradation potential can be described by the FOD equation shown in Eq. (3), as follows:
where Pt is the post-landfilling waste biodegradation potential at t years, P0 is the post-landfilling waste biodegradation potential at 0 y, and k is the methane generation rate constant (y−1).
In this study, a theoretical k value was calculated using the composition of the disposed waste to compare the k values that were obtained in the biodegradability tests. The k value (kwaste) of the landfill waste can be calculated from a weighted average (wt. fractioni) of the k of each biodegradable component (ki), as described in Eq. (4) as follows:
To compare the effects of the k values that were obtained in this study, the LandGEM model [4] for which each k value was used was applied to predict the annual methane production, as presented in Eq. (5) as follows:
where i is the time period of the waste disposal (y−1), j is the 1/10 time increments (y−1), n is the waste acceptance duration at the landfill (y), k is the FOD rate constant (y−1), Mi is the waste tonnage disposed in year i (Mg), L0i is the methane generation potential of the waste disposed in year i (m3 Mg−1), and ti,j is the age of the jth section of the waste Mi (y).
3. Results and Discussion
3.1. Composition of the Age-defined Waste Samples
The average waste composition of each age-defined waste sample is shown in Table 2. As previously noted, the largest disposed-waste portion in the landfill site is food waste; however, food waste was not detected in the waste samples. The results indicate that the food waste had degraded to a level at which it could not be recognized by a visual examination. In addition, the amount of food waste for the landfill ages of one year and four years is zero because of the direct-landfill-disposal prohibition that started in 2005.
The tendency of paper waste is one that decreases proportionally with time, whereas the tendency of the fraction of the non-biodegradable materials, including the vinyl and plastic wastes, increased over time. In addition, the soil proportion increased with time, indicating that the biodegradable organic matters were transformed into soil by the anaerobic degradation. For the combustible wastes, the largest components are the vinyl and plastic wastes, which are composed solely of non-biodegradable materials and therefore did not contribute to the methane-production potentials. From the waste composition results, the paper waste can be defined as the materials that can cause long-term landfill-methane emissions.
3.2. Biodegradability of the Age-defined Waste Samples
In this study, the cumulative biogas production and O2 uptake were measured to analyze the potential correlation between them. The results of these analyses are provided in Table 3. The cumulative biogas production for the waste excavated from the landfill varied from 6.9 Nl/kg-DM to 36.8 Nl/kg-DM. The cumulative biogas production for the landfilling age of one year is 36.8 Nl/kg-DM, and it decreased to 6.9 Nl/kg-DM after 14 years. Ritzkowski et al. [21] suggested the target value of 10 Nl/kg-DM for the landfill-stabilization criterion. It is evident that the results of the cumulative biogas production for the landfilling age of 14 years is clearly below the landfill-stabilization level, which indicates that no further significant degradation of the organic substances should be expected.
For the same samples, the cumulative O2 uptake varied from 11.3 mg-O2/g-DM to 60.0 mg-O2/g-DM and increased with the decreasing of the landfilling age. The cumulative O2 uptake for the landfill wastes after nine years is 20.4 mg-O2/g-DM. Using the same method, Chung et al. [20] measured the cumulative oxygen uptakes of landfill wastes after a landfilling age of seven years and obtained an estimated range of 20.3 mg-O2/g-DM to 23.6 mg-O2/g-DM, which is similar to this study’s results.
The coefficient of variance (CV), as the ratio of the standard estimate error to the mean observed-response value, defines the reproducibility of this experiment. The CV is useful since it is a normalized statistic that allows for a comparison between the two used methods. As shown in Table 3, the results of the duplicate tests show the high repeatability of the tests, with average CVs lower than 10%. However, the CV for the LSR test is lower than that of the GB21 test, indicating that the LSR-test method could provide a better representation of the waste samples.
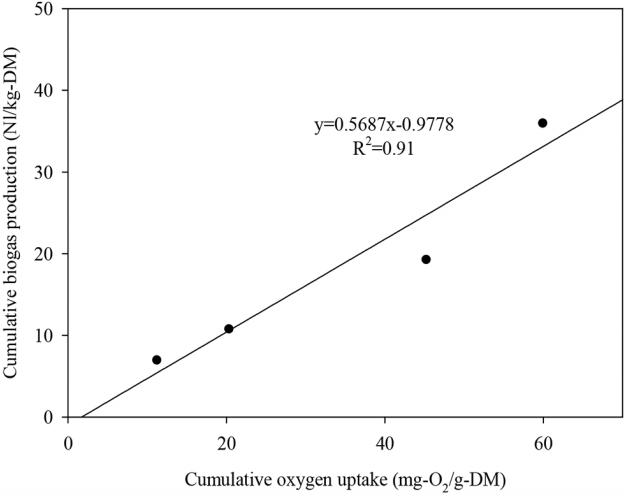
The correlation between the cumulative biogas production and the cumulative oxygen uptake is shown in Fig. 3. The data were modeled using a linear function, and the resulting correlation coefficient (R2) of the linear regression is 0.91. The cumulative oxygen uptake increased with the increasing of the cumulative biogas production, showing that, despite the aerobic conditions, the biodegradability that was obtained from the LSR test led to similar results compared with that of the GB21 test. In this respect, the LSR test can be an indicator of the anaerobic biodegradability for landfill waste.
According to previous studies [18, 22], the aerobic tests showed a strong correlation with the anaerobic tests. Therefore, the LSR-test method allows for the prediction of the long-term biodegradation potential in a shorter length of time and for the reduction of the sampling errors that are caused by the heterogeneity of the waste samples. In addition, the LSR-test method may decrease the time that is required to determine the waste biodegradability. Binner and Zach [15] recommended that an aerobic-test period of seven days is sufficient to determine the respiration activity because a period of 10 days does not provide significant additional information.
3.3. Determination of the k Value
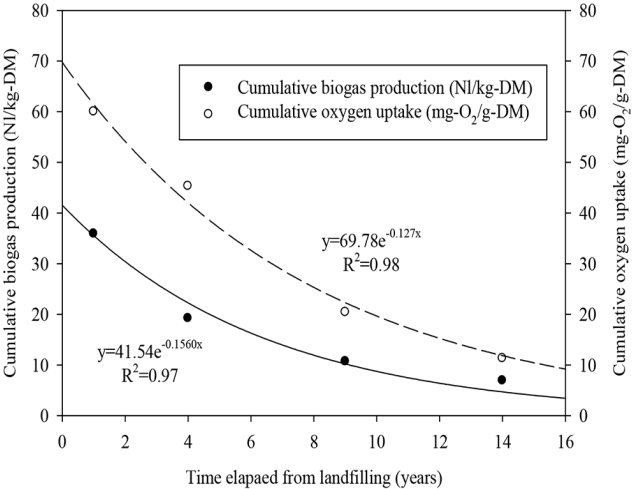
The k value is the biodegradation half-life value in y−1 for landfill waste. Fig. 4 shows the curve-fitted lines for which the FOD model in Eq. (3) is used to determine the k value. Further, the regression models that are typically used to select the best model and its parameters are applied here [23–27]. To evaluate the accuracy of the regression model, the correlation coefficient (R2) was determined, and the results for which the cumulative biogas production (GB21) was used are presented in Eq. (6), and those for which the cumulative oxygen uptake (LSR) was used are presented Eq. (7), as follows:
The correlation coefficients are 0.97 and 0.98 for the cumulative biogas production and the cumulative oxygen uptake, respectively. The k values are 0.156 y−1 and 0.127 y−1 for the cumulative biogas production and the cumulative oxygen uptake, respectively. The k values obtained from this study are within the range that is reported in previous studies. Wang et al. [28] reported estimated k values between 0.04 y−1 and 0.17 y−1 with a recommended region of 0.09 y−1 to 0.12 y−1 based on the weighted average calculations for 11 landfills; in addition, Wang et al. [29] showed that the optimal k values range from 0.07 y−1 to 0.19 y−1 at nine of the landfills. Amini et al. [30] reported decay rates from 0.04 y−1 to 0.13 y−1 for five landfills based on the LFG-collection efficiency. Sormunen et al. [31] showed that the k value for bulk waste is 0.18 y−1 in boreal and temperate climates; the k values obtained from this study are higher than the default k value prescribed by the IPCC [3], which is 0.09 y−1 in boreal and temperate climates. The higher k values obtained in this study can be explained by the high proportion of food waste that was disposed into the studied landfill, as reported in Table 1. Since food waste typically contains high moisture content, food waste may have increased landfilled waste moisture content, resulting in an accelerating decomposition rate. In addition, a higher k value will result in higher methane-generation predictions in the early years after the waste burial, resulting in higher uncollected-methane estimates in the greenhouse-gas inventories [28].
In this study, a theoretical k value was calculated using the composition of the disposed waste (see Table 1) to compare the k values that were obtained in the biodegradability tests. The IPCC [3] lists the k values for food, paper, wood, rubber, and sludge wastes as 0.185 y−1, 0.060 y−1, 0.030 y−1, 0.025 y−1, and 0.185 y−1, respectively. Other wastes, which include vinyl and plastic wastes, were not incorporated into this weighted average because those materials are non-biodegradable. Using the default values and Eq. (4), the k value was calculated as 0.113 y−1 for the landfill site. Jeon et al. [32] calculated the L0 for the S landfill in ROK and reported values between 37 m3-CH4/Mg-wet waste and 88 m3-CH4/Mg-wet waste (average of 64.5 m3-CH4/Mg-wet waste). Therefore, in this study, an average of 64.5 m3-CH4/Mg-wet waste was selected to predict the annual methane production. The LandGEM model [4] was used to predict the annual methane production using each k value, as presented in Eq. (5).
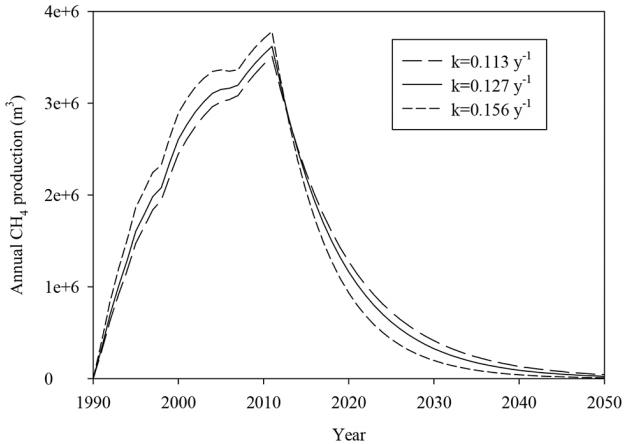
Fig. 5 presents the results of the annual CH4 generation using each k value. The CH4 generation will continue for at least 25 years from the present time. The estimated CH4-generation amounts for 2017 to 2050 are in the region from 1.0 × 10⁷ m3-CH4 to 1.6 × 10⁷ m3-CH4. Similar trends were observed for each k value, which indicates that the LSR-test method can potentially be deployed as a useful tool for the estimation of the k value, and over the lifetime of the landfill, the food and paper wastes make the most significant overall CH4-generation contribution. Food and paper wastes are the major fractions, constituting about 62.9% of the total disposed amount, as shown in Table 1. In addition, the result implies that the default k values, provided by the IPCC guidelines [3], may be used appropriately to predict the long-term methane emissions from landfill sites in ROK.
However, the method that is based on the default k values and a weighted average of the waste composition can only be employed if the waste disposed into the landfill contains a high proportion of organic waste that includes food waste. As discussed by Mou et al. [11], the low-organic wastes showed lower k values in comparison with the default k values in the IPCC [3]. Ximenes et al. [33] reported that the published decomposition factors that are based on laboratory tests significantly overestimate the decomposition of the wood products in landfill.
Moisture is essential for bacterial growth, metabolism, and nutrient transport; however, as previously mentioned, the Ministry of Environment in ROK banned the direct landfilling of food wastes in 2005. As a result of this ban, there is a lack of organic and moisture content in the landfill sites, thereby resulting in a significant decline of the LFG production that makes the already installed LFG-recovery facilities inefficient. Therefore, it is necessary to estimate the k value using site-specific values when the current FOD models are applied to ROK landfills that have incorporated low-organic waste since 2006. In addition, each waste component degrades at a different rate, indicating the difficulty in the estimation of a constant k value with the changing of the waste properties. Further studies are required to assess the k values for individual waste components.
4. Conclusions
Precise and reliable k value measurements regarding landfills are needed to develop country-specific parameters, like those that are used for the FOD model. In this study, a new k value measurement approach for which the age-defined waste is used has been suggested. In this method, the waste biodegradability is measured using a 17.7 L LSR. The calculation of the microorganism-consumed O2 is possible when the O2 concentration in the respirometer reaches 18%, and therefore an O2 limitation typically does not occur. The results demonstrate very sound regression correlations between the GB21 and the LSR, thereby indicating that the anaerobic tests can be replaced by aerobic tests. Also, the LSR can reduce the sample heterogeneity compared with the other approaches. The CV for the LSR is lower than that of the GB21, indicating that the LSR test could potentially provide an even better representation of waste samples. Therefore, the LSR-test method allows for both the prediction of the long-term biodegradation potential in a shorter length of time and for the reduction of the sampling errors that are caused by the heterogeneity of waste samples.
This work contributes to the understanding of the decomposition rate of landfill waste through an examination of the biodegradability determination and the provision of a landfill k value. A better understanding of an appropriate k value that can be used in gas-production modeling is necessary because of its potential implications for the inventorying of the greenhouse gas emissions regarding the existing landfills.