1. Introduction
Conventional activated sludge processes have been widely adopted for over 100 years in the treatment of domestic wastewaters because of their excellent ability to easy handling of huge amount wastewaters. However, these processes have several disadvantages such as larger area requirement and lower solid-liquid separation efficiency. To overcome these problems, membrane separation techniques have been applied to bioreactor system for biosolids separation. With a membrane bioreactor system, mixed liquor suspended solids (MLSS) concentration up to 50,000 mg/L [1] can be attained and it can accomplish compact plant size as well as higher decomposition rate of organics.
Flotation is another technique for separating low density solids from liquid. Especially it is the most effective for the separation of oil and low-density suspended solids [2–4]. Although dissolved air flotation (DAF) is predominant in use today, electroflotation (EF) may be an attractive alternative because of its potential to generate relatively homogeneous micro-bubbles and simplicity of operation [2, 5]. In DAF systems, microbubble is produced with the pressurized flow by means of a pump to 275 to 350 kPa. EF systems applies electric current to the electrodes and relatively uniform-sized microbubbles are produced through electrolysis of the solution. EF has been tested to treat oil-water emulsion [6], mining wastewater [7], and many other water and wastewaters [8–14]. Choi et al. [15] investigated that stable solid-liquid separation could be accomplished by EF regardless of sludge settleability and final concentration of the EF thickened sludge reached 14,000 – 30,000 mg/L. They also reported that the dewaterability of the EF thickened sludge was improved by air bubbles entrapped within the sludge bed. Although EF may have its potential application in the treatment of high intensity organic wastewater with increased biomass concentration, just few studies applied EF to biological treatment system.
The purpose of this study was to investigate the performance of EF combined sequencing batch reactor system (EF-SBR) in the treatment of high intensity organic wastewater. Three different organic loading conditions (250,000 and 750 mg COD/L) were applied in EF-SBR and C-SBR system. Sludge thickening characteristics during solid-liquid separation period of the SBR systems were identified by interface height (C-SBR) or sludge bed bottom height (EF-SBR) variation. The thickening efficiency was determined by both thickening ratio and effluent water quality after thickening.
2. Materials and Methods
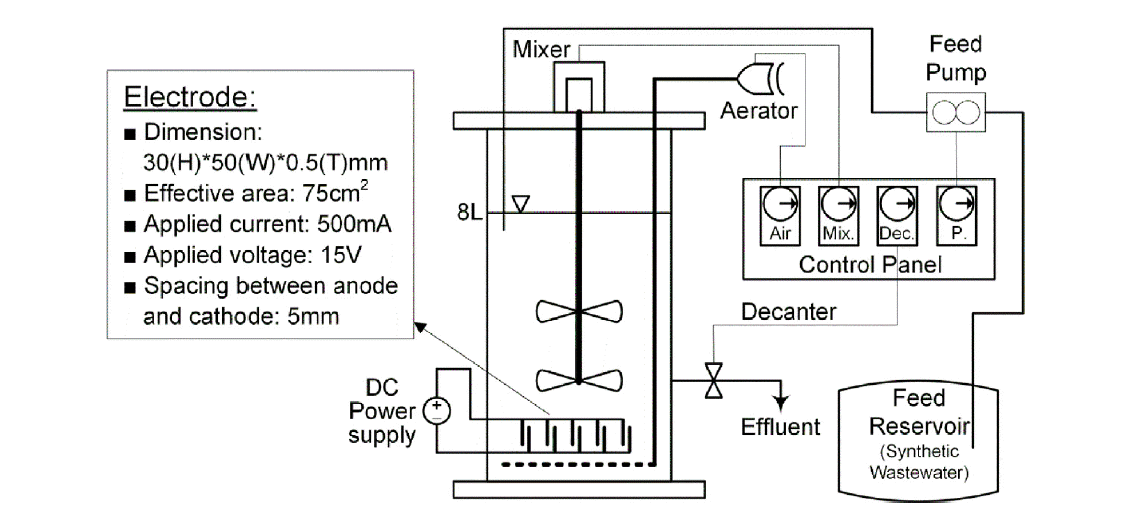
A schematic of EF-SBR system is shown in Fig. 1. For the generation of micro-bubbles during EF, there are five stainless steel electrodes connected in a dipolar mode at the bottom of the 8L bench-scale EF-SBR reactor, with the dimension of 30 (height) × 50 (width) × 0.5 (thickness) mm. The effective area of each electrode is 15 cm2 and therefore total effective area of the electrodes is 75 cm2. The current and the voltage applied to the electrodes were 500 mA and 15 V, respectively. The resulting current density was nearly 6.7 mA/cm2, which was within the typical range for EF operation [2, 15]. The spacing between electrodes is 5 mm.
In EF-SBR system, 30 min was enough to separate biosolids from liquid. However, sludge settling time in C-SBR system should be maintained around 1 hr for sufficient solids-liquid separation. Therefore, additional 30 min of reaction time could be acquired in EF-SBR system and it was assigned for mixing (anoxic period) as shown in Fig. 2. A cyclic time was 6 hr and 5 L wastewater was treated during a cycle. We operated both SBR systems for 180 days (60 days at each phase) excluding initial 30 days of seed sludge acclimation to synthetic wastewater. The seed sludge was taken from a domestic wastewater treatment plant operated with a biological nutrient removal process. Major components of synthetic wastewater at each phase are summarized in Table 1.
3. Results and Discussion
3.1. Solid-liquid Separation
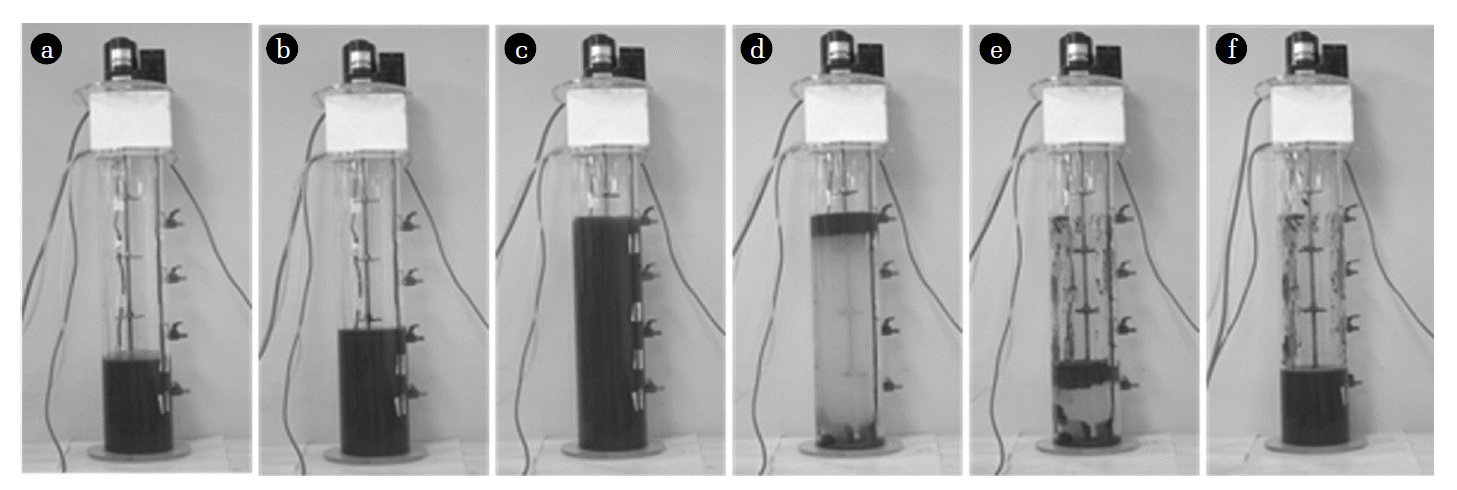
Fig. 3 illustrates a cyclic operation of EF-SBR system at phase I. Biosolids (MLSS: 3.5 g/L) are perfectly separated from liquid phase within 30 min by EF and over 90% of biosolids volume reduction could be accomplished as shown in Fig. 3(d). Choi et al. [15] reported similar results of EF performance. They investigated that biosolids (MLSS: 3.6 g/L) volume reduction could approach 75% with just 5 min EF of an activated sludge.
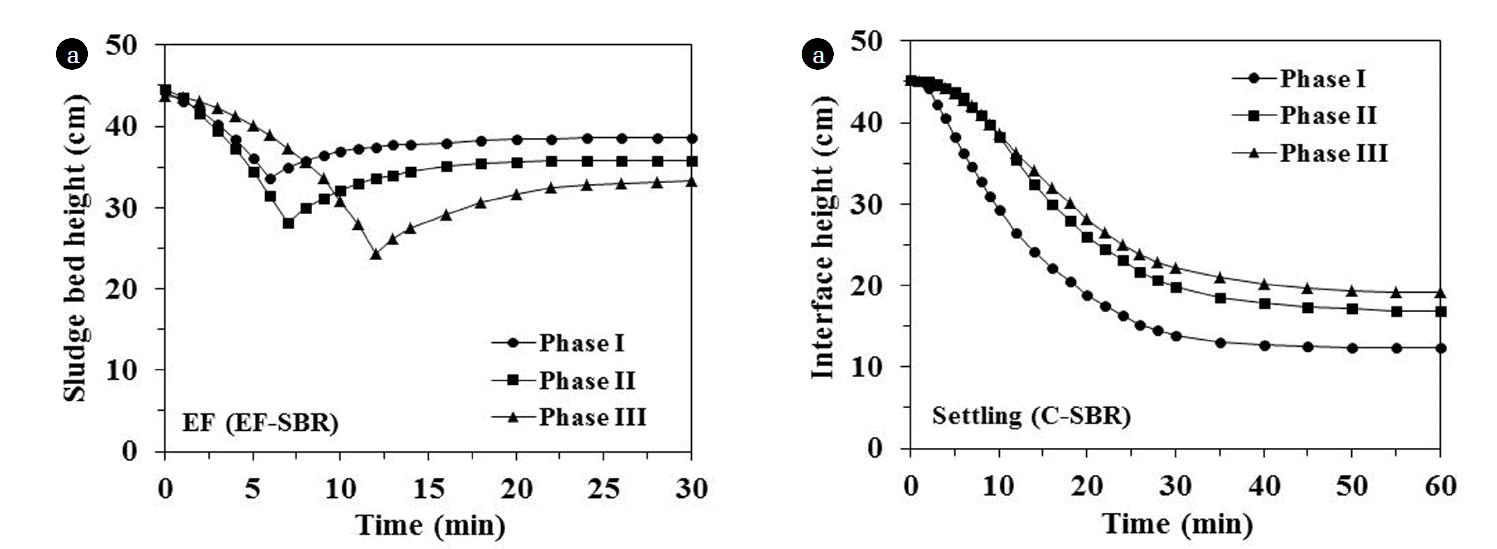
The electro-flotation and settling behaviors were estimated by sludge bed height and interface height for EF-SBR and C-SBR sludge, respectively (Fig. 4). The settling efficiency in terms of SVI30 (sludge volume index after 30 min of settling) was the best (SVI30 = 83.7 mL/g) at the highest influent loading condition (phase III) in C-SBR. The worst SVI30 at phase I (111.2 mL/g) was seemed to be responsible for relatively smaller floc size at lower loading condition as reported by Barbusinski and Koscielniak [16].
In EF-SBR, sludge bed height was defined as the distance between the bottom of the reactor and the bottom of the sludge bed. Sludge thickening pattern by EF is clearly divided into two phases as shown in Fig. 4: the initial formation of the sludge bed and subsequent compression of the sludge bed. The reflection points in Fig. 4 (EF-SBR) indicate transition point of the first phase into second phase. The sludge at phase I shows the fastest transition point (6 min) because of the lowest MLSS concentration (2.8 g/L). While, the slowest transition point (12 min) is observed in the sludge at phase III with the highest MLSS concentration (8.3 g/L). After 30 min of EF, complete solid-liquid separation could be accomplished and therefore EF was not continued after 30 min. In spite of relatively short solid-liquid separation time, EF showed much higher thickening efficiency than gravity sedimentation for all sludges.
In order to compare the thickening efficiency of EF and gravity settling, thickening ratio is defined as the ratio of initial height of mixed suspension to sludge bed thickness after 30 min thickening. The thickening ratios of C-SBR sludges are 2.1 – 3.3. However, EF improved the thickening ratio remarkably to 3.8 – 8.1 as shown in Fig. 5. Choi et al. [15] reported that 3.4 – 10.1 times higher thickening ratio could be obtained with EF even for bulking sludge of which SVI30 was higher than 230 mL/g.
3.2. Biosolids Concentration and Organic Removal
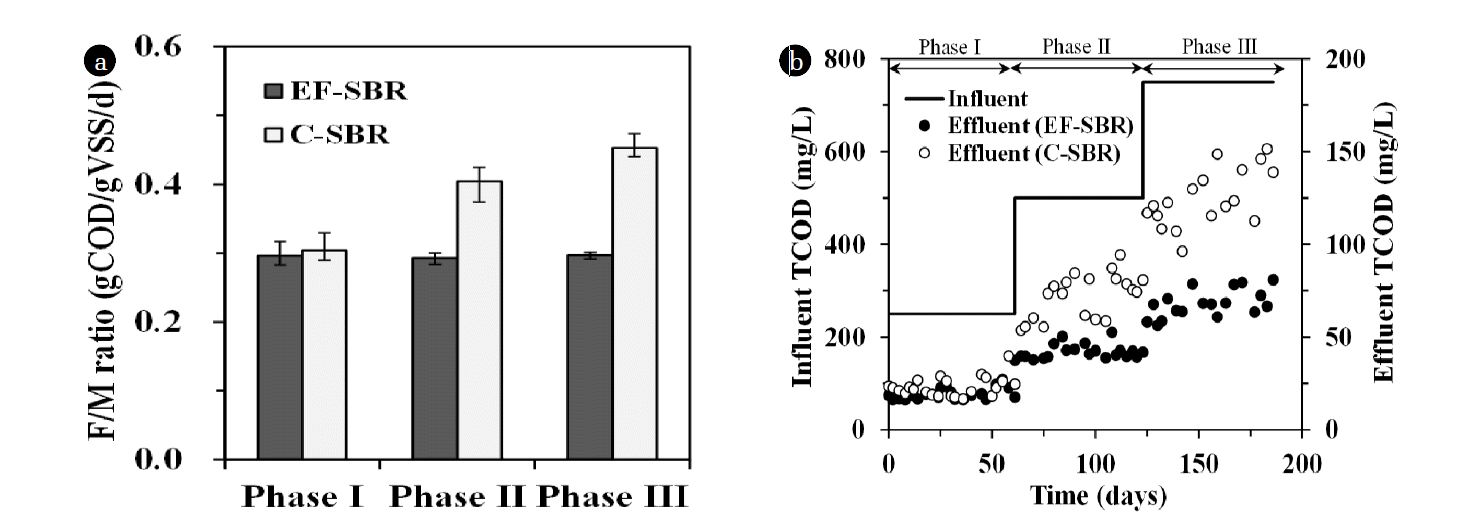
In order to maintain F/M (food to microorganisms) ratio at 0.3 g COD/g VSS/day, sludge wasting volume was adjusted every other day. Therefore, MLSS concentration was increased with respect to the increase of influent organic loading rate (5, 10 and 15 g COD/day at phase I, II and III, respectively). In EF-SBR system, MLSS concentration could be easily controlled around 2.8, 5.6 and 8.3 g/L at phase I, II and III, respectively as shown in Fig. 6. However, it was impossible to maintain the MLSS concentration at desired level in C-SBR in spite of no sludge wasting because of limitation of solid-liquid separation by gravity settling after phase I. The biosolids particles which did not settle within 1 hr of sedimentation time washed out from the reactor and deteriorated effluent suspended solids (SS) concentration of C-SBR as shown in Fig. 6.
Fig. 7. shows the F/M ratio at each phase and organic (total chemical oxygen demand; TCOD) removal performances of the SBR processes. As described before, the F/M ratio of EF-SBR could be maintained at 0.3 g COD/g VSS/day. However, it was increased from 0.3 to 0.45 g COD/g VSS/day because of insufficient MLSS concentration at phase II and III in C-SBR process. In addition to this, lower solid-liquid separation efficiency and subsequent biosolids wash-out gave rise to deterioration of effluent TCOD concentration in C-SBR. TCOD removal efficiency of C-SBR process is decreased from 91% (phase I) to 83% (phase III). However, EF-SBR showed stable performance of organic removal (91% TCOD removal at all phases). EF-SBR also showed higher nutrient removal efficiencies which was responsible for relatively abundant biomass and increased cyclic reaction time (30 min) compensated by reduced solid-liquid separation time.
4. Conclusions
A SBR process with high biomass concentration over 8 g MLSS/L could be operated by introducing electro-flotation as a biosolids separation method. MLSS concentration of the process (EF-SBR) could be easily controlled at desired level for different organic loading condition in order to satisfy designed F/M ratio (0.3 g COD/g VSS/day). Stable maintenance of F/M ratio and lower effluent SS concentration (< 15 mg/L) accounted for remarkable improvement of organic removal efficiencies in EF-SBR process.


