1. Introduction
Application of purple non-sulfur bacteria (PNSB), a photosynthetic heterotrophic bacteria, to wastewater treatment has been suggested for organic recovery from wastewater. Advantages in introduction of PNSB are high organic yields of PNSB and nutrition of PNSB cells, which were reported to be good alternative for fish feed because of their richness in proteins and vitamins [1]. An anaerobic photosynthetic process, in which PNSB are cultivated in non-axenic culture under anaerobic conditions, has been proposed for biomass production from high-loading organic wastewater [2–5]. In the anaerobic photosynthetic process, anaerobic conditions enhance productivity of PNSB because PNSB achieve high carbon yields when they grow photosynthetically under anaerobic or semi-aerobic conditions [2, 6]. Non-axenic culture is reported to enable degradation of carbohydrates and proteins by allowing presence of acidogenic bacteria which produce fatty acids, which are organic substrates preferred by PNSB [3, 6].
Noodle-processing factories in Thailand, which produces noodles from rice, consume a large amount of water mainly in rice washing process, and discharge wastewater containing a high concentration of starch with a high C/N ratio. A stabilization pond is often introduced for the wastewater treatment because of low construction and operating cost. However, a high organic load often makes the pond into anaerobic condition and causes odor problems and treatment failure. An anaerobic photosynthetic process could be one of the attractive solutions to overcome those problems because it is supposed to be suitable for treatment of high-loading organic wastewater with a high C/N ratio.
Selection of light sources is one of the significant factors to optimize the performance of an anaerobic photosynthetic process. Purple non-sulfur bacteria mainly utilize light in infrared region which is the main absorbance waveband of bacteriochlorophylls, while microalgae, a competing microorganism of PNSB, mainly grow with visible lights. Previous studies [4, 5] have shown that installation of infrared transmitting filter to cut off visible and ultraviolet light prevented microalgal growth and promoted growth of purple-non sulfur bacteria. In addition to utilization of light filters, application of light emitting diodes (LEDs) can be considered as an alternative light source because of their high energy efficiency and wavelength specifity. The objective of this study was to investigate the effect of light sources on performance of an anaerobic photosynthetic process. Infrared LEDs and tungsten lamps covered with commercial infrared transmitting filters were installed into bench-scale photo-bioreactors. Organic removal and photo-synthetic biomass productivity from food-processing wastewater was compared to evaluate effects of light sources.
2. Materials and Methods
2.1. Inoculant
The inoculant sludge was taken from a laboratory-scale sequential-batch anaerobic photo-bioreactor, where PNSB were enriched. The sludge contained 2.2 μmol/g SS of bacteriochlorophyll a (bchl. a) and was expected to be a mixed culture containing PNSB [5]. The PNSB containing inoculant sludge was cultivated with diluted wastewater from a food processing factory for acclimation.
2.2. Photo-bioreactor
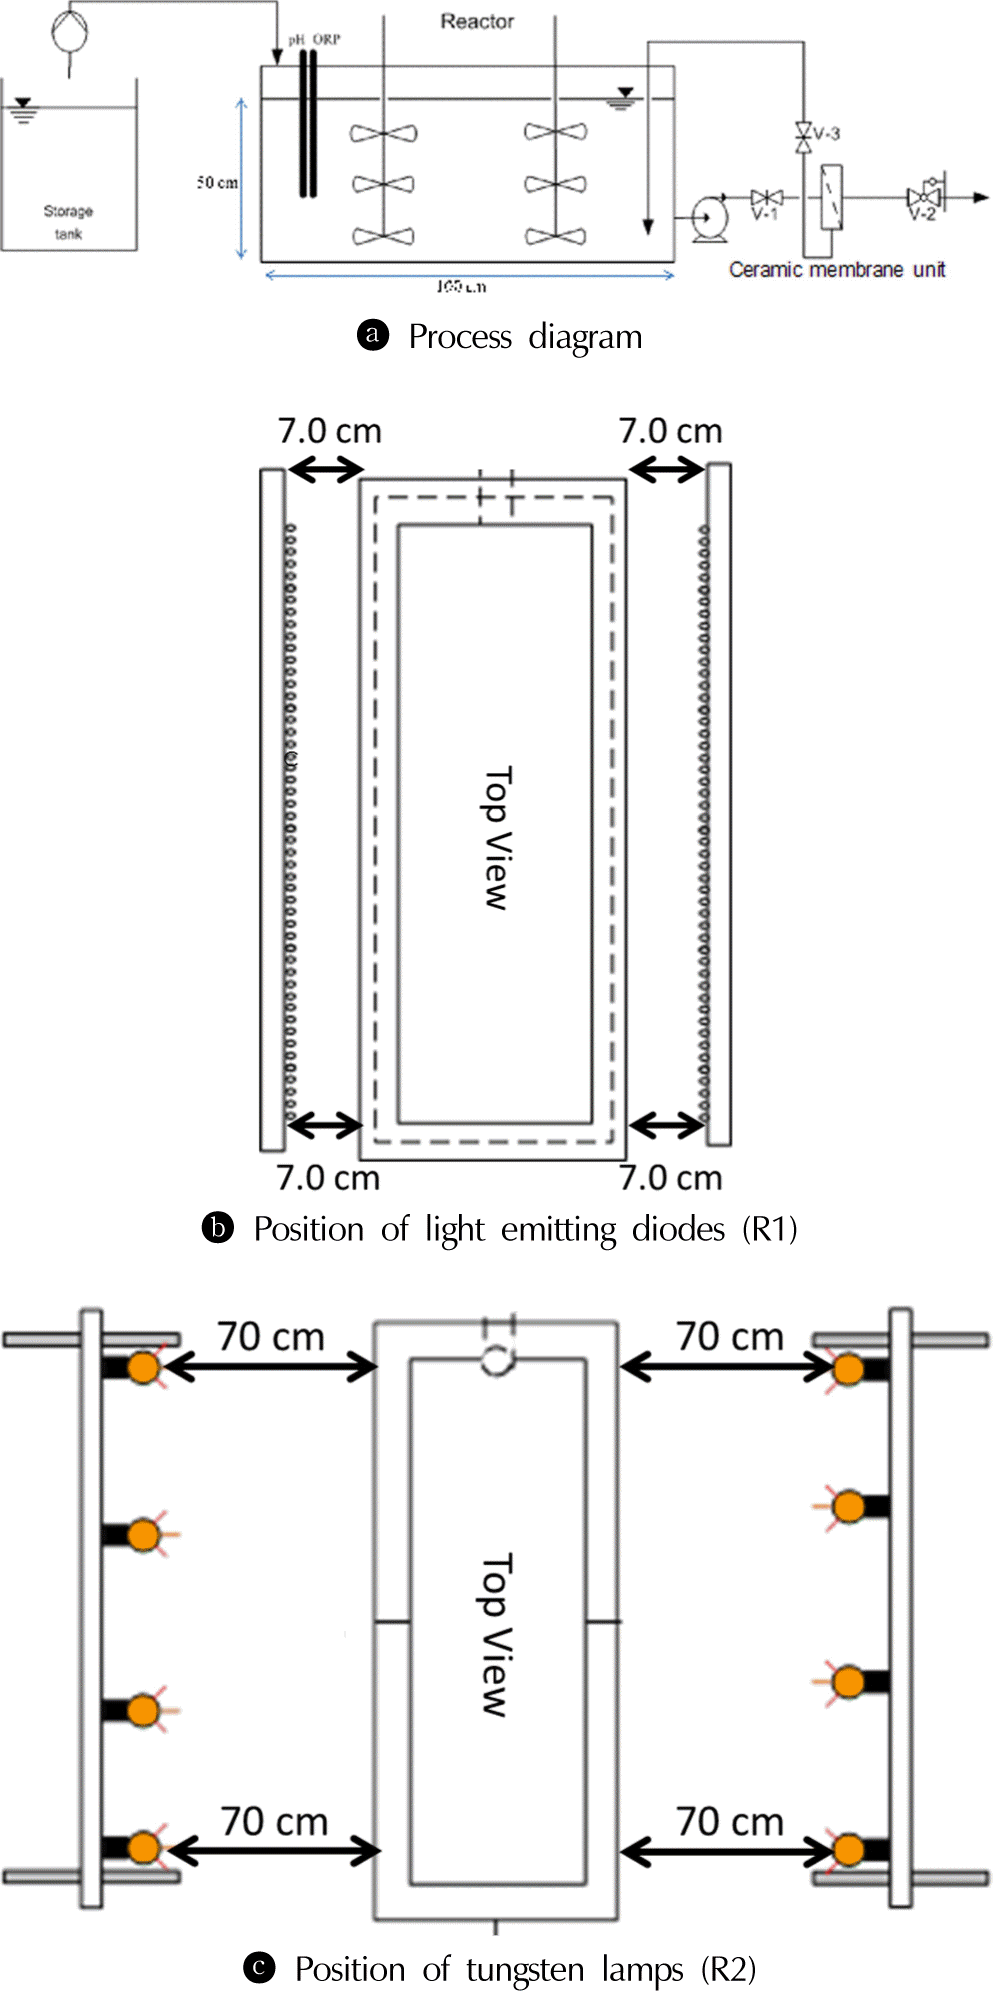
A photo-bioreactor was made of acrylic with a working volume of 150 L (Fig. 1). The inner dimension of a photo-bioreactor was 100 cm (length)×30 cm (width)×50cm (depth). Its surface volume ratio (SVR) was 8.67 m−1. The first photo-bioreactor (R1) was lighted with 600 units of 1 W infrared LEDs, with peak wavelength of 890 nm (THSF64100; Vishay Electronic GmbH, Germany), whereas the second photo-bioreactor (R2) was covered with filter (Automotive film FX-HP5; 3M, USA) to cut off ultraviolet and visible waveband (Fig. 2), and lighted with 24 units of 60 W tungsten lamps. Maximum light intensities measured at the surface of the photo-bioreactor with infrared LEDs and tungsten lamp with filter were 14 and 20 W/m2 respectively. Both photo-bioreactors were illuminated for 24 hours/day.
2.3. Operation of Photo-bioreactors
To start up the photo-bioreactors, five-liter of the inoculant sludge was added to each photo-bioreactor, and the diluted wastewater, which was prepared by diluting 15 L of wastewater with 35 L of autoclaved distilled water. The diluted wastewater was continuously supplied at a feeding rate of 10 L/day to the final volume of 150 L.
After the starting-up and acclimation of the photo-bioreactors, continuous treatment was performed with simulated wastewater from a noodle-processing factory, which made noodle from fermented rice powder. The simulated wastewater was prepared by adding fermented starch powder into tap water, regarding wastewater quality of the factory, which had 3,500 mg/L of COD, 25 mgN/L of total Kjeldahl nitrogen. The simulated wastewater was fed at a flow rate of 25 L/day, which corresponded to 6 days of hydraulic retention time (HRT). The chemical oxygen demand (COD) concentrations of feed wastewater were gradually increased from 100 to 300 mg/L in the inital period (day 0–100), to 3,500 mg/L in the middle period (day 101–210), then maintained at 3,500 mg/L in the stable period (day 211–323). However, actual COD concentration of the simulated wastewater varied dependent on solubility of fermented starch powder. Temperature was kept at ambient condition and heat emitted from tungsten lamps was dispersed by electrical fans. The photo-bioreactor was operated under completely mixed condition by two sets of mixer. Feeding of wastewater and withdrawal of PNSB culture in the reactor was conducted once a day. Withdrawn culture was filtered with ceramic membrane to retain PNSB biomass in the reactor. Biomass in a photo-bioreactor was withdrawn occasionally to maintain SS concentration at approximately 1,000 mg/L or higher. Oxidation–reduction potential (ORP), temperature and pH of photo-bioreactor were continuously monitored and recorded. The value of pH was controlled at 7.0±1.0.
2.4. Sample Analyses
Organic removals in terms of biochemical oxygen demand (BOD) and chemical oxygen demand (COD) were monitored in both photo-bioreactors. A COD concentration was determined both for filtered samples as soluble COD and unfiltered samples as total COD. The growth of photosynthetic bacteria was measured in terms of suspended solids (SS). The total biomass production or cumulative biomass production over the experimental period was calculated as a summation of biomass accumulated within the reactor and cumulative biomass withdrawn from the reactor. The conversion of carbon recovery to photosynthetic biomass production during photo-bioreactor operation at each stage was determined on mass basis by dividing the cumulative biomass production by the mass of BOD and COD removed. All water quality analyses were performed according to APHA [7]. Protein content in biomass was determined by the Lowry method after cell dissolution by adding equivalent volume of 1N NaOH to each sample and heating in boiling water for 5 min. Bovine serum albumin was used as standard protein. The ratio of single cell protein content of biomass cells, also known as the average protein production per unit weight of dried solids was calculated through the biomass production on mass basis of the protein retained in the reactor divided by total biomass retained in the reactor. Photosynthetic pigments, bacteriochlorophyll a (bchl. a) and carotenoids, were determined according to Chitapornpan et al. [5]. An average ratio of pigments in biomass cells was calculated by measuring of photo-synthetic pigments of biomass retained in the system divided by the SS concentration retained in the reactor.
3. Results and Discussion
3.1. Organic Removal
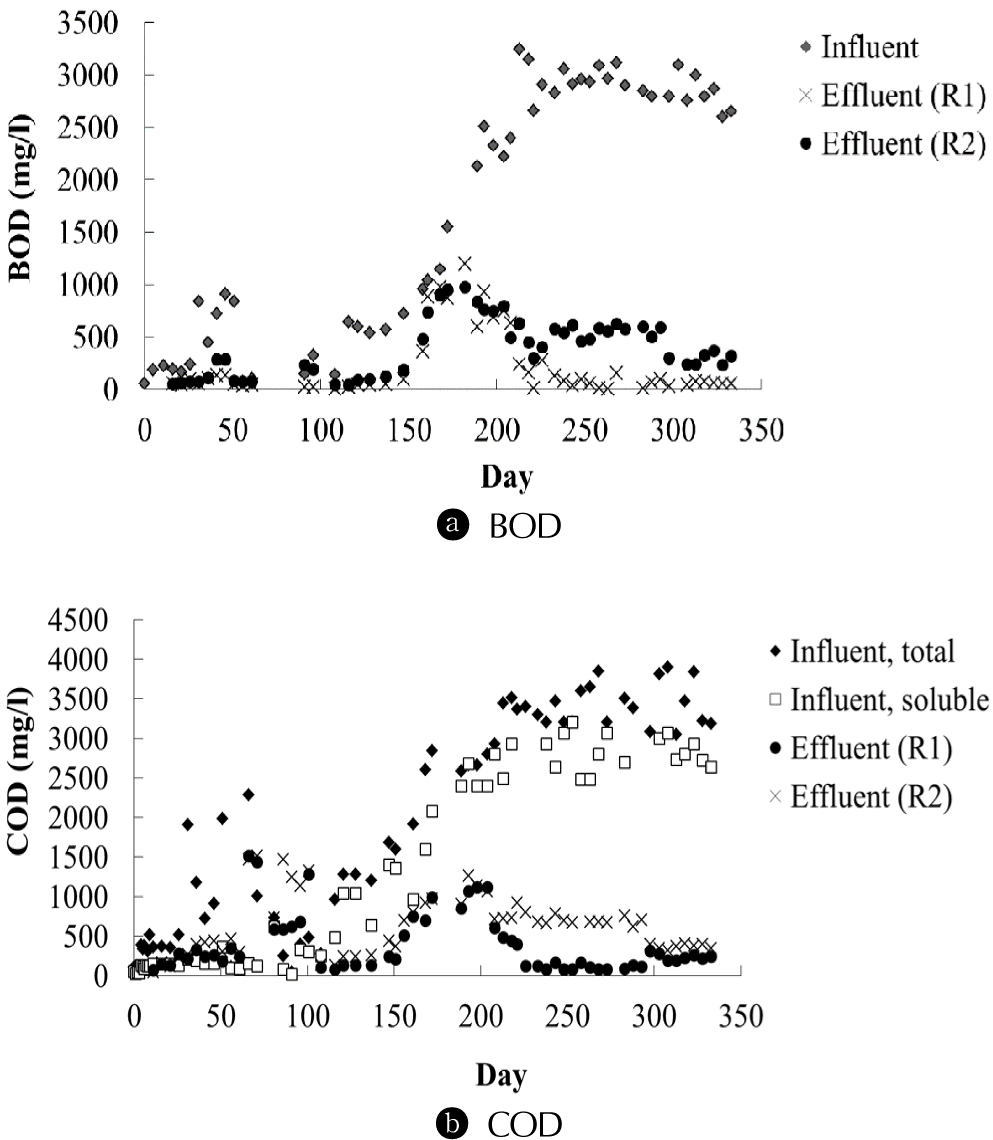
Removal of BOD and COD was higher in R1, with infrared LEDs, than R2, with filtered tungsten lamps, throughout the operation (Table 1). In the initial and middle periods (day 0–210), removal of COD was not very high probably because of a large fluctuation of organic loading in influent wastewater dependent on solubility of fermented starch powder (Fig. 3). However, in the stable period (day 211–323), BOD and COD removal reached sufficiently high at 97% in R1 and 84% in R2. Removal ratio in R1 was statistically significantly higher than in R2 except BOD removal in the middle period according to t-test.
In R1, BOD concentrations in the effluent were 23–134 mg/L in the initial period. The observed low organic removal during initial period was probably caused by slowly biodegradable organic components contained in feed wastewater and its fluctuating characteristics. The concentrations of BOD in the effluent from the photo-bioreactor gradually increased when the influent organic concentration increased in the middle period (day 211–323). In this period, BOD concentrations in the effluent were 8–277 mg/L with average BOD removal efficiency of 87%.
In R2, lighted with tungsten lamps and filter, the treatment performance during the initial period (day 0–100) in terms of BOD concentration also fluctuated as 54–285 mg/L. As observed in R1, low organic removal in the initial stage was probably caused by slowly biodegradable organic components contained in feed wastewater and its fluctuating characteristics. The organic concentration in the effluent gradually increased when the influent organic concentration increased in the middle period. Then, the organic removal efficiencies were improved during stable afterwards (day 211–323). In this period, BOD concentrations in the effluent were 240–630 mg/L with average BOD removal efficiency of 76%.
3.2. Biomass Production and Characteristics
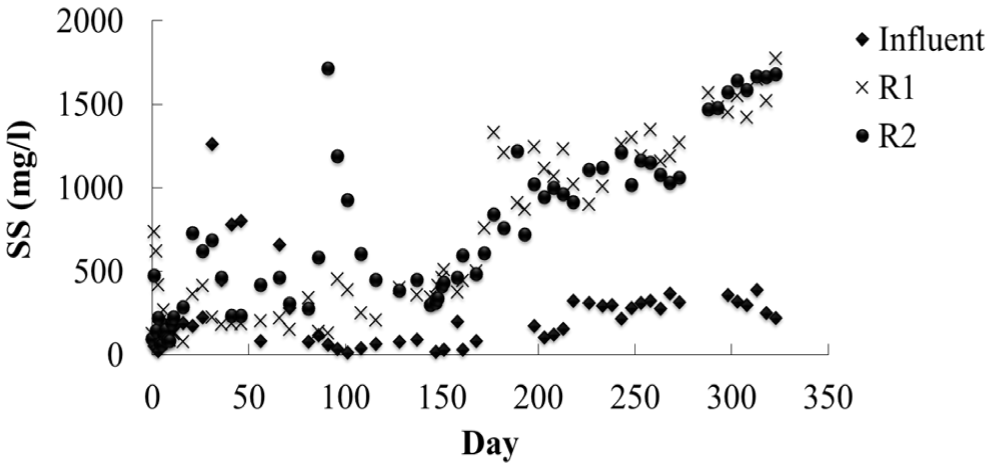
It was found that the biomass development was relatively slower during the initial period of operation, corresponding to lower organic removals during the same period (Fig. 4). From day 150, biomass in both photo-bioreactors increased at a faster rate to the end of operation. In stable period (day 211–326), the biomass concentrations in photo-bioreactor R1 (infrared LEDs) were between 900–1,775 mg/L. Meanwhile, concentrations of biomass in photo-bioreactor R2 (tungsten lamps) were between 915–1,678 mg/L in the stable period. There was no statistically significant difference in the biomass concentrations between the two photo-bioreactors of R1 and R2. Even though scaling up of the photo-bioreactor, SS concentrations were comparable to previous studies, in which surface volume ratio of the photo-bioreactor was 3.6 times larger [8]. During the operation, the loss of solids with the permeate were kept relatively low except during day 20–60 of operation in R1 when there was accidental loss due to leakage of the ceramic membrane filtration unit. It was found that VSS/SS of produced biomass was between 0.8–0.9 and there was no significant accumulation of inorganic substances in the photo-bioreactor over the experimental period.
There was no statistically significant difference in average protein contents in R1 and R2, which were 0.65 and 0.68, respectively (Table 2). However, the pigment content of biomass, in terms of bchl.a and carotenoids, in R2 was found to be statistically significantly higher than R1 (Table 2). Average contents of proteins and bchl.a were higher than Chitapornpan et al. [8], which cultivated photosynthetic biomass in an 8-liter photo-bioreactor illuminated with tungsten lamps through infrared transmitting filter. bchl.a contents were reported to decrease when high intensity of light is illuminated because it stimulated photodegradation of pigments [9–11]. Higher bchl.a contents in this study suggested that available light became less by scaling up of the photo-bioreactor. However, decreased of available light by scaling up did not resulted in decrease of SS concentration in the photo-bioreactor, probably because higher bchl.a contents improved light collection efficiency by PNSB.
3.3. Effect of Light Sources
Higher organic removal efficiency in R1 than in R2 was possibly due to more efficient emission of waveband available by PNSB with infrared LEDs than tungsten lamps. It is known that photopigment contents become larger in darker condition [9–11]. Higher contents of bchl.a and carotenoids in R2 also supports that available light energy was lower in R2. The main absorbance peak of chromatophores of PNSB which has P870 photosynthesis reaction center, ex. Rhodobacter sphaeroides, is 850–900 nm [12]. Of total irradiance from filtered tungsten lamps, emission from 850–900 nm of wave-band was only 14% (Fig. 2). This means that only 2.4 W/m2 of irradiance could be utilized by PNSB. Meanwhile, 79% of energy emitted from infrared LED was in waveband available for PNSB, which corresponded to 11.9 W/m2. Consequently, R1 with infrared LEDs had higher organic removal efficiency and lower bchl.a contents than R2 with filtered tungsten lamps. Higher carotenoids contents in R2 also imply that more carotenoids were synthesized in R2 to enhance absorption waveband to collect light energy that cannot be absorbed with P870 photosynthetic reaction center.
In this study, electric energy supplied to infrared LEDs was 41% of energy supplied to tungsten lamps. Use of infrared LEDs had 12 times higher efficiency because available light energy emitted from infrared LEDs was 4.9 times larger than tungsten lamps. When tungsten lamps are applied as a light source in anaerobic photo-bioreactor process, ultraviolet ray and visible light should be filtered to prevent growth of microalgae which often compete PNSB in non-axenic culture condition [4, 5]. In addition to lower photon emission efficiency of a tungsten lamp than an LED, 55% of total irradiance was lost by filtering of emitted light. Moreover, wavelength specifity is also important. As described above, only 12% of irradiance from filtered tungsten lamps was available by chromatophores of PNSB which has P870 photosynthetic reaction center, while 79% was in available waveband in case of infrared LEDs. It is reported that visible-light LED could promote higher growth of purple non-sulfur bacteria per applied energy in previous research [13]. The results of this study suggest that application of infrared LEDs would be more efficient than visible-light LED.
4. Conclusions
The growth of photosynthetic biomass from food processing wastewater was studied by illuminating the photo-bioreactor with infrared LEDs (R1) and tungsten lamps with infrared transmitting filter (R2) as light sources. In long-term operation of 323 days, organic removals in R1 (91%–95%) was high than those in R2 (79%–83%). Light supply efficiency of infrared LEDs was suggested to be higher for cultivation of PNSB. Even in a bench-scale photo-bioreactor with 8.7 m−1 of SVR, biomass concentration was comparable to small-scale photo-bioreactor with 31 m−1 of SVR, probably due to improvement of light supply efficiency. Application of infrared LEDs could achieve higher treatment performance with advantages in energy efficiency and wavelength specifity.


