| Home | E-Submission | Sitemap | Contact Us |  
Environ Eng Res > Volume 29(3); 2024 > Article
Kim, Sim, Cha, and Oh: Development of a simultaneous multi component analytical method for 37 new psychoactive substances in wastewater using LC MS/MS

Abstract

A simultaneous multi–component analytical method for 37 New psychoactive substances (NPS) in wastewater using LC–MS/MS was developed in this study. Cartridge and solvent tests were conducted to establish the optimal method taking into consideration the polarity and acid–base characteristics of widely distributed NPS. The most efficient pretreatment method was to use HLB cartridge with 2% Formic acid in methanol elution solvent. The developed analytical method was validated by evaluating its specificity, linearity, accuracy, precision (intra and inter), and robustness. The r2 of calibration curves ranged from 0.9969 to 0.9999, ensuring linearity within the concentration range of 0.5–100 ng/mL. The accuracy for 37 compounds ranged from 72.2 to 114.7%, with an intra–day precision ranging from 0.45 to 11.63% and an inter–day precision ranging from 0.96 to 17.99%. The MDL was in the range of 0.01–2.91 ng/L and the LOQ was 0.03–9.71 ng/L. Robustness was evaluated to test the stability of the final solutions, and all compounds were assessed over 36 h and 30 days. The developed analytical method was applied to wastewater samples collected from six Korean WWTPs, and five compounds were detected.

Graphical Abstract

1. Introduction

New psychoactive substances (NPS) are persistently being synthesized, modified, and introduced into the market to produce hallucinogenic and arousal effects that are comparable to, or even surpass those of previously used drugs such as methamphetamine and cocaine [1]. They are called “legal highs” or “research chemicals” to circumvent existing drug regulations, they are rapidly spreading through the Internet, becoming a severe social problem [2]. In 2022, more than 1100 NPS from 136 countries were reported to the United Nations Office on Drugs and Crime (UNODC), and 400 new NPS are introduced to the European market each year, according to the European Monitoring Centre for Drugs and Drug Addiction (EMCDDA) [3,4]. A recent study investing NPS in wastewater treatment plants (WWTPs) across 10 countries reported the detection of 11 NPS. Notably, Methcathinone, one of the NPS, was detected in a Korean WWTP [5].
Since wastewater consists of human excrement and various substances used in daily life, the analysis of wastewater can provide insights into the consumption of NPS. Many studies have been conducted to assess illicit drug consumption through wastewater analysis [69]. Previous studies have primarily focused on the analysis and monitoring of classical drugs such as amphetamine, cocaine, opioids, and cannabinoids, using Solid–Phase Extraction (SPE) methods with Mixed–Mode Cation–eXchange (MCX) and Hydrophilic–Lipophilic Balance (HLB) cartridges from wastewater [1013]. However, with the emergence of NPS, there is a need for an analysis method capable of simultaneously detecting and analyzing a wide range of substances, including both classical drugs and NPS. Recently, a method of analyzing diverse classes of illicit drugs at once using multi–layer cartridges was suggested, employing suspect and non–target screening analysis methods with high–resolution mass spectrometry (HRMS). However, it is challenging to obtain high accuracy and precision for all compounds [14,15]. It is necessary to develop a multi–component analysis method that achieves high accuracy and precision for a wide range of illicit drugs including NPS. SPE methods using MCX and HLB cartridges are frequently used in analyzing illicit drugs in wastewater, specifically for identifying amphetamine and cocaine classes. To develop an effective multi–component analysis method, various SPE cartridges and elution solvents considering polarity and acid–base properties according to the type of compound are required [16].
Therefore, this study aimed to develop an extended analytical method that includes NPS such as synthetic cathinone in addition to the existing cocaine and amphetamine classes.

2. Materials and Methods

2.1. Chemicals and Reagents

Target compounds were 25C–NBOMe, 25D–NBOMe, 25E–NBOMe, amphetamine, dimethoxymethamphetamine (DMMA), methyl diethanolamine (MDEA), 3,4–methylenedioxymethamphetamine (MDMA), methamphetamine, N–Methyl–2–aminoindane (N–methyl–2–AI), p–methoxyamphetamine (PMA), p–methoxy–N–methylamphetamine (PMMA), cocaine, benzoylecgonine (BE), co-caethylene, norcocaine, ketamine, norketamine, lysergic acid diethylamide (LSD), 2–oxo–3–hydroxy–LSD, mescaline, cathinone, 3,4–methylenedioxypyrovalerone (MDPV), 4–fluoromethcathinone (flephedrone), buphedrone, butylone, ethylone, mephedrone, methcathinone, methedrone, methylone, pentedrone, butyrfentanyl, fentanyl, furanylfentanyl, valerylfentanyl, methadone, and EDDP. Of the 37 target compounds, 32 NPS were purchased from Cerilliant (Texas, USA), 5 NPS (25D–NBOMe, 25E–NBOMe, DMMA, PMMA, and N–methyl–2–AI) received from the Ministry of Food and Drug Safety (MFDS) of Korea. The internal standards included 25C–NBOMe–d3, amphetamine–d6, BE–d8, butylone–d3, cathinone–d5, cocaethylene–d8, cocaine–d3, EDDP–d3, ephedrine–d3, ethylone–d5, fentanyl–d5, ketamine–d4, LSD–d3, MDMA–d5, mephedrone–d3, methadone–d3, methamphetamine–d8, norcocaine–d3, and norketamine–d4. All the internal standards were purchased from Cerilliant (Texas, USA). High–performance liquid chromatography (HPLC) grade solvents (methanol (MeOH), acetonitrile, ethyl acetate, water) were purchased from Fisher Scientific (CA, USA). Formic acid (99.9%) and ammonia hydroxide (NH4OH; 28–30%) were obtained from Wako (Osaka, Japan) and Junsei (Tokyo, Japan). Oasis MCX (200 mg, 6 cm3) and Oasis HLB (200 mg, 6 cm3) cartridges were purchased from Waters (MA, USA). Multi–layer cartridge was prepared by mixing three mixtures of Isolute ENV+ (150 mg; Biotage, UK), Strata X–AW, and Strata X–CW (each 100 mg; Phenomenex, USA) as the bottom layer and Oasis HLB (200 mg, Waters, USA) as the top layer.

2.2. Sample Collection

The influent wastewater samples were collected from six WWTPs at a rate of 100 mL/h over a 24–h period using a composite sampler (WS700; Global Water, CA, USA) from April 3 to 4, 2023. The collected samples were stored in brown glass bottles, transported to the laboratory in an ice box, and kept in a refrigerator at temperatures below −20°C.

2.3. Sample Pretreatment

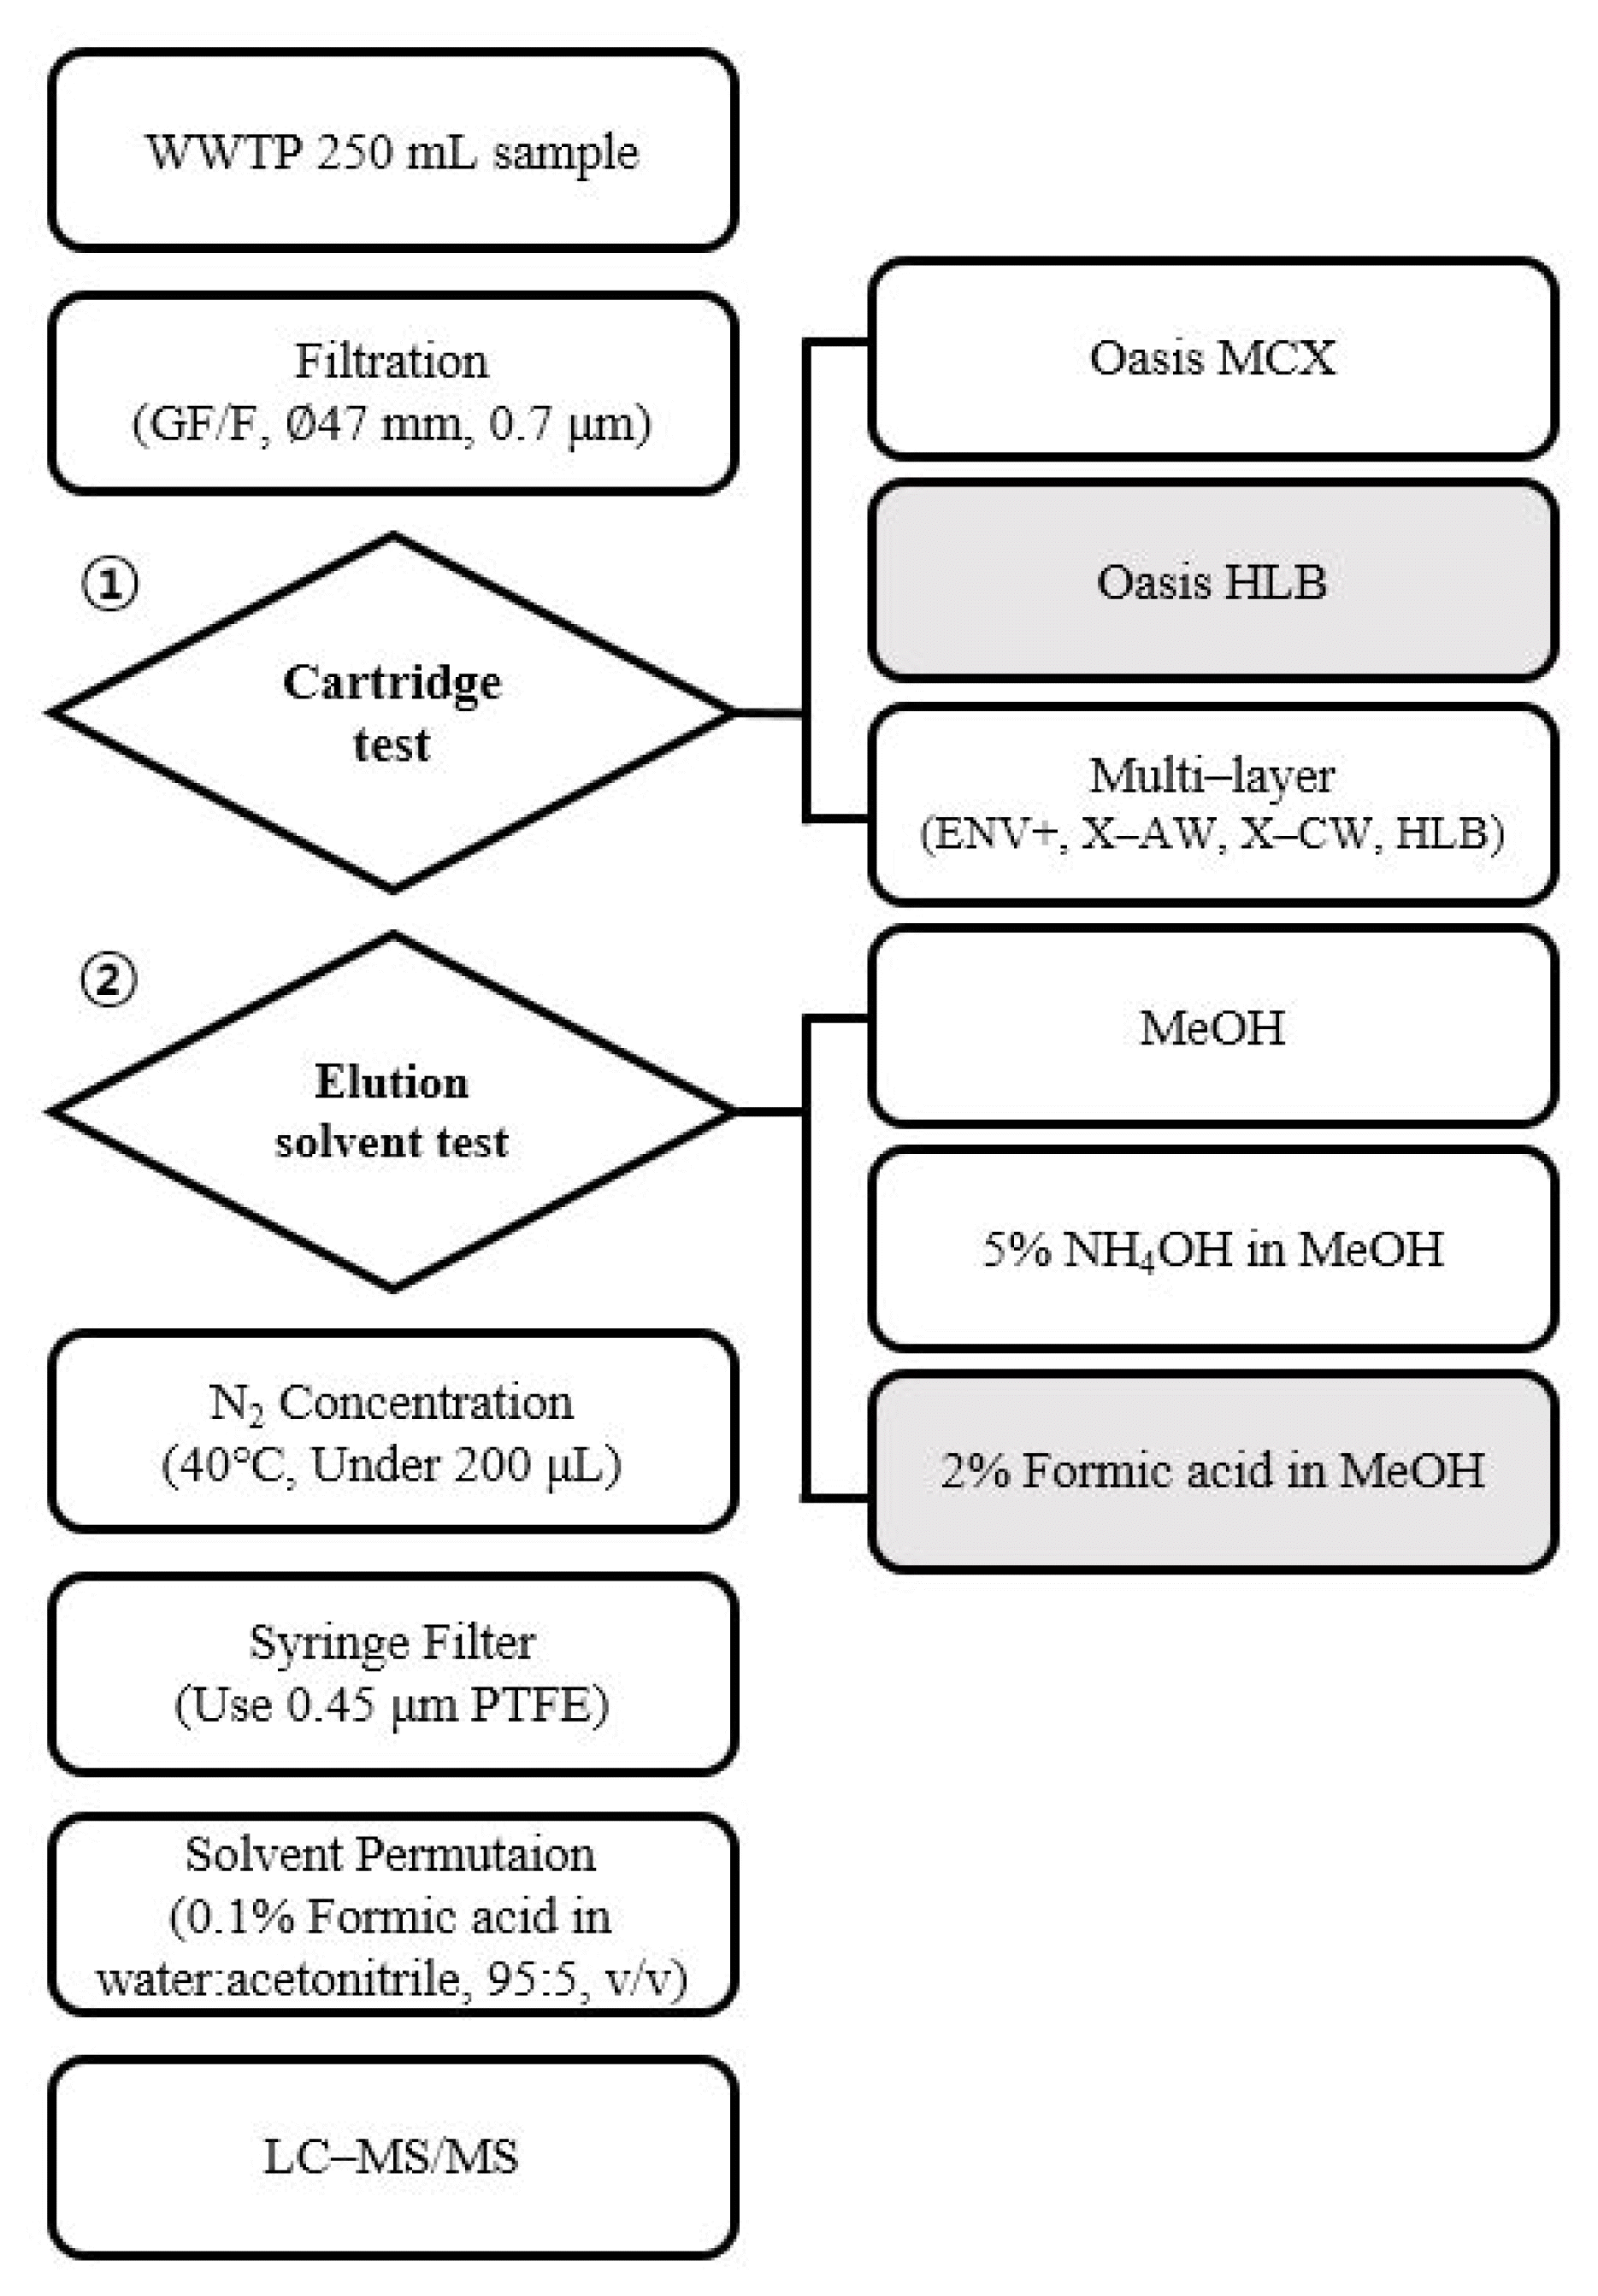
Before extraction, the wastewater samples were filtered with a glass microfiber filter (GF/F) (47 mm; Whatman, Maidstone, UK) and fortified with 19 internal standards (80 ng/L). To optimize the pretreatment method, extraction methods using various cartridges and elution solvents were tested, drawing on the previous studies. The cartridge test was performed using MCX, HLB, and multi–layer cartridges, following the procedures described in earlier research [9,8,14]. Due to the diverse properties of the target compounds, the elution solvent test was conducted using three different solvents: MeOH (for universal application), 5% NH4OH in MeOH (for acidic compounds), and 2% formic acid in MeOH (for basic compounds). The tested experimental methods are summarized in Fig. 1.

2.4. Instrumental Analysis

The target compounds were analyzed using an Agilent 1200 HPLC system coupled with a 6460 triple quadrupole mass spectrometer (Agilent Technologies, Santa Clara, CA, USA). Chromatographic separation was achieved by using a ZORBAX Eclipse XDB–C18 column (4.6 mm i.d × 150 mm, 3.5 μm particle size; Agilent Technologies) with a guard column (ZORBAX Eclipse XDB–C18; 4.6 mm i.d × 5 mm, 1.8 μm particle size; Agilent Technologies). The mobile phases used were 0.1% formic acid in acetonitrile:water (95:5, v/v) (A) and 0.1% formic acid in acetonitrile:water (1:99, v/v) (B). The system settings included a flow rate of 0.5 mL/min, a column oven temperature of 35°C, and an injection volume of 10 μL. For effective separation, gradient elution was performed, and the gradient of (B) was as follows: 0–5 min, 95%, 5–10 min, 70%, 10–20 min, 30%, 20–23 min, 95%, 23–30 min, 95%. The pressure was stabilized by giving 3 minutes post time until the next sample analysis. The total run time was 33 minutes. Electrospray ionization (ESI) was conducted in the positive mode, with the ESI parameters set as follows: capillary voltage at 4,000 V; gas flow at 8 L/min; sheath gas flow at 12 L/min; and nebulizer pressure at 40 psi.

2.5. Method Validation

The developed method was validated with a focusing on specificity, linearity, accuracy, precision, method detection limit (MDL), limit of quantification (LOQ), and robustness. Quantification of all target compounds was conducted using the isotope dilution method. Specificity was evaluated by presenting individual chromatograms for the analytes in the wastewater. Linearity was assessed through a correlation coefficient (r2) using at least five concentrations of calibration standards. MDL and LOQ were determined based on signal–to–noise ratios of 3:1 and 10:1, respectively. Intra–day precision was determined through repeated experiments performed on the same day, while inter–day precision was assessed based on the results of the intra–day precision tests repeated over 2 days. Robustness was evaluated by testing the stability of the final solution. This was done by examining the rate of recovery change by the hour (Initial, 12 h, 24 h, and 36 h) and by the day (Initial, 7 days, and 30 days). The vials for the hourly test were left at room temperature, while the vials for the daily test were stored in a dark room at −20°C.

3. Results and Discussion

3.1. Instrument Condition

The instrument conditions for the analysis were formulated based on parameters from previous studies [8,9]. A standard 1 ng/mL solution was prepared for each compound to set the analytical conditions. The MS/MS instrument was operated in the multiple reaction monitoring (MRM) mode, and precursor ions were identified through MS 1 scan mode. Product ions were selected for their abundance after optimizing the collision energy and were used as quantitative and qualitative ions. The MRM conditions were cross–verified with mzCloud, a mass spectrum library provided by Thermo Fisher Scientific. For quantification purposes, isotope–labeled internal standards were used for each substance. If corresponding internal standards were unavailable, substances with retention times close to the target compounds were used as matches. The fully optimized MRM condition can be found in the supplementary materials (Tables S1 and S2).

3.2. Development of Pre–Treatment Method

Given the diversity in polarity and acid–base properties among various compound classes, comprehensive sample extraction necessitates extensive testing of SPE cartridges and elution solvents [16]. As detailed in section 2.3, tests were carried out three times with 20 ng/L spiked wastewater samples to determine optimal conditions for SPE. The target average recovery rates were set within the 70–120% range.

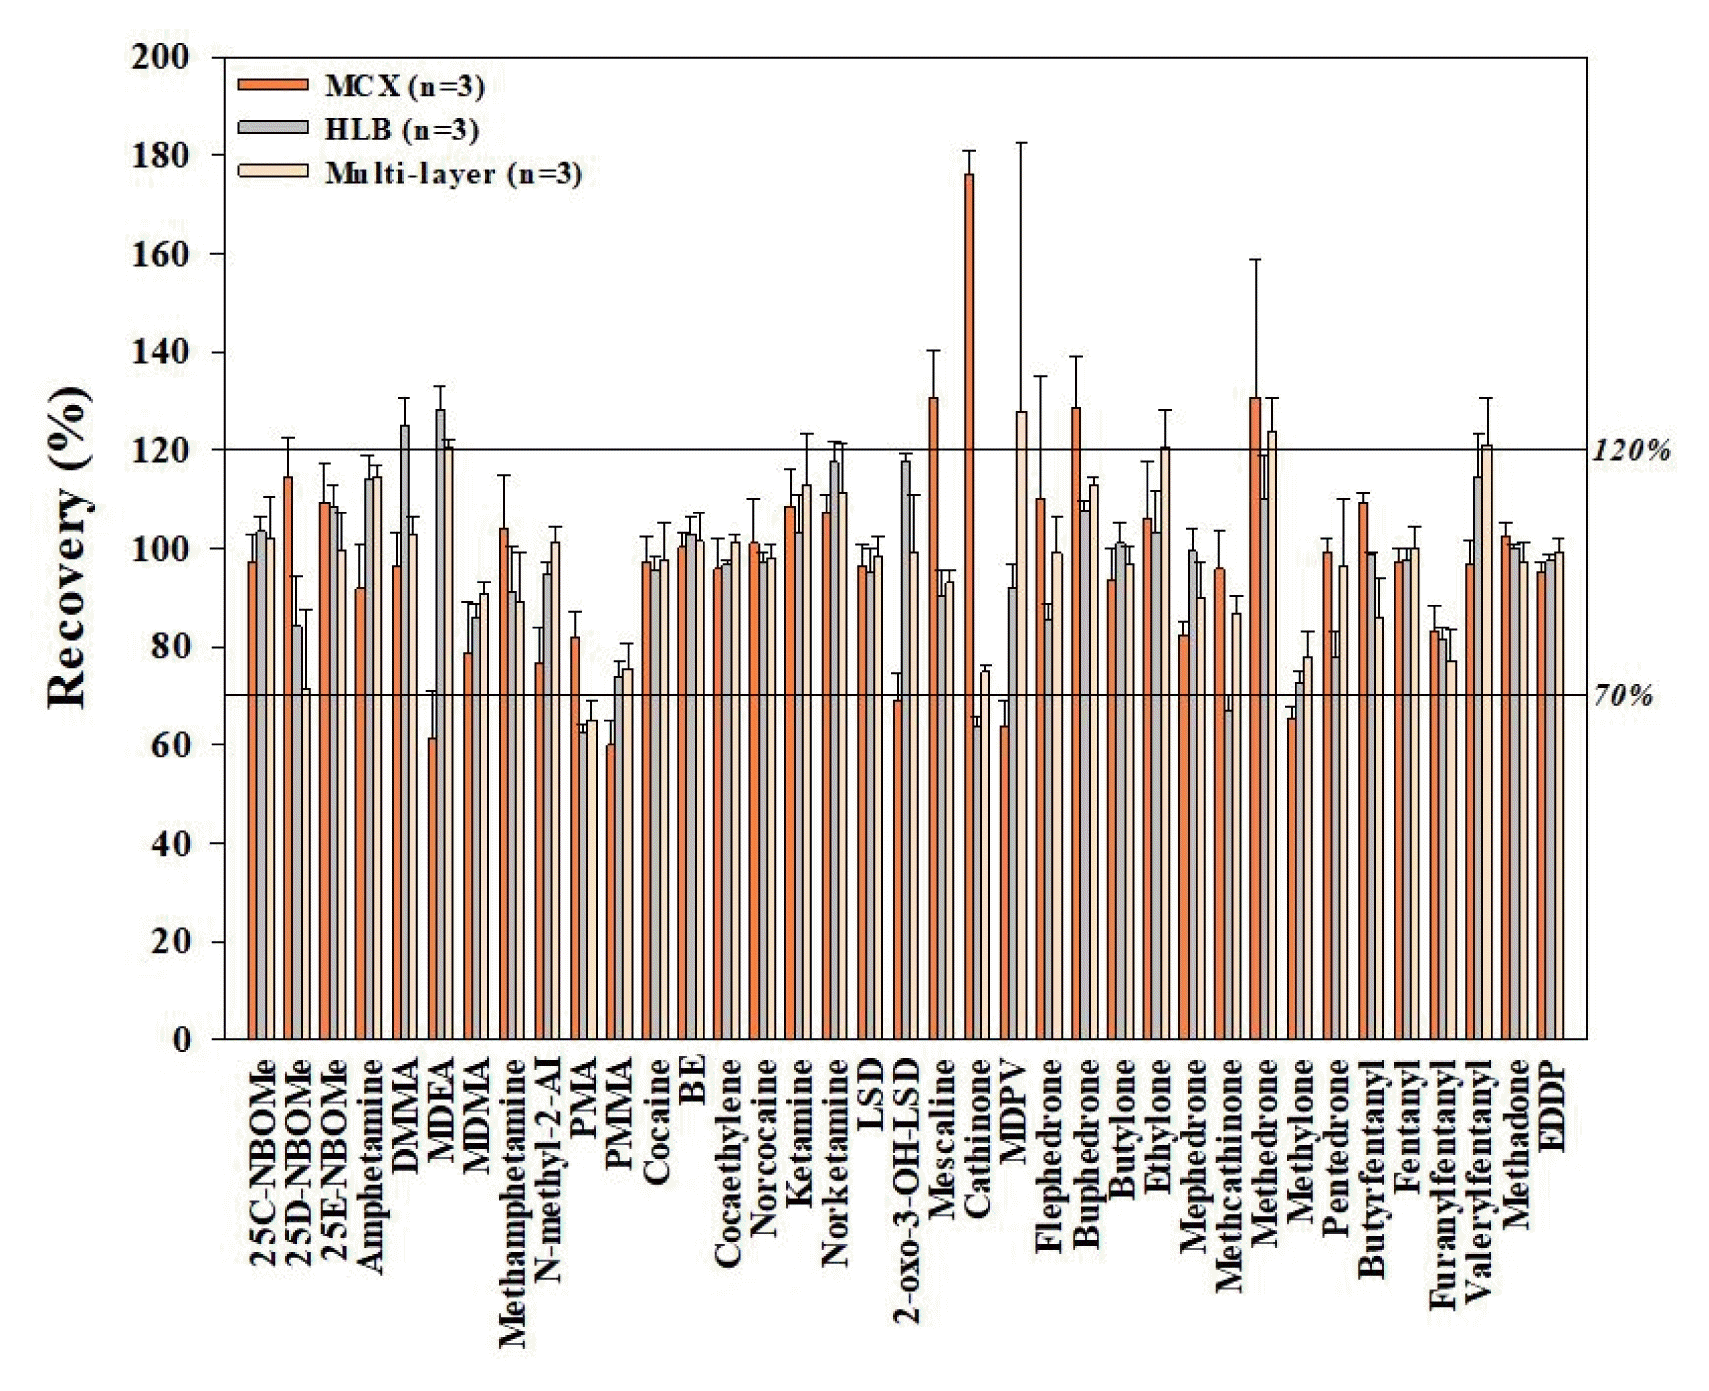
3.2.1. Cartridge test

Based on previous studies, the cartridge test was carried out using MCX, HLB, and multi–layer cartridges [9,8,14]. As elution solvents for each cartridge, 2% NH4OH in MeOH for MCX cartridge [9], MeOH for HLB cartridge [8], and 0.5% NH4OH in MeOH : ethyl acetate, 1.7% formic acid in MeOH: ethyl acetate, and MeOH for multi–layer cartridge [14] were used.
Details of the cartridge test results are provided in Fig. 2. The MCX cartridge test yielded average recovery rates and standard deviation (SD) values of 59.9–176.2% and 1.6–28.2%, respectively, with nine compounds falling outside the target recovery rate range (including MDEA, PMMA, 2–oxo–3–OH–LSD, mescaline, cathinone, MDPV, buphedrone, methedrone, and methylone). In the HLB cartridge test, the average recovery rates and SD values were 62.4–128.1% and 0.4–10.3%, respectively, and five compounds did not meet the target recovery rate range (including DMMA, MDEA, PMA, cathinone, and methcathinone). The multi–layer cartridge test produced average recovery rates and SD values of 65.0–127.9% and 1.5–54.6%, respectively, and five compounds did not meet the target recovery rate range (including MDEA, PMA, MDPV, ethylone, and valerylfentanyl). Both the HLB and multi–layer cartridges had the smallest number of compounds outside the target average recovery rate range (70–120%). Specifically, in HLB, the recovery rate of 2 compounds (DMMA and MDEA) was >120%, while the recovery rate of 3 compounds (PMA, cathinone, and methcathinone) was <70%. In multi–layer, the recovery rate of 4 compounds (MDEA, MDPV, ethylone, and valerylfentanyl) was >120%, while the recovery rate of PMA was <70%. However, the HLB cartridge was chosen as the final cartridge for the study due to its relatively low SD and ease of analysis.

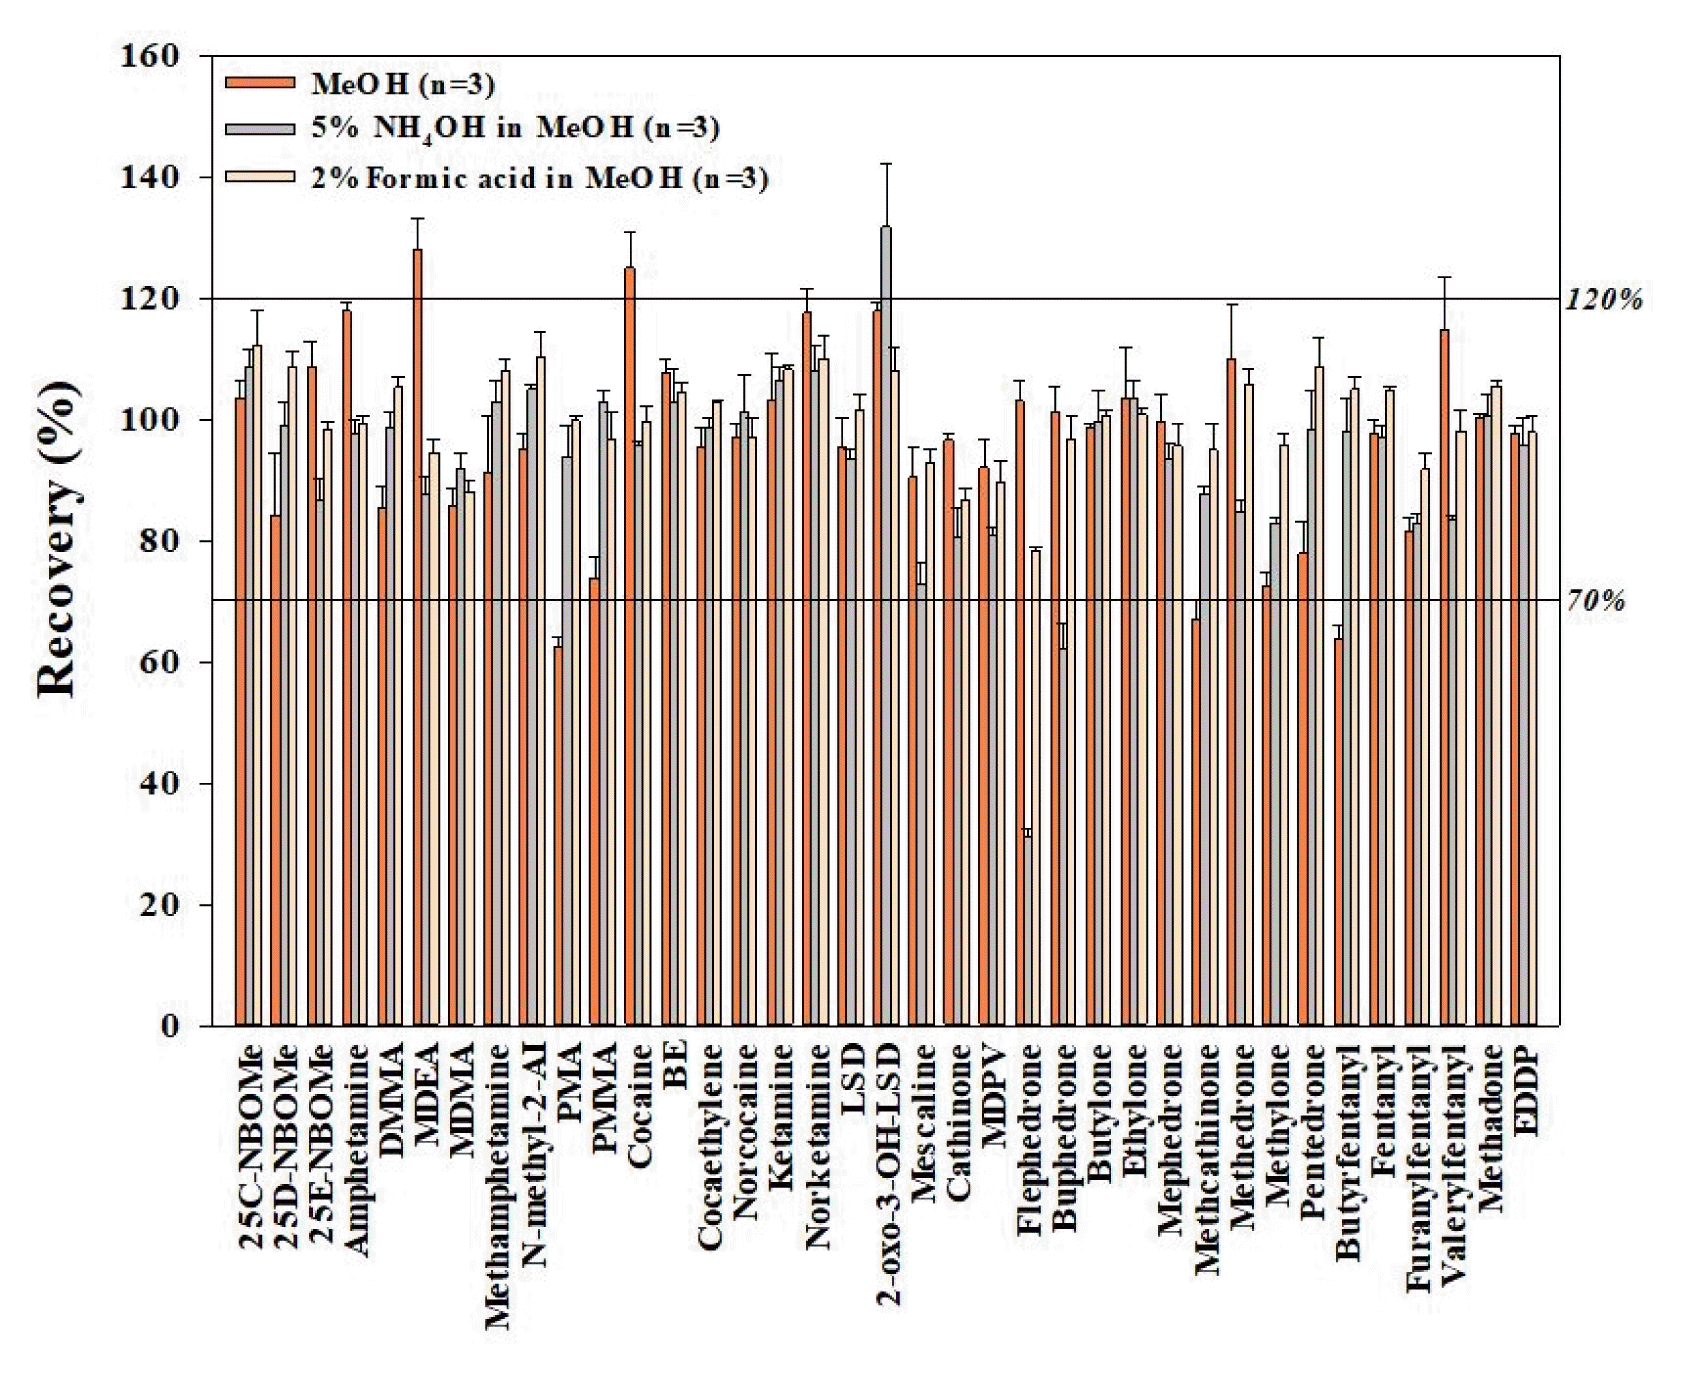
3.2.2. Elution solvent test

As a result of the cartridge test, the elution solvent test was carried out, taking into consideration the acid and base characteristics of the material, to satisfy the recovery rates of all compounds in the selected HLB cartridge. An elution solvent test was conducted using MeOH, 5% NH4OH in MeOH, and 2% formic acid in MeOH based on the typical HLB cartridge method [17]. Details of elution solvent test results are shown in Fig. 3. The average recovery rates spanned from 62.4–128.1% in the test using MeOH. For PMA, cathinone, and methcathinone the average recovery rates were less than <70%, while DMMA and MDEA had the average recovery rates of >120%. The other 32 compounds met the target recovery rate range (70–120%). In the test using 5% NH4OH in MeOH, the average recovery rates of spiked compounds ranged from 31.1–131.7% (three compounds outside the target range: flephedrone, buphedrone, and 2–oxo–3–OH–LSD). In the test using 2% formic acid in MeOH, all compounds achieved average recovery rates (78.2–112.2%) within the target range. Therefore, the final elution solvent was selected as 2% formic acid in MeOH.

3.3. Validation of Developed Analytical Method

Method validation was conducted using the optimized pretreatment method described earlier. Details of method validation results are shown in Table 13. Specificity was confirmed through the separation of individual compound peaks in the wastewater sample (Fig. S1–S6 in the supplementary materials). Representative chromatograms ensured the separation of each compound, and no interference peaks were observed. Linearity was assessed by the correlation coefficients (r2) of calibration curves (levels: 0.5, 1, 2, 5, 10, 20, 50, and 100 ng/mL; weight: 1/x). The r2 values for all 37 compounds ranged from 0.9969–0.9999, showing satisfactory linearity (>0.99) for all compounds. Accuracy and precision were tested using spiked samples prepared at three concentrations (low: 20 ng/L; mid: 80 ng/L; high: 200 ng/L), repeated three times. The average recovery rates were 78.1–112.2%, 72.2–114.1%, and 82.4–114.7% at low, mid, and high concentrations, respectively. These results satisfied the target accuracy range (70–120%) and show improvement over previous studies accuracy (49–127%) of NPS [18]. Intra–day precision ranged from 0.45–5.05%, 1.39–10.80%, and 0.74–11.63% at low, mid, and high concentrations, while Inter–day precision ranged from 0.96–16.46%, 2.04–17.44%, and 1.52–17.99%, at low, mid, and high concentrations, respectively. All 37 compounds obtained satisfactory precision in the three concentrations (<20%). The MDLs and LOQs for 37 compounds were 0.01–2.91 ng/L and 0.03–9.71 ng/L, respectively. Valerylfentanyl showed the lowest MDL and LOQ, while cathinone had the highest values. Similar LODs and LOQs of NPS were 0.02–4.50 and 0.06–7.80 ng/L, respectively found in other NPS studies [18]. Robustness was evaluated using three samples with low spiking concentration (20 ng/L). The average recovery rate was 75.1–108.6%, 76.1–112.3%, 74.1–111.5%, and 72.4–107.8% at the 0 h, 12 h, 24 h, and 36 h, respectively, showing satisfactory results of all compounds for 36 h at room temperature. The average recovery rates were 76.8–111.4%, 73.5–118.0%, and 52.4–160.8% at the 0, 7, and 30 days, respectively. All 37 compounds satisfied the recovery rates until 7 days when stored at –20°C: however, 25E–NBOMe, mescaline, flephedrone, methedrone, methylone, and furanylfentanyl did not meet target range (70–120%) at 30 days. The robustness test indicated that the final solution was stable for 36 hours at room temperature and up to 7 days when stored in the dark at −20°C.

3.4. Analysis of NPS in Real Wastewater Samples

The analysis of NPS in wastewater collected from six WWTPs was conducted using the analytical method developed in this study. Among the 37 target chemicals, five substances (amphetamine, MDMA, methamphetamine, cathinone, and methcathinone) were detected in the wastewater samples (Table 4). The detected concentrations of amphetamine ranged from 1.90 to 5.17 ng/L with a detection frequency of 80%, MDMA was detected only at one sample (3.23 ng/L). In comparison, the concentrations of methamphetamine ranged from 10.92 to 44.60 ng/L with a detection frequency of 100%. Compared to previous studies in Italy and Spain, the levels of amphetamine and MDMA were relatively low in this study, whereas methamphetamine showed similar or slightly high concentrations [19,20]. The concentrations of amphetamine and methamphetamine were similar to those of a previous study in Korea, but MDMA was not detected in that study [8]. Cathinone was detected in four sites, with concentrations ranging from below the <LOQ to 13.33 ng/L. Methcathinone levels ranged from 5.89 to 13.99 ng/L in five sites. The concentrations of methcathinone were similar to or lower than those reported in the USA [21]. Additionally, methcathinone was detected in Korea WWTPs between 2020 and 2021 [5].

4. Conclusions

A simultaneous multi–component analytical method for 37 NPS in wastewater was developed using LC–MS/MS by varying the cartridges and elution solvents. The most optimized pretreatment conditions involved the use of an HLB cartridge and 2% formic acid in MeOH. The analytical method for NPS was validated using criteria such as specificity, linearity, accuracy, precision (intra and inter), MDL, LOQ, and robustness. Specificity (with no interferences), linearity (r2: >0.99), accuracy (70–120%), and precision (<20%) were satisfactory. The MDLs and LOQs of NPS were 0.01–2.91 ng/L and 0.03–9.71 ng/L, respectively, showing similar results to other studies. In the robustness test, all compounds were stable at room temperature for 36 hours and at −20°C for 7 days. The results of this study can be utilized to simultaneously analyze NPS in wastewater, addressing a lack of research in this area worldwide. Additionally, the method can be applied to wastewater to monitor and respond to the illegal use of NPS.

Supplementary Information

Acknowledgements

This work was supported by a grant from the Ministry of Food and Drug Safety (MFDS) of the Republic of Korea in 2022 and Basic Science Research Program grant through the National Research Foundation of Korea (NRF) funded by the Ministry of Education (NRF–2021R1A6A1A03039572; NRF–2021R1A2C2006517).

Notes

Conflict-of-Interest Statement

The authors declare that they have no conflict of interest.

Author Contributions

U.K. (M.Sc. student) performed all experiments and investigations, visualized for and wrote the manuscript. W.S. (Researcher) and H.C. (Professor) validated and peer-reviewed the manuscript. J.E.O. (Professor) obtained the funding for this work, supervised and edited the manuscript.

References

1. Gent L, Paul R. The detection of new psychoactive substances in wastewater. A comprehensive review of analytical approaches and global trends. Sci. Total Environ. 2021;776:146028. https://doi.org/10.1016/j.scitotenv.2021.146028
crossref

2. Chung H, Lee J, Kim E. Trends of novel psychoactive substances (NPSs) and their fatal cases. Forensic Toxicol. 2016;34:1–11. https://doi.org/10.1007/s11419-015-0286-5
crossref

3. UNODC. Data from the UNODC EWA [Internet]. U. N. Off. Drugs Crime; 2022. [cited 2023 May 11]. Available from: http://www.unodc.org/unodc/en/scientists/ewa/data.html


4. EMCDDA. European drug report 2021: trends and developments [Internet]. LU: Publications Office; 2021. [cited 2023 May 11]. Available from: https://data.europa.eu/doi/10.2810/18539


5. Bade R, White J, Ghetia M, et al. A Taste for New Psychoactive Substances: Wastewater Analysis Study of 10 Countries. Environ. Sci. Technol. Lett. 2021;9:57–63. https://doi.org/10.1021/acs.estlett.1c00807
crossref

6. Shchegol’kova N, Rybka K, Kozlova M, Kharitonov S. Analysis of the Chemistry of Municipal Wastewaters for Forecasting the Conditions of Urban Population. Water Resour. 2023;50:317–329. https://doi.org/10.1134/S0097807823020148
crossref pmc

7. Zuccato E, Chiabrando C, Castiglioni S, et al. Cocaine in surface waters: a new evidence-based tool to monitor community drug abuse. Environ. Health. 2005;4:14. https://doi.org/10.1186/1476-069X-4-14
crossref pmid pmc

8. Kim K, Oh J. Evaluation of pharmaceutical abuse and illicit drug use in South Korea by wastewater-based epidemiology. J. Hazard. Mater. 2020;396:122622. https://doi.org/10.1016/j.jhazmat.2020.122622
crossref pmid

9. Sim W, Park S, Ha J, Kim D, Oh J. Evaluation of population estimation methods for wastewater-based epidemiology in a metropolitan city. Sci. Total Environ. 2023;857:159154. https://doi.org/10.1016/j.scitotenv.2022.159154
crossref pmid

10. Pedrouzo M, Borrull F, Pocurull E, Marcé R. Drugs of abuse and their metabolites in waste and surface waters by liquid chromatography-tandem mass spectrometry. J. Sep. Sci. 2011;34:1091–1101. https://doi.org/10.1002/jssc.201100043
crossref pmid

11. Vazquez-Roig P, Andreu V, Blasco C, Picó Y. SPE and LC-MS/MS determination of 14 illicit drugs in surface waters from the Natural Park of L’Albufera (València, Spain). Anal. Bioanal Chem. 2010;397:2851–2864. https://doi.org/10.1007/s00216-010-3720-x
crossref pmid

12. González-Mariño I, Quintana J, Rodríguez I, Cela R. Determination of drugs of abuse in water by solid-phase extraction, derivatisation and gas chromatography–ion trap-tandem mass spectrometry. J. Chromatogr. A. 2010;1217:1748–1760. https://doi.org/10.1016/j.chroma.2010.01.046
crossref pmid

13. Bijlsma L, Sancho J, Pitarch E, Ibáñez M, Hernández F. Simultaneous ultra-high-pressure liquid chromatography–tandem mass spectrometry determination of amphetamine and amphetamine-like stimulants, cocaine and its metabolites, and a cannabis metabolite in surface water and urban wastewater. J. Chromatogr. A. 2009;1216:3078–3089. https://doi.org/10.1016/j.chroma.2009.01.067
crossref pmid

14. Lee H, Oh J. Target and suspect screening of (new) psychoactive substances in South Korean wastewater by LC-HRMS. Sci. Total Environ. 2023;875:162613. https://doi.org/10.1016/j.scitotenv.2023.162613
crossref pmid

15. Singer H, Wössner A, McArdell C, Fenner K. Rapid Screening for Exposure to “Non-Target” Pharmaceuticals from Wastewater Effluents by Combining HRMS-Based Suspect Screening and Exposure Modeling. Environ. Sci. Technol. 2016;50:6698–6707. https://doi.org/10.1021/acs.est.5b03332
crossref pmid

16. Vazquez-Roig P, Blasco C, Picó Y. Advances in the analysis of legal and illegal drugs in the aquatic environment. TrAC Trends Anal. Chem. 2013;50:65–77. https://doi.org/10.1016/j.trac.2013.04.008
crossref

17. Waters. HLB Use Manual [Internet]. Oasis HLB Cartridges and 96-Well Plates. [cited 2023 May 16]. Available from: https://www.waters.com/waters/support.htm?lid=10076779&lcid=10076778&type=USRM


18. Salgueiro-González N, Zuccato E, Castiglioni S. Nationwide investigation on the use of new psychoactive substances in Italy through urban wastewater analysis. Sci. Total Environ. 2022;843:156982. https://doi.org/10.1016/j.scitotenv.2022.156982
crossref pmid

19. Castiglioni S, Zuccato E, Crisci E, Chiabrando C, Fanelli R, Bagnati R. Identification and Measurement of Illicit Drugs and Their Metabolites in Urban Wastewater by Liquid Chromatography–Tandem Mass Spectrometry. Anal. Chem. 2006;78:8421–8429. https://doi.org/10.1021/ac061095b
crossref pmid

20. Postigo C, Lopez De Alda M, Barceló D. Fully Automated Determination in the Low Nanogram per Liter Level of Different Classes of Drugs of Abuse in Sewage Water by On-Line Solid-Phase Extraction-Liquid Chromatography–Electrospray-Tandem Mass Spectrometry. Anal. Chem. 2008;80:3123–3134. https://doi.org/10.1021/ac702060j
crossref pmid

21. O’Rourke C, Subedi B. Occurrence and Mass Loading of Synthetic Opioids, Synthetic Cathinones, and Synthetic Cannabinoids in Wastewater Treatment Plants in Four U.S. Communities. Environ. Sci. Technol. 2020;54:6661–6670. https://doi.org/10.1021/acs.est.0c00250
crossref pmid pmc

Fig. 1
Flow diagram of tested method in development of multi component analysis for 37 NPS in wastewater.
/upload/thumbnails/eer-2023-491f1.gif
Fig. 2
Comparison of 37 NPS recoveries in cartridge test (spiking concentration: 20 ng/L).
/upload/thumbnails/eer-2023-491f2.gif
Fig. 3
Comparison of 37 NPS recoveries in elution solvent test (spiking concentration: 20 ng/L).
/upload/thumbnails/eer-2023-491f3.gif
Table 1
Validation results of developed method for 37 NPS in this study; linearity, accuracy, precision, MDL and, LOQ
No Compound name Internal standard Calibration range (ng/mL) r2 Accuracy(%) Precision(%) MDL (ng/L) LOQ (ng/L)

Intra–day Inter–day

Low Mid High Low Mid High Low Mid High
1 25C–NBOMe 25C–NBOMe–d3 0.5–100 0.9994 112.2±5.7 86.3±2.4 95.1±4.5 5.05 2.80 4.73 12.05 8.10 7.15 0.06 0.18
2 25D–NBOMe MDMA–d5 0.5–100 0.9977 108.7±2.4 99.5±7.3 111.6±7.8 2.23 7.34 7.02 6.23 13.02 11.55 0.18 0.60
3 25E–NBOMe 25C–NBOMe–d3 0.5–100 0.9994 98.3±1.2 72.2±3.2 82.4±9.6 1.21 4.36 11.63 11.81 4.33 9.75 0.18 0.61
4 Amphetamine Amphetamine–d6 0.5–100 0.9999 99.1±1.5 110.6±3.9 114.7±2.5 1.50 3.57 2.15 4.12 16.97 10.49 0.25 0.83
5 Dimethoxymethamphetamine (DMMA) Amphetamine–d6 0.5–100 0.9996 105.2±1.9 96.9±4.1 105.6±3.4 1.78 4.27 3.18 11.38 6.08 4.90 0.04 0.14
6 MDEA MDMA–d5 0.5–100 0.9994 94.4±2.2 95.3±4.1 96,2 ±1.4 2.38 4.31 1.49 5.72 3.41 8.07 0.13 0.42
7 MDMA MDMA–d5 0.5–100 0.9996 88±1.9 87.1±4.3 95.5±3.2 2.21 4.88 3.32 4.80 9.62 7.38 0.11 0.35
8 Methamphetamine Methamphetamine–d8 0.5–100 0.9996 108±2 92.5±3.5 95±2.2 1.85 3.78 2.33 5.26 9.01 9.95 0.38 1.28
9 N–methyl–2–AI Amphetamine–d6 0.5–100 0.9996 110.4±4.1 109.2±4.8 113±2.9 3.74 4.41 2.58 3.97 16.99 5.24 0.25 0.82
10 p–Methoxyamphetamine (PMA) Amphetamine–d6 0.5–100 0.9967 99.7±1 102.7±3.6 109.6±3.6 0.97 3.47 3.26 2.05 7.39 7.99 0.22 0.72
11 para–Methoxy–N–methylamphetamine (PMMA) Amphetamine–d6 0.5–100 0.9995 96.6±4.7 84.8±4.5 87.9±1.7 4.87 5.27 1.95 8.48 4.68 5.68 0.18 0.61
12 Cocaine Cocaine–d3 0.5–100 0.9997 99.5±2.6 91.4±3.2 100.2±1.8 2.66 3.53 1.84 4.28 4.91 2.46 0.02 0.05
13 BE BE–d8 0.5–100 0.9989 104.4±1.6 96.4±2.9 108.4±2.6 1.49 2.96 2.37 2.75 16.11 14.49 0.18 0.60
14 Cocaethylene Cocaethylene–d8 0.5–100 0.9995 102.8±0.5 90.1±3.9 97.4±3.1 0.45 4.29 3.21 7.07 4.39 3.59 0.05 0.18
15 Norcocaine Norcocaine–d3 0.5–100 0.9993 96.9±3.3 92.6±3.8 101.9±1.8 3.40 4.06 1.76 4.41 4.68 2.24 0.30 1.00
16 Ketamine Ketamine–d4 0.5–100 0.9994 108.2±0.9 77±5.2 83.2±1.9 0.80 6.76 2.33 1.49 17.31 17.99 0.07 0.23
17 Norketamine Norketamine–d4 0.5–100 0.9996 109.9±3.7 90.5±5.1 107.8±5.6 3.34 5.63 5.23 2.90 10.14 4.46 0.72 2.42
18 LSD LSD–d3 0.5–100 0.9994 101.6±2.6 101.9±3.5 111±2.4 2.53 3.42 2.19 6.61 5.51 5.87 0.15 0.50
19 2–oxo–3–hydroxy–LSD Methamphetamine–d8 0.5–100 0.9987 108±3.9 83.3±2.1 87.6±4.2 3.64 2.50 4.74 3.31 9.58 6.19 0.60 2.00
20 Mescaline Butylone–d3 0.5–100 0.9975 92.8±2.2 83.2±2.7 85.7±2.2 2.34 3.23 2.56 8.48 9.47 6.43 0.22 0.73
21 Cathinone Cathinone–d5 0.5–100 0.9998 86.7±1.8 88.7±4.4 97±3.5 2.09 4.93 3.57 10.72 8.70 7.57 2.91 9.71
22 3,4–Methylenedioxypyrovalerone (MDPV) Methamphetamine–d8 0.5–100 0.9996 89.6±3.6 111.5±4.3 111.1±5.3 4.04 3.84 4.74 5.13 6.74 4.35 0.12 0.41
23 4–Fluoromethcathinone (Flephedrone) Ethylone–d5 0.5–100 0.9988 78.2±0.8 90±9.7 92.2±8 1.07 10.80 8.71 6.15 11.99 6.67 0.10 0.32
24 Buphedrone Amphetamine–d6 0.5–100 0.9993 96.7±4.1 93±6.1 95.4±4.6 4.19 6.58 4.79 3.72 5.61 3.21 0.09 0.31
25 Butylone Butylone–d3 0.5–100 0.9994 100.6±0.9 98.4 ±1.4 106.8±1.6 0.90 1.39 1.50 5.66 5.14 2.80 0.19 0.64
26 Ethylone Ethylone–d5 0.5–100 0.9996 100.7±1.2 81.2±3.2 88.4±5.6 1.15 3.90 6.29 4.42 14.30 12.67 0.28 0.92
27 Mephedrone Mephedrone–d3 0.5–100 0.9994 95.6±3.7 99.9±3.5 106.7±3.1 3.88 3.50 2.95 3.59 4.92 3.43 0.27 0.91
28 Methcathinone Ephedrine–d3 0.5–100 0.9998 94.9 ±4.3 84.9±5.9 91.9±2.3 4.51 6.89 2.45 10.49 7.05 6.83 0.21 0.68
29 Methedrone Mephedrone–d3 0.5–100 0.9970 105.8±2.5 97.7±4.7 105.7±0.8 2.35 4.79 0.74 5.82 4.80 9.11 0.37 1.23
30 Methylone Butylone–d3 0.5–100 0.9990 95.8±1.9 114.1±11 110.5±7.5 1.95 9.68 6.80 3.09 17.44 13.87 0.11 0.37
31 Pentedrone Methamphetamine–d8 0.5–100 0.9992 108.6±4.8 104.3±4.6 110±1.1 4.43 4.40 1.04 15.21 5.56 1.52 0.36 1.21
32 Butyrfentanyl Fentanyl–d5 0.5–100 0.9993 104.9±2 91.2±8.5 105.5±5.1 1.86 9.30 4.79 16.46 11.58 11.83 0.03 0.10
33 Fentanyl Fentanyl–d5 0.5–100 0.9997 104.8±0.8 92.2±2.8 102.3±1.9 0.73 3.07 1.87 0.96 2.04 2.83 0.11 0.37
34 Furanylfentanyl Fentanyl–d5 0.5–100 0.9998 91.7±2.7 100.6±9 113.1±4.3 2.94 8.99 3.85 5.92 16.44 12.48 0.02 0.08
35 Valerylfentanyl LSD–d3 0.5–100 0.9990 98±3.5 81.9±5.1 94.5±8.7 3.61 6.24 9.21 12.50 7.18 8.55 0.01 0.03
36 Methadone Methadone–d3 0.5–100 0.9988 105.4±1 92.5±4 101.1±3.4 0.95 4.31 3.32 6.69 4.52 3.00 0.23 0.76
37 EDDP EDDP–d3 0.5–100 0.9984 97.8±2.8 85±3.6 94.9±3.7 2.89 4.21 3.90 4.07 11.11 10.54 0.08 0.26
Table 2
Validation results of the developed method for 37 NPS in this study; robustness in a short period
No Compound name ΔR (%)
Initial 12 h 24 h 36 h
1 25C–NBOMe 95.2±5.3 1.16 (96.3) 0.33 (95.5) 3.23 (98.4)
2 25D–NBOMe 76.3±3 −0.2 (76.1) −2.13 (74.1) 3.29 (79.6)
3 25E–NBOMe 84±4.1 −4.12 (79.8) −3.32 (80.6) −8.52 (75.4)
4 Amphetamine 84.1±3.4 −6.08 (78) −7.35 (76.7) −6.33 (77.7)
5 Dimethoxymethamphetamine (DMMA) 86.7±4.1 1.86 (88.5) 4.18 (90.8) 2.07 (88.7)
6 MDEA 75.2±6.4 2.56 (77.7) 4.57 (79.7) 6.12 (81.3)
7 MDMA 85.6±7.5 1.49 (87.1) 2.55 (88.1) 4.18 (89.8)
8 Methamphetamine 88.4±1.8 −12.03 (76.3) −6.08 (82.3) −8.7 (79.7)
9 N–methyl–2–AI 82.8±3.7 0.15 (82.9) 2.91 (85.7) 2.17 (84.9)
10 p–Methoxyamphetamine (PMA) 87.8±7.1 1.24 (89) 4.18 (92) −4.67 (83.1)
11 para–Methoxy–N–methylamphetamine (PMMA) 80.7±5.6 5.43 (86.2) 3.25 (84) 2.61 (83.3)
12 Cocaine 90.6±2.5 −0.74 (89.8) −0.91 (89.6) 2.09 (92.7)
13 BE 81.1±2.5 1.08 (82.2) −2.26 (78.8) 0.94 (82)
14 Cocaethylene 94±2.9 −1.28 (92.7) 1.19 (95.2) −2.67 (91.3)
15 Norcocaine 94.9±3.5 0.1 (95) −2.86 (92) −1.01 (93.9)
16 Ketamine 93.5±7.1 −1.32 (92.2) 3.17 (96.7) 6.59 (100.1)
17 Norketamine 103.1±11.3 4.31 (107.4) 3.29 (106.4) 1.19 (104.3)
18 LSD 91±9.7 1.66 (92.6) −0.04 (90.9) 8.54 (99.5)
19 2–oxo–3–hydroxy–LSD 105.3±1.5 −2.66 (102.6) 1.4 (106.7) −5.84 (99.5)
20 Mescaline 98.5±3.7 −1.56 (97) −3.56 (95) −2.24 (96.3)
21 Cathinone 101.1±1.1 −4.25 (96.8) 0.14 (101.2) −2.91 (98.2)
22 3,4–Methylenedioxypyrovalerone (MDPV) 82.7±5.3 −0.18 (82.5) 2.23 (84.9) 3.86 (86.5)
23 4–Fluoromethcathinone (Flephedrone) 82.7±4.2 4.92 (87.6) 5.46 (88.2) 2.15 (84.9)
24 Buphedrone 94.7±5.7 3.45 (98.2) 1.14 (95.9) 0.68 (95.4)
25 Butylone 90.1±0.9 −0.62 (89.4) 4.18 (94.2) 0.94 (91)
26 Ethylone 84.9±5.1 −3.86 (81.1) −4.38 (80.6) −3.55 (81.4)
27 Mephedrone 95±3.1 1.18 (96.2) 0.77 (95.8) −1.02 (94)
28 Methcathinone 81.1±4.9 −1.66 (79.5) 0.87 (82) 0.25 (81.4)
29 Methedrone 95.8±6 −17.4 (78.4) −16.76 (79) −14.81 (81)
30 Methylone 94.7±11.5 6.64 (101.3) 6.89 (101.6) 2.67 (97.4)
31 Pentedrone 91.7±4.8 −5.05 (86.7) −6.81 (84.9) −3.65 (88.1)
32 Butyrfentanyl 108.4±3 3.96 (112.3) 2.17 (110.5) −2.02 (106.4)
33 Fentanyl 94.8±4.7 −6.05 (88.7) 4.67 (99.5) 1.12 (95.9)
34 Furanylfentanyl 108.6±3.6 3.78 (112.3) 2.92 (111.5) −0.77 (107.8)
35 Valerylfentanyl 78.5±5.3 −0.56 (78) −1.97 (76.6) −6.11 (72.4)
36 Methadone 96.3±5.2 1.48 (97.8) 3.24 (99.6) 4.04 (100.4)
37 EDDP 102.4±1.3 −1.71 (100.7) −3.28 (99.1) 0.18 (102.5)
Table 3
Validation results of the developed method for 37 NPS in this study; robustness in a long period
No Compound name ΔR (%)
Initial 7 days 30 days
1 25C–NBOMe 89.8±5.2 −2.52 (87.3) −10.11 (79.7)
2 25D–NBOMe 97.8±1.5 −18.79 (79) 21.84 (119.6)
3 25E–NBOMe 77.6±4.7 −3.68 (73.9) −11.4 (66.2)
4 Amphetamine 104.2±2.7 2.25 (106.5) −10.8 (93.4)
5 Dimethoxymethamphetamine (DMMA) 87.4±1.2 15.81 (103.2) −2.53 (84.8)
6 MDEA 104.5±1.6 −20.02 (84.4) −15.02 (89.4)
7 MDMA 84.7±5.7 4.28 (89) −5.01 (79.7)
8 Methamphetamine 105.7±6.7 12.25 (118) −18.79 (86.9)
9 N–methyl–2–AI 109.6±5.4 7.92 (117.6) −11.47 (98.2)
10 p–Methoxyamphetamine (PMA) 96.7±1 14.2 (110.9) 18.1 (114.8)
11 para–Methoxy–N–methylamphetamine (PMMA) 84.9±1.9 19.29 (104.1) −5.37 (79.5)
12 Cocaine 93.7±2.5 −1.47 (92.3) −5.70 (88.0)
13 BE 107.2±4.8 −9.14 (98.1) −10.43 (96.8)
14 Cocaethylene 92.5±4.1 0.72 (93.2) −3.76 (88.7)
15 Norcocaine 91.2±1.3 0.67 (91.9) −5.31 (85.9)
16 Ketamine 110.3±0.8 −21.93 (88.4) −33.07 (77.3)
17 Norketamine 108.9±3.2 −29.78 (79.2) −12.46 (96.5)
18 LSD 93.6±7.3 −3.66 (89.9) −2.87 (90.7)
19 2–oxo–3–hydroxy–LSD 111.4±13 −2.83 (108.5) −27.1 (84.3)
20 Mescaline 84.1±2.7 2.94 (87.1) −31.77 (52.4)
21 Cathinone 105.7±8.2 0.06 (105.7) −8.05 (97.6)
22 3,4–Methylenedioxypyrovalerone (MDPV) 91.6±4.7 −1.19 (90.4) 14.09 (105.7)
23 4–Fluoromethcathinone (Flephedrone) 83.7±3.9 14.5 (98.2) −20.67 (63)
24 Buphedrone 98.4±2.9 0.35 (98.7) −22.56 (75.8)
25 Butylone 91.1±1.2 −0.33 (90.7) −3.19 (87.9)
26 Ethylone 109.6±0.6 −22.88 (86.7) −30.91 (78.7)
27 Mephedrone 95.4±3.7 −2.36 (93) −6.3 (89.1)
28 Methcathinone 80.5±7 14.16 (94.7) 22.48 (103)
29 Methedrone 100.1±2.3 −26.62 (73.5) −36.56 (63.5)
30 Methylone 89.7±1.6 22.71 (112.4) 71.07 (160.8)
31 Pentedrone 88±6.4 16.99 (105) 15.62 (103.7)
32 Butyrfentanyl 76.8±0.2 11.76 (88.6) 31.31 (108.1)
33 Fentanyl 103.9±2 −23.33 (80.5) −13.92 (89.9)
34 Furanylfentanyl 81.6±3.2 13.81 (95.4) 40.08 (121.7)
35 Valerylfentanyl 82.6±11.3 −3.47 (79.1) −11.28 (71.3)
36 Methadone 92.1±3.5 −3.37 (88.7) −2.01 (90)
37 EDDP 92±2.9 −1.64 (90.3) −11.41 (80.6)
Table 4
The concentration of NPS in wastewater samples
Compound This study (ng/L) Italy1) (ng/L) Spain2) (ng/L) USA3) (ng/L) Korea4) (ng/L)

WWTP–1 WWTP–2 WWTP–3 WWTP–4 WWTP–5 WWTP–6
Amphetamine ND 3.48 2.50 5.17 1.90 2.96 4.1–25.3 6.5–50.2 2.6–6.6
MDMA ND ND ND ND 3.23 ND 0–28.7 47.4–245 ND
Methamphetamine 13.96 44.28 30.57 44.60 27.52 10.92 9.1–23.3 3.0–24.0 20.1–42.5
Cathinone 13.33 <LOQ ND ND 11.81 10.88
Methcathinone 13.99 9.16 5.89 ND 8.36 7.46 11.3–34.3

ND: <MDL

Castiglioni et al., 2006 [19]

Postigo et al, 2008 [20]

O’Rourke and Subedi., 2020 [21]

Kim and Oh., 2020 [8]

Editorial Office
464 Cheongpa-ro, #726, Jung-gu, Seoul 04510, Republic of Korea
FAX : +82-2-383-9654   E-mail : eer@kosenv.or.kr

Copyright© Korean Society of Environmental Engineers.        Developed in M2PI
About |  Browse Articles |  Current Issue |  For Authors and Reviewers