1. Introduction
Various dyes have been widely used in many industries such as textile, tanning, papermaking, food processing, hair dye or ink production [1, 2]. Wastewater from these industries contains many toxic and persistent organic compounds, which not only impair the aesthetics of water sources, but are also detrimental to flora and aquatic animals [1]. Recently, certain dyes have been linked to cancer and neurological diseases and can cause genetic mutations in humans [1–3]. Therefore, research to find a method to properly remove dyes from wastewater sources is mandatory. Currently, various methods have been developed to remove dyes from wastewater, including: chemical oxidation [4], electrochemical treatment [5], advanced oxidation [6], decomposition photocatalytic [7, 8], biodegradation [9], and adsorption method [1–3, 10–12]. In particular, the adsorption technique is considered to be the most effective method for organic pollutants treatment due to its outstanding advantages such as simple design, easy operation and environmental friendliness [1, 3, 10, 13]. Balati et al. reported that graphene oxide-9-aminoanthracene [10] or NH2-SBA-15 organic–inorganic nanohybrid [11] adsorbents are highly effective in removing polycyclic aromatic hydrocarbons such as naphthalene, acenaphthylene and phenanthrene from solvents water translation. Many other organic pollutants such as CR [13], remazol brilliant blue reactive [14], toluene [15], and oxytetracycline [16] can be also easily treated by adsorption technique.
Activated carbon (AC) is the most widely used adsorbent for removing dyes from wastewater due to its large specific surface area, micro-porous nature, and high adsorption capacity [3]. Although AC is currently a preferred adsorbent, its popularity is still limited as it is expensive in many countries, especially in developing countries [13, 14]. Therefore, various attempts have been made to generate AC from inexpensive alternative raw materials yet having comparable adsorption efficiency. Activated carbon can be prepared from any carbonaceous solid precursor that can be natural or synthetic. Due to environmental considerations, agricultural wastes are considered as potential precursors because they are inexpensive, renewable, safe, readily available in large quantities and easily accessible. In addition, they have a high carbon yet low ash content [3]. Many studies have conducted to prepare AC from various agricultural wastes to be effectively used in removing organic color compounds in water such as pomegranate peel [14], almond shell [15], waste tea [16], Ficus carica bast [17], banana trunk [18], wood biomass [19], custard apple [20], apricot stones [21], shrimp shell [22].
Longan, a subtropical fruit tree has been cultivated and distributed to South Asia, extending from Myanmar to southern China, southwest India and Sri Lanka or other regions in the world with subtropical climate. The world production of longan reached more than 2500 million tons in 2010. The main longan producing countries in the world are China, with about 1300 million tons, Vietnam with over 600 million tons and Thailand with over 500 million tons in 2010 [23]. Longan seed accounts for about 17% of the total fresh fruit weight and are often discarded or burned as a waste of up to hundreds of tons per year due to non-comprehensive use. Longan seed, with high content of C, O and H and high abundance and availability, is among potential raw materials to produce AC [24]. The use of this agricultural by-product source for the preparation of activated carbon also contributes to the reduction of pollution caused by this source of waste products.
In the present work, longan seed as a carbon source was used to prepare AC through two-step pyrolysis. Longan seed biomass samples were pre-carbonized at low temperature before being impregnated with H3PO4 solution and then heated for activation at higher temperature to obtain AC. A number of physical and chemical properties as well as the ability to adsorb cation and anion dyes were investigated.
2. Experimental
2.1. Materials
Longan seeds were collected from agro-processing facilities in Dong Thap province – Vietnam and finely ground to a size of about 1–2 mm. They were washed and dried at 100 °C for 24h before use. Ortho-Phosphoric acid (H3PO4, ≥ 85%), sodium hydroxide (NaOH, ≥ 99%), hydrochloric acid (HCl, 37%), sodium chloride (NaCl, ≥ 99.5%) were purchased from Merck. Methylene blue (C16H18N3SCl.xH2O, 99.5%), Rhodamine-B (C28H30N2O3, ≥ 96.5%), Methyl orange (C14H14N3NaO3S, Dye content 85%), Congo red (C32H22N6Na2O6S2, ≥ 97%) were obtained from Sigma - Aldrich. All chemicals were of analytical grade and were used as received without any further purification. Table S1 shows the physicochemical properties and structure of the methylene blue (MB), rhodamine-B (RhB), methyl orange (MO) and congo red (CR) [7, 25–27].
2.2. Synthesis of Longan Seed-Based Activated Carbon
The dry longan seed biomass (LSB) was first transferred to a crucible, covered with a lid and carbonized at 500 °C for 2 hours to obtain biochar (LSC). Next, 10 grams of obtained biochar were impregnated with 100 mL of 15% H3PO4 solution for 12 hours at room temperature. The sample was then dried at 110 °C for 12 hours and transferred to a crucible, covered with a lid, and heated to activate at 800 °C for 4 hours (temperature ramp of 10 °C / min). The product was washed several times with distilled water to natural pH and then dried at 110 °C for 24 hours to obtain longan seed-based activated carbon (denoted as LSAC).
2.3. Characterization of Materials
The proximate and elemental composition were determined according to standard methods [28] and by an elemental analyzer (Elementar Analysensysteme GmbH vario EL cube), respectively. X-ray diffraction (XRD) was performed by a MiniFlex 600 diffractometer (Rigaku, Japan) with Cu Kα radiation source, λ = 0.15406 nm. The scanning electron microscopy (SEM) images were collected using an SEM Hitachi-S4800-Japan scanning electron microscope to characterize the morphologies of the products. FT-Infrared (FT-IR) spectra for the samples were recorded on an IR Affinity-1S spectrophotometer (Shimadzu). The specific surface area was determined by N2 adsorption–desorption isotherms at liquid nitrogen temperature (77 K) using a Quantachrome TriStar 3000 V6.07A adsorption instruments.
2.4. Determination of Point of Zero Charge (pHPZC)
The point of zero charge (pHPZC) of AC was determined by using the pH drift method [19, 20]. A series of 45 mL of 0.1 M NaCl solutions were prepared in 100 mL flasks. The initial pH value (pHi) of the solution was adjusted from 2 to 12 by using either 0.1M NaOH or 0.1M HCl solutions. The total volume of solution in each flask was made exactly to 50 mL by adding distilled water. Then, 0.1 g of AC was added to each flask, and the mixtures were kept on shaker at 180 rpm for 24 h. The final pH (pHf) of the solutions was recorded. The difference between the initial pH and final pH (ΔpH = pHi – pHf) was plotted against pHi. The point of intersection of the curve with the abscissa, at which ΔpH = 0, presented pHPZC.
2.5. Adsorption Experiments
Dyes of two different categories: MB and RhB - cationic dye; MO and CR - anionic dye were selected as model organic pollutants. Different concentrations of MB, RhB, MO and CR (150–350 mg.L−1) dyes were prepared by dissolving pure dyes with double distilled water. All batch adsorption experiments were performed under stirring (500 rpm) at 30 ± 1 °C. Typically, 0.2 g LSAC was added to 500 mL of dye solution at a desired initial concentration in a 1000 mL-beaker under vigorous stirring (500 rpm). The initial pH values of the dye solutions were adjusted with a suitable amount (0–1.0 mL) of 0.1 M HCl or 0.1 M NaOH solutions to obtain pH 11 for MB study, 3.0 for MO, RB and CR study. After a certain time, 5 mL of suspension was withdrawn and the solid in the liquid phase was separated by centrifugation at 5000 rpm for 20 min. The dye concentration in supernatant was determine by UV-Vis spectroscopy at maximum wavelength of 664 nm for MB, 552 nm for RB, 464 nm for MO and 500 nm for CR. The UV-Vis spectrum was recorded on Spectro UV-2650 (Labomed-USA). The percentage of dye that was removed, R (%) at time t, was calculated using the equation below.
where C0 (mg.L−1) and Ct (mg.L−1) are the concentration at initial and certan time t (min). The adsorption capacity, qt (mg.g−1) at a certain time t, is experessed as follows.
where V (L) is the solution volume and m (g) is mass of adsorbent. Equilibrium adsorption capacity, qe (mg.g−1), is described by this equation:
where Ce is dye concentration at equilibrium. The other parameters are described as above.
2.5.1. Adsorption kinetics
The adsorption kinetics was studied at 30°C. The pseudo-first/second- order kinetic models were employed to understand the characteristic of the adsorption process for dyes on LSAC. The expression formulas were given by equation (4) and (5) [13, 16], respectively:
k1 (min−1) is the first order rate constant, and k2 (g.(mg.min)−1) is the rate constant of pseudo-second-order kinetic model.
2.5.2. Adsorption isotherms
The amount of 0.2 gram was added to each of five flasks containing 100 mL of dye solution (150, 200, 250, 300 and 350 mg.L−1). The five flasks were shaken for 150 minutes to ensure that adsorption/desorption equilibrium can be reached. The liquid was collected by centrifugation and the remaining concentration of dye was determined by UV-Vis spectroscopy. Two models of Langmuir and Freunlich isotherms were applied to analyze the equilibrium data. The Langmuir isotherm model was expressed as follows [13, 16]
where Ce (mg.L−1) is the equilibrium concentration of dye; qmax (mg.g−1) is maximum monolayer adsorption capacity; KL (L.mg−1) is Langmuir equilibrium constant. The Langmuir isotherm model is evaluated by separation coefficient RL as follow [3]:
where the adsorption is favorable if 0 < RL < 1, unfavorable if RL > 1, linear if RL = 1 and irreversible if RL = 0.
where KF and n are Freundlich constants relating to the adsorption capacity and adsorption intensity, respectively. The magnitude of n gives an indication of the favorability of the process as values of n > 1 represent favorable adsorption.
2.5.3. Adsorption thermodynamics
For thermodynamics studies, the adsorption processes of MB, RhB, MO and CR on LSAC were conducted at different temperature from 303 K to 333 K. The mixture including 0.2 gram of LSAC and 200 mg.L−1 of each dye ( pH 11 for MB, 3.0 for MO, RB and CR) was stirred for 150 minutes to achieve adsorption/desorption equilibrium. The thermodynamic parameters including standard Gibbs free-energy change, ΔGo, standard enthalpy changes ΔHo, and standard entropy changes ΔSo were also studied to better understand the adsorption mechanism. The ΔGo was calculated based on Eq. (9) – (11) [17, 29]:
where KD is distribution coeficient, KD = C0/Ce, R is gas constant (8.314 J (mol.K)−1) and T is temperature
The relationship between KD and standard enthalpy changes ΔHo, and standard entropy changes ΔSo can be derive from Eq. (9) and Eq. (10) as follow:
The values of ΔHo and ΔSo can be calculated from the slope and intercept of the linear plot of lnKD versus 1/T.
3. Results and Discussion
3.1. Characterization of Materials
The elemental composition of LSB, LSC and LSAC materials is listed in Table S2. LSB sample has the highest content of volatile matter (79.93%) but lowest fixed carbon (20.18%) and ash (1.89%). Compared with the LSB raw material, the LSC and LSAC samples have lower volatile matter content, while the carbon content and ash are higher. These differences are due to the breakdown of chemical bonding during carbonization and the calcination after chemical activation. Volatile substances are often unstable organic constituents and decompose rapidly during heat treatment. Ash is a form of inorganic material that is difficult to evaporate and therefore its relative content in final product increases compared to the starting material when carbonization is carried out. The ultimate elemental analysis shows that the carbon content increases significantly from 45.83% in LSB sample to 59.83% in LSC and 78.34% in LSAC while other elements such as hydrogen (H), oxygen (O), sulfur (S), nitrogen (N) and potassium (K) reduces due to heating processes at high temperature mentioned above. The composition of elements C, H, O and N present in the raw material LSB and in LSAC in this study shows high agreement with the studies of AC preparation from other lignocellulose bases such as: apricot stones [21], waste tea [30], cherry stone [31], apricot stone [31], almond shell [31], grape seed [31], camellia sinensis leaves [32], and Fox nut (Euryale ferox) shell [33]. For LSAC, in addition to the presence of elements C (74.92%), H (0.32%), O (24.3%) and N (0.25%), there is a small amount of element P (0.21%).
Fig. 1a presents the FT-IR spectra of LSB, LSC and LSAC. For the LSB sample, there is a broad absorption area around 3416 cm−1 which can be attributed to the O–H vibration in primary aliphatic alcohols, aliphatic phenols, absorbed water or N – H stretching in primary amine [2, 14, 34, 35]. The absorption peaks at 2926 cm−1 and 2855 cm−1 are characteristic for stretching vibration of the C–H bond in aliphatic hydrocarbons, i.e. in –CH3 and O–CH3, respectively [16, 35]. Absorption peak at 2361 cm−1 is associated with stretching vibrations in the alkyne or methylene groups [14, 32, 36]. A characteristic broad absorption region at 1637 cm−1 (supported by 862 and 765 cm−1 peaks) and shoulder peak at 1743 cm−1 show the presence of an aromatic ring with the carboxylic group [2, 19]. A wide and weak peak around 1527 cm−1 is associated with C=O axial deformation of aldehyde, lactone, ketone, and carboxyl groups [2, 30, 37]. An absorption peak of 1456 cm−1 corresponds to characteristic vibration of carboxylic groups [2, 19]. A peak at 1384 cm−1 is associated with the axial deformation of the C – N bond of aromatic amines [22, 38]. Absorption peaks in the 1242 to 1019 cm−1 range are attributed to C–C and C–O stretching vibration of alcohol, ether, and phenol groups [2, 14, 16]. Absorption peaks in the 933 – 578 cm−1 range are related to the bending vibration of –C≡C–H–C–H [14].
After two-step treatment of LSB sample, the characteristic peaks for O–H, CH3–O, C–H, C≡C, C=O and C–O in LSB decrease in intensity or even disappear in the IR spectrum of LSC and LSAC samples (Fig. 1a) due to decomposition and breakdown of organic compounds in biomass longan seed at high temperatures [2, 14, 36]. In addition, a new absorption peak at 1098 cm−1 appears in the IR spectrum of LSAC which can be attributed to the vibrations of C–O–P aromatic and aliphatic phosphates [16, 35, 36]. In summary, from FT-IR spectroscopy, LSAC surface is characteristic by some major functional groups, including –OH, –COOH, –NH2 and –PO43−. XRD patterns of the LSB, LSC and LSAC samples are presented in Fig. 1b. The diffraction patterns of LSB and LSC contain no characteristic diffraction peaks within the 2 theta angle from 5 to 70 °C due to the amorphous nature of this material [35]. For the LSAC sample, there is a broad diffraction peak at 2θ = 25.70, and another peak with weak diffraction intensity at 2θ = 44.10 which can be assigned to the crystal faces (002) and (001), respectively, of activated carbon [19, 35]. In general, LSAC sample (activated by H3PO4) has a graphite layer structure with amorphous nature.
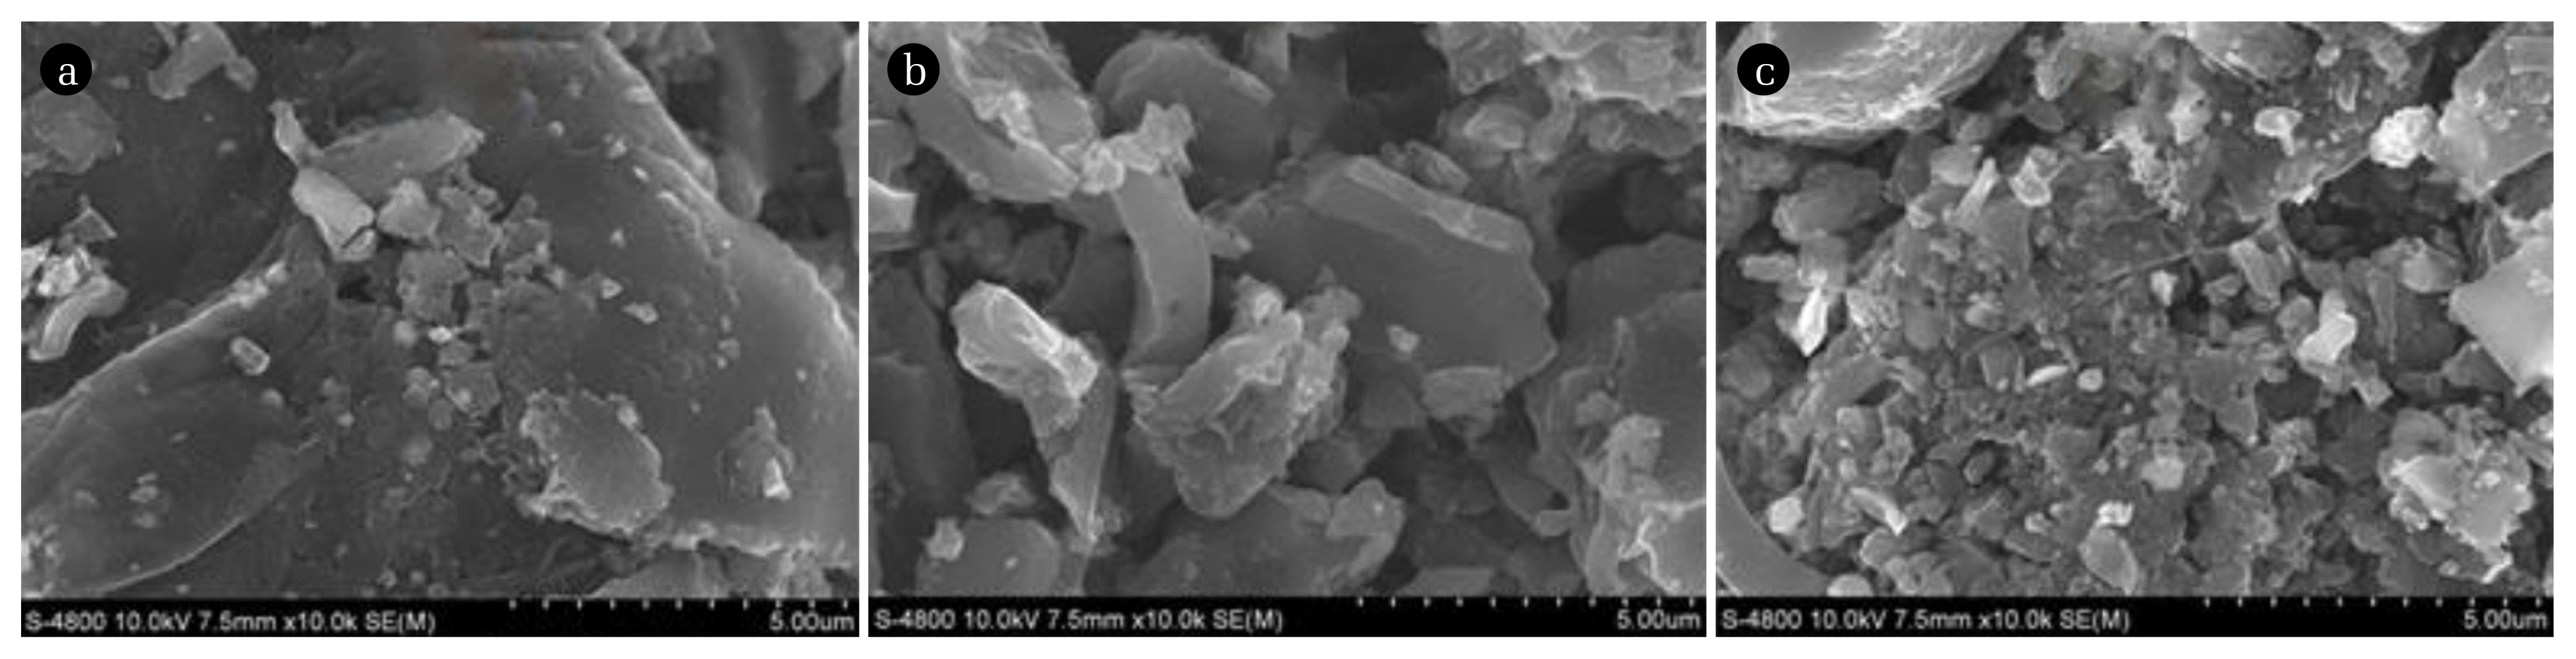
Fig. 2 shows SEM observations of LSB, LSC and LSAC. SEM image of LSB sample (Fig. 2a) illustrates that the precursor surface is in the form of large size and smooth carbon sheets. However, the surface morphology of the precursor changes after the carbonization step (sample LSC in Fig. 2b) where large sheets of carbon are crumbled into smaller carbon plates with rougher surface. A significant difference occurrs when LSC was further activated in H3PO4 and then activated at 800 °C. LSAC material (Fig. 2c) is obtained in the form of small size carbon scales which distribute uniformly, creating more pores. Since LSC contains oxygen containing groups, H3PO4 will penetrate to the pores and react with these functional groups. Subsequently, during high temperature activation, H3PO4 loses water to produce P2O5. Owing to sublimation, P2O5 gas escapes from the surface of AC in this process, creating fine pores [16].
The textural properties of the obtained samples were evaluated using the nitrogen adsorption-desorption isotherms at 77 K and are presented in Fig. S1 and Table 1. The LSB sample has a specific surface area of 1.1 m2.g−1 which is similar to several raw plant biomasses [39]. The resulting LSAC sample has a significantly higher specific surface area (SBET = 818.1 m2.g−1) and total porous volume (Vtot = 0.46 cm3.g−1) compared with the untreated LSC sample (SBET = 434.4 m2.g−1; Vtot = 0.23 cm3.g−1). N2 adsorption/desorption isotherms of LSB sample belongs to type I [2, 36], while those of LSC and LSAC exhibit distinct type IV isotherm with H4 hysteresis loop according to the classification of IUPAC at relatively high pressures (0.4 to 1.0), indicating the existence of micropores and mesopores [30, 36].
3.2. Adsorption Studies
The adsorption properties of three samples LSB, LSC and LSAC were also compared through the ability to remove MB color compounds in aqueous solutions. The experiment was performed at MB concentration of 200 mg.L−1 (pH = 11) at 30°C. The results show that the LSAC sample has the highest MB removal efficiency (R = 95.45 %), followed by the LSC (R = 27.71 %) and then LSB (R = 19.79 %). Therefore, the LSAC sample was selected for the further experiments.
3.2.1. Adsorption kinetics
In order to study the adsorption kinetics of the dyes on LSAC, 0.2 g LSAC was exposed to MB, RhB, MO and CR dyes at different concentrations (150–350 mg.L−1), during the course of 150 minutes (Fig. S2). The adsorption capacity of the dyes on LSAC increases significantly at the initial stage (0 – 15 minutes) and then becomes almost steady until reaching equilibrium after about 150 minutes of exposure. This phenomenon can be explained by the fact that there are a large number of free adsorption sites in the initial stage, favouring the adsorption of dye molecules. When all the remaining effective adsorption sites are occupied, there is a repulsion interaction between the dye molecules adsorbed on the LSAC surface and the remaining dye molecules in solution, slowing down the adsorption process [40].
The pseudo-first order and pseudo-second-order models were studied to further understand the properties of the adsorption of dyes on LSAC. Two models were used to fit the adsorption kinetic data of MB, RhB, MO and CR dyes on LSAC (Fig. S2). Kinetic parameters and determination coefficient (R2) are listed in Table 2. From the table, high R2 values of the pseudo-second kinetics model and the well match between the qe values obtained from the models and the experimental values indicate that the pseudo-second kinetics model describes better the studied adsorption process, suggesting that the adsorption rate depends mainly on the availability of adsorption sites rather than on the concentration of the dyes in solution [29]. The rate constant, k2 of pseudo-second kinetics model for MB, RhB, MO and CR dyes were found to decrease with an increase in initial dye concentration. This is due to greater competition for adsorption site of dye molecules at higher initial concentration. This result is also consistent with other studies on removing MB [3], RhB [41], MO [40] and CR [42] with activated carbon.
3.2.2. Adsorption isotherms
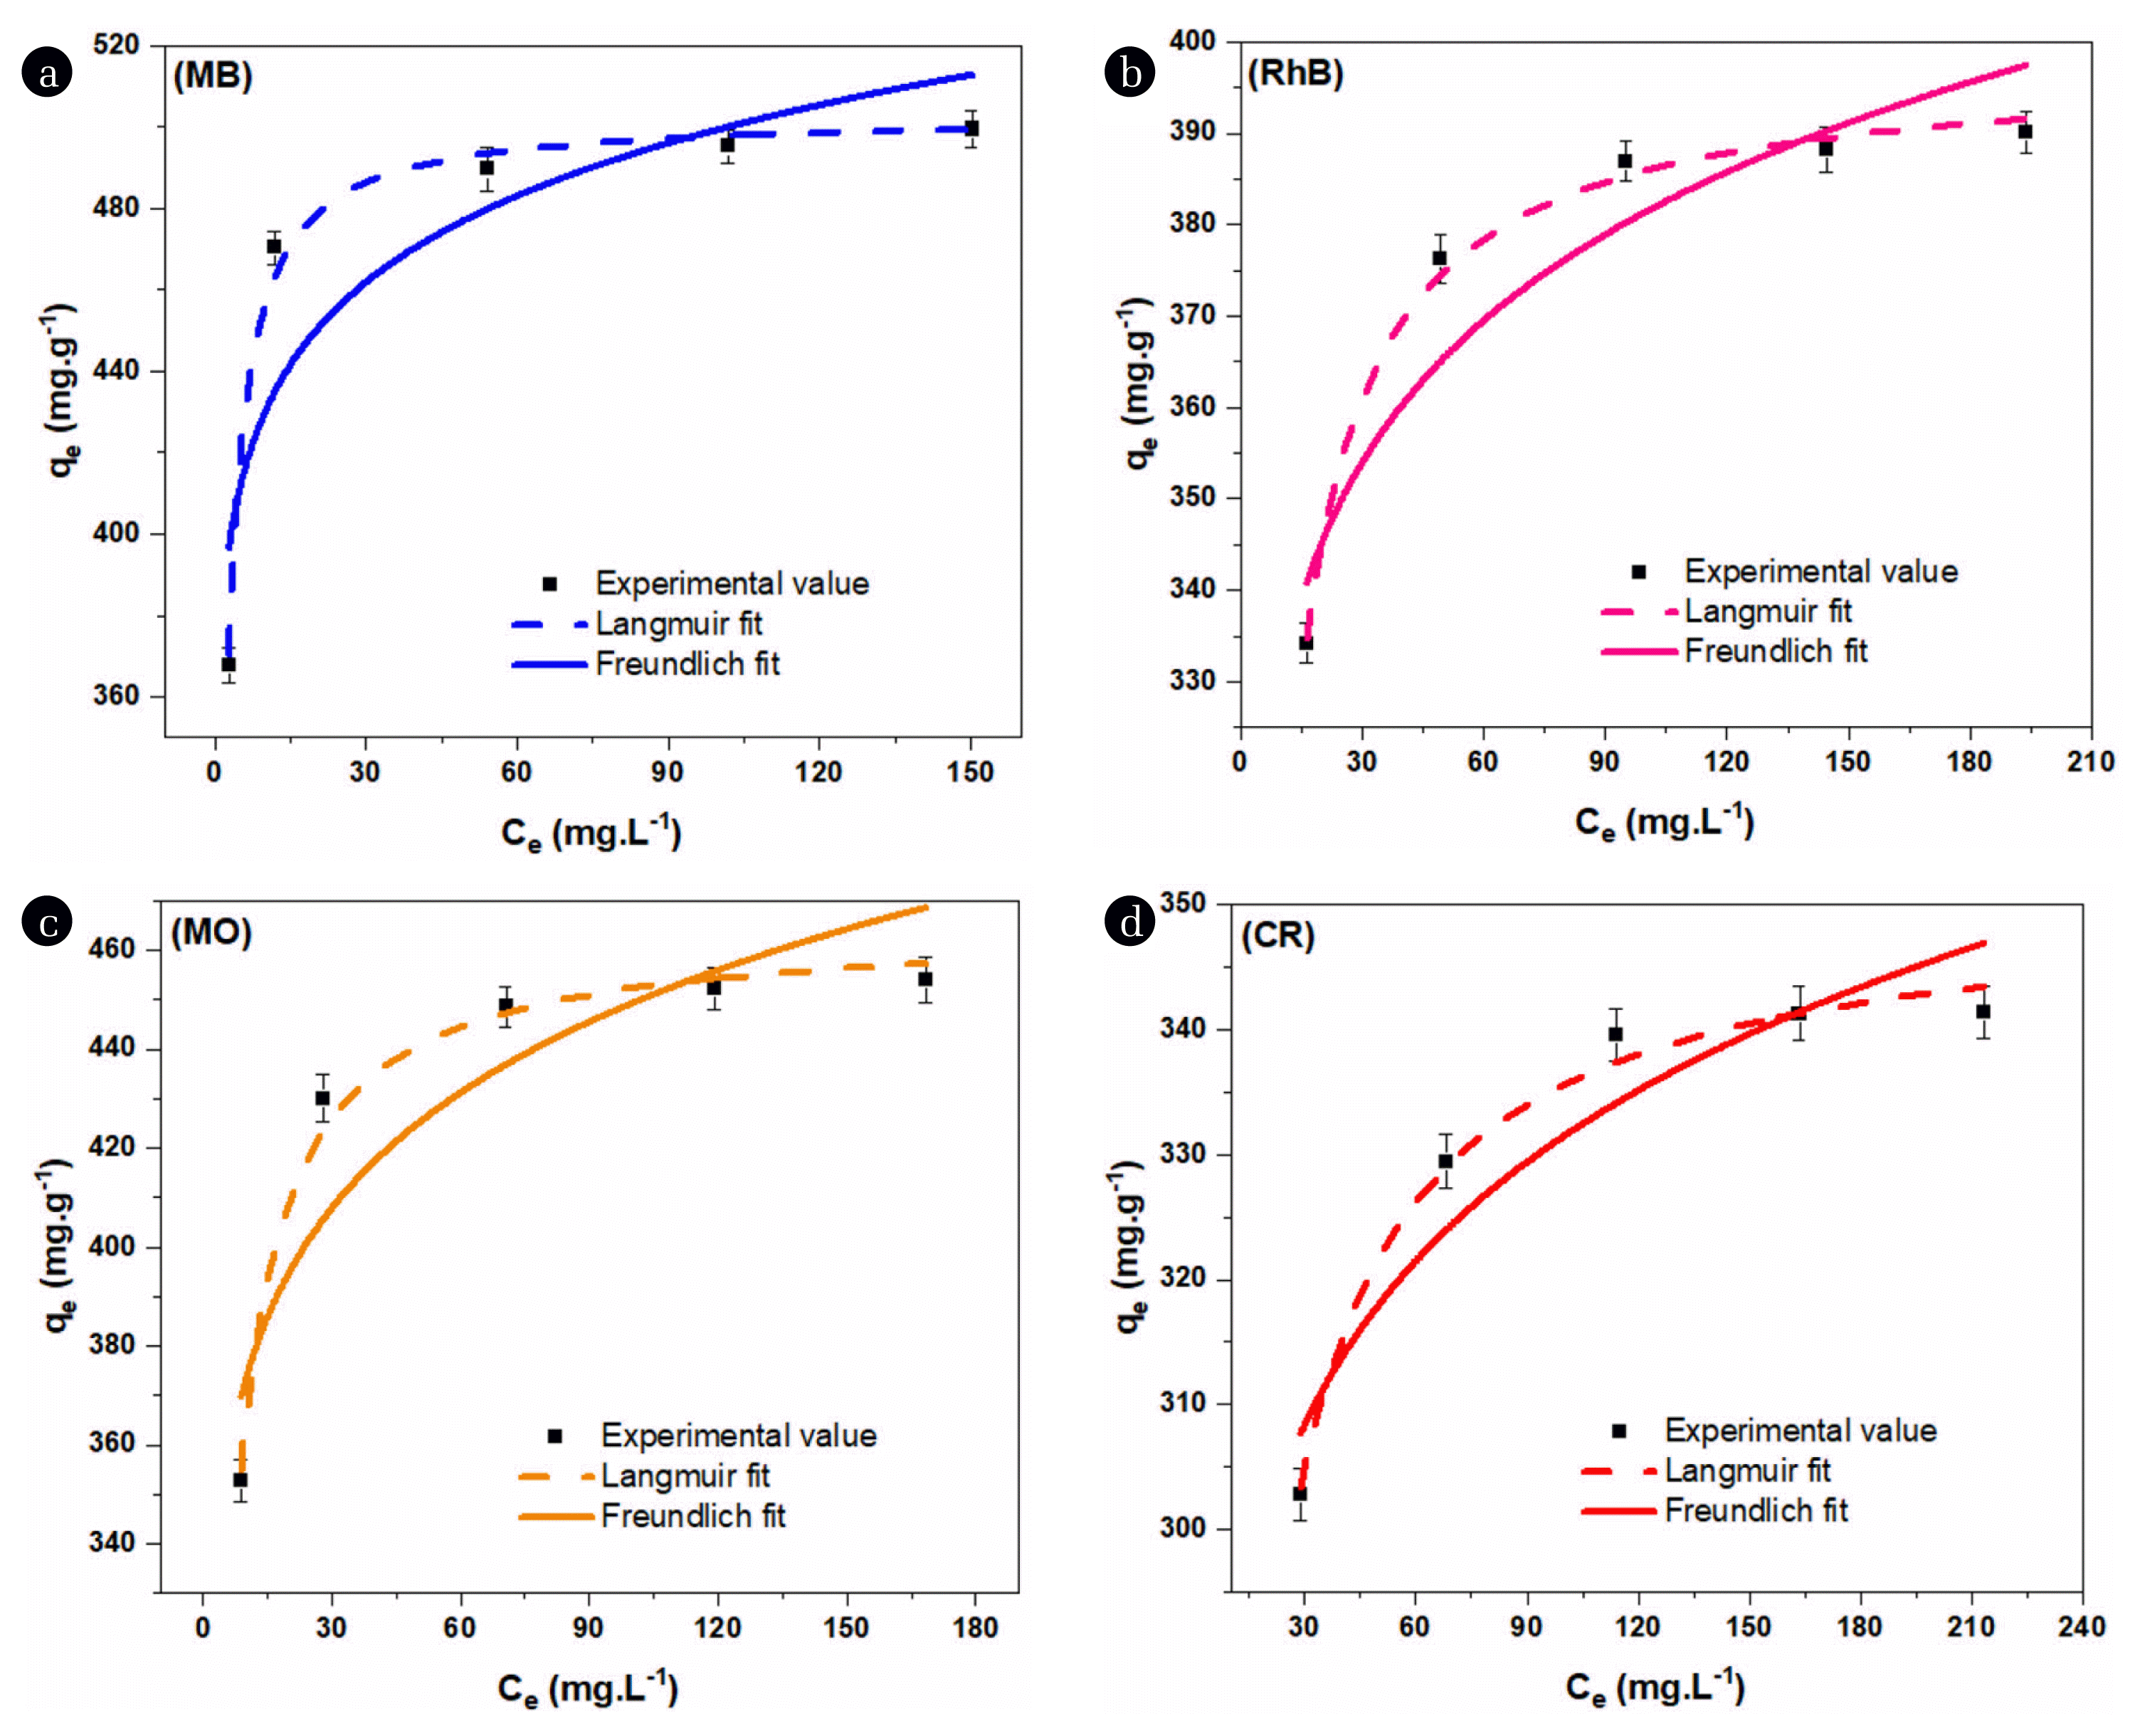
The equilibrium data were applied to Langmuir and Freundlich isotherms (Fig. 3) and the isotherm parameters are summarized in Table S3. It can be seen that all equilibrium data fitted better in Langmuir isotherm with higher R2 determination coefficients, implying a monolayer adsorption model on LSAC surface [38, 41]. In addition, all values of n were found to be higher than 1, while the values of RL ranged from 0 < RL < 1, demonstrating that the adsorption of MB, RhB, MO and CR on LSAC can be considered favorable [2, 14, 41]. qmax calculated according to Langmuir model were found to be 502.84 mg.g−1 for MB, 464.66 mg.g−1 for MO, 397.77 mg.g−1 for RhB, 350.64 mg.g−1 for CR. From the comparison of qmax value with other reported adsorbents (listed in Table 3), it can be seen that the adsorption performance of the longan seed-derived LSAC in this study was better than AC derived from several other sources. Therefore, LSAC can be considered as an efficient and low cost alternative adsorbent for wastewater treatment, especially for the removal of organic dyes in water.
3.2.3. Adsorption thermodynamics
Thermodynamic parameters can be used to evaluate the orientation and feasibility of the adsorption reactions. Table S4 shows negative values for ΔGo, indicating that the adsorption of MB, RhB, MO and CR dyes on LSAC is spontaneous. At the same time, the value of ΔGo of MO dyes increases with increasing temperature, implying that the adsorption of MO is less effective at high temperature [47]. ΔHo values for the adsorption of MB, RhB, and CR are positive, demonstrating that the adsorption reactions of these dyes are endothermic. In contrast, the adsorption of MO dye is exothermic as ΔHo is negative. These results are found to be comparable to other studies [43, 44]. The magnitude of ΔHo can also be used to indicate whether the adsorption is of physical or chemical nature. In general, the heat exchanged during physical adsorption typically falls between 0 to 20 kJ / mol, while the chemical adsorption heat typically falls between 80 to 200 kJ / mol [14, 42]. In this study, the adsorption of MB, RhB, MO and CR dyes on LSAC has ΔHo value of 36.91; 31.88; −39.36 and 27.50 kJ.mol−1, respectively (Table S4), i.e in the range from 20 to 80 kJ.mol−1, so the adsorption is mainly physical. However, the chemical adsorption is also possible. [58, 59] Positive values of ΔSo indicate high affinity of LSAC for MB, RhB, and CR dyes and the solid / liquid interface randomness increases with some structural changes in dye molecules and LSAC in the adsorption process [29]. Similar results were found in the adsorption of MB [17, 25, 46], RhB [41, 54], MO [43, 44] and CR [38, 51] on activated carbon.
3.2.4. Effect of initial solution pH
The pH has a great influence on the adsorption process because it is associated to the surface charge of the adsorbent and the state of the adsorbed substance in the solution. The effect of pH on the adsorption of MB, RhB, MO and CR dyes was studied (Fig. S3). With pKa = 3.8 [26], adsorption efficiency of MB increases gradually when increasing solution pH value. The adsorption efficiency is significantly enhanced when the pH is higher than 5 and reaches a maximum of 95.81 % at pH 11. The isoelectric point pHPZC value of LSAC material, determined by pH drift method, is about 5.6 (Fig. S3c). Therefore, at pH < pHPZC, functional groups on the LSAC surface including –OH, –COOH, –NH2 and –PO43− are protonated and the surface become positively charged according to the equations as below [22, 40, 60].
Hence, the main interaction between the adsorbent surface and cationic dye is weak Van Der Waals interaction, leading to poor adsorption of MB onto the adsorbent surface, i.e. low adsorption efficiency. In contrast, at the pH value > pHPZC, the functional groups on LSAC surface are deprotonated and become negatively charged as described in Eq. (16)–(18) [22, 40, 60]:
Therefore, high removal efficiency is due to the attraction of negatively charged surface of LSAC and the positively charged ions of MB – N+ [37].
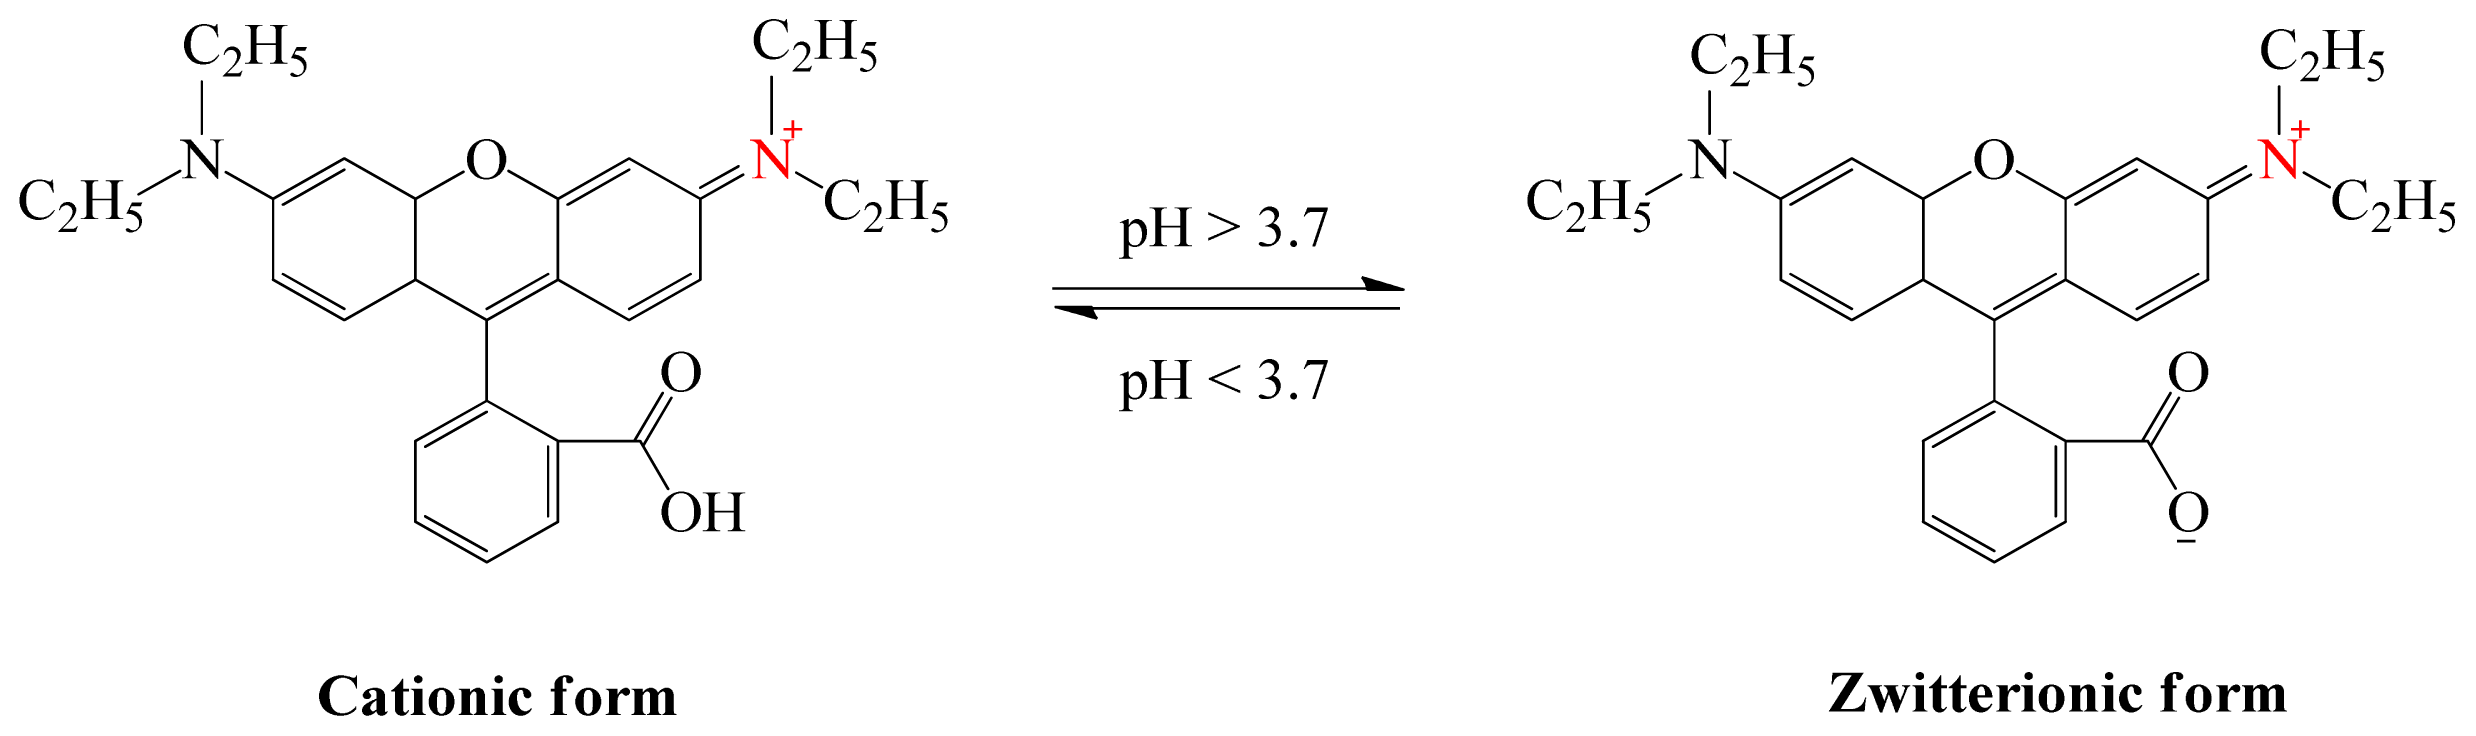
RhB (pKa = 3.7 [26]) is a cationic dye with similar value of pKa as that of MB. The adsorption efficiency of RhB is the highest at pH 3. RhB exists as cationic form at 1 < pH < 3 RhB and transforms into zwitterionic form as pH > pKa = 3.7, as in the following equation [50, 54].
As pH < pHPZC of 5.6, the low adsorption efficiency is possibly due to the repulsive interaction of the positively charged surface of LSAC and cation RhB – N+. Whereas at high pH, the electrostatic interaction of RhB-N+ cation and the negatively charged surface of LSAC increases with increasing pH resulting in an enhancement of RhB adsorption efficiency. In addition, the Zwitterionic ions of RhB is prominent at pH > pKa = 3.7 and favorable for the formation of RhB dimer due to the interaction of xanthene (– N+) groups and (–COO−) carboxyl grounds of RhB monomer [50, 52]. The RhB dimers with larger molecular size are unable to enter into the pore structure of the carbon surface, resulting in low RhB adsorption efficiency [54, 56]. As pH is higher than 7, OH− competes with –COO− in binding to –N+, leading to a decrease in the dimerization of RhB, thus an increase in the adsorption of RhB on the LSAC surface [56].
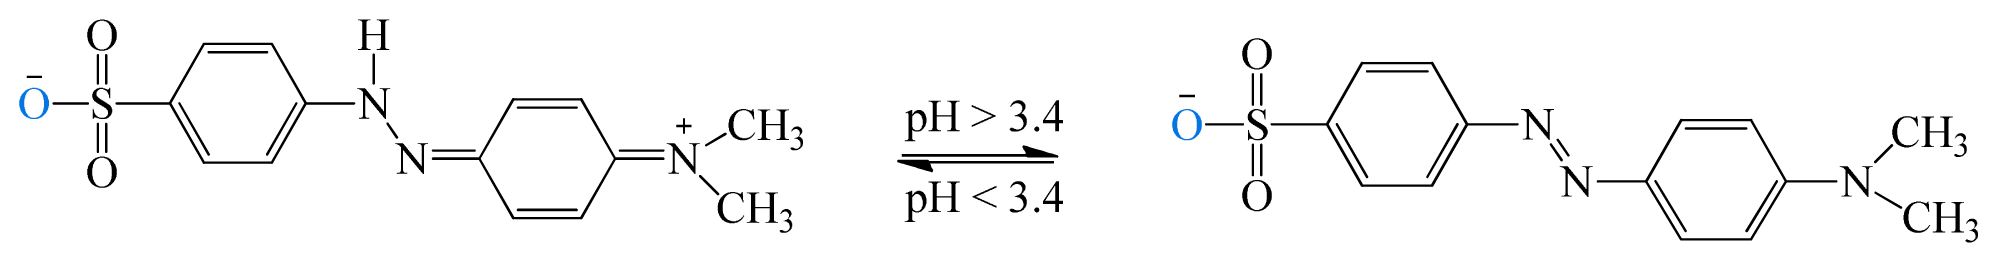
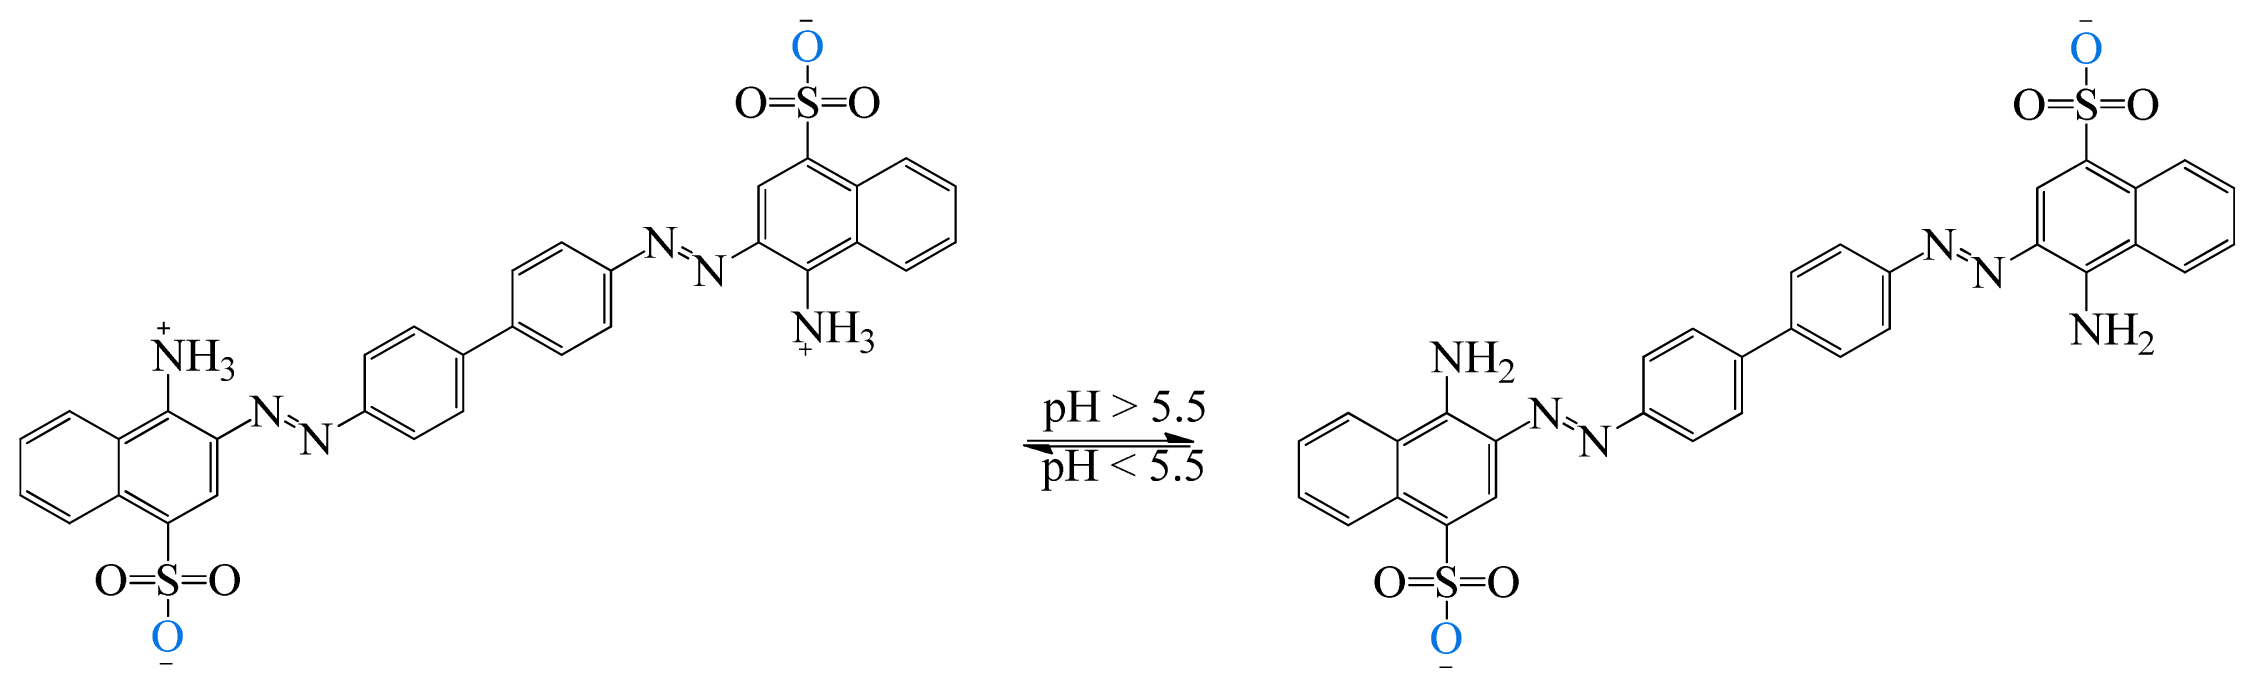
For MO and CR, the adsorption efficiency increases from pH 2 to 3 and then decreases gradually when pH rises from 3 to 11. The adsorption of MO and CR is the highest at pH = 3 with the efficiency of 86.02 % and 65.89 %, respectively (Fig. 8b). Both MO (pKa = 3.4 [27]) and CR (pKa = 5.5 [27]) can be deprotonated as follows [40, 61]:
At low pH, the positively charged LSAC surface will have a strong electrostatic interaction with the molecular anions MO–SO3− and CR–SO3−, leading to high adsorption of these anion molecules [40, 43, 62]. Furthermore, since in the structure of the ionic molecules of MO and CR contain –SO3− groups, the higher adsorption capacity can be attributed to more hydrogen bonds formed by protonated –SO3H than by –SO3− at lower pH [53, 62]. Apparently, under acidic conditions LSAC can act as hydrogen bonding donor and receptor. At higher pH, the adsorption efficiency of MO and CR is reduced because their molecular ions in the –SO3− form are not protonated and the negative groups only provide weak electrostatic attraction without any strong hydrogen bond [53, 62]. In addition, with an increase in pH, there is competition between the OH− and the dye anion molecules for positively charged adsorption sites, causing a decrease in adsorption rates [40, 62]. The adsorption of MO and CR on other adsorbents at optimal pH = 3 has also been found in previously reported studies [38, 43, 44].
Through the above investigation, it can be seen that the solution pH has a strong influence on the ionization level of dye molecules, as well as the electronegativity of the functional groups on the LSAC surface and thus greatly affects the adsorption capacity of the adsorption material. At optimal pH values (pH 11 for MB, pH 3 for RhB, MO and CR) the adsorption efficiency of dyes decreases in the order: MB (95.81 %) > MO (86.02 %) > RhB (75.26 %) > CR (65.89 %).
3.2.5. Adsorption mechanism
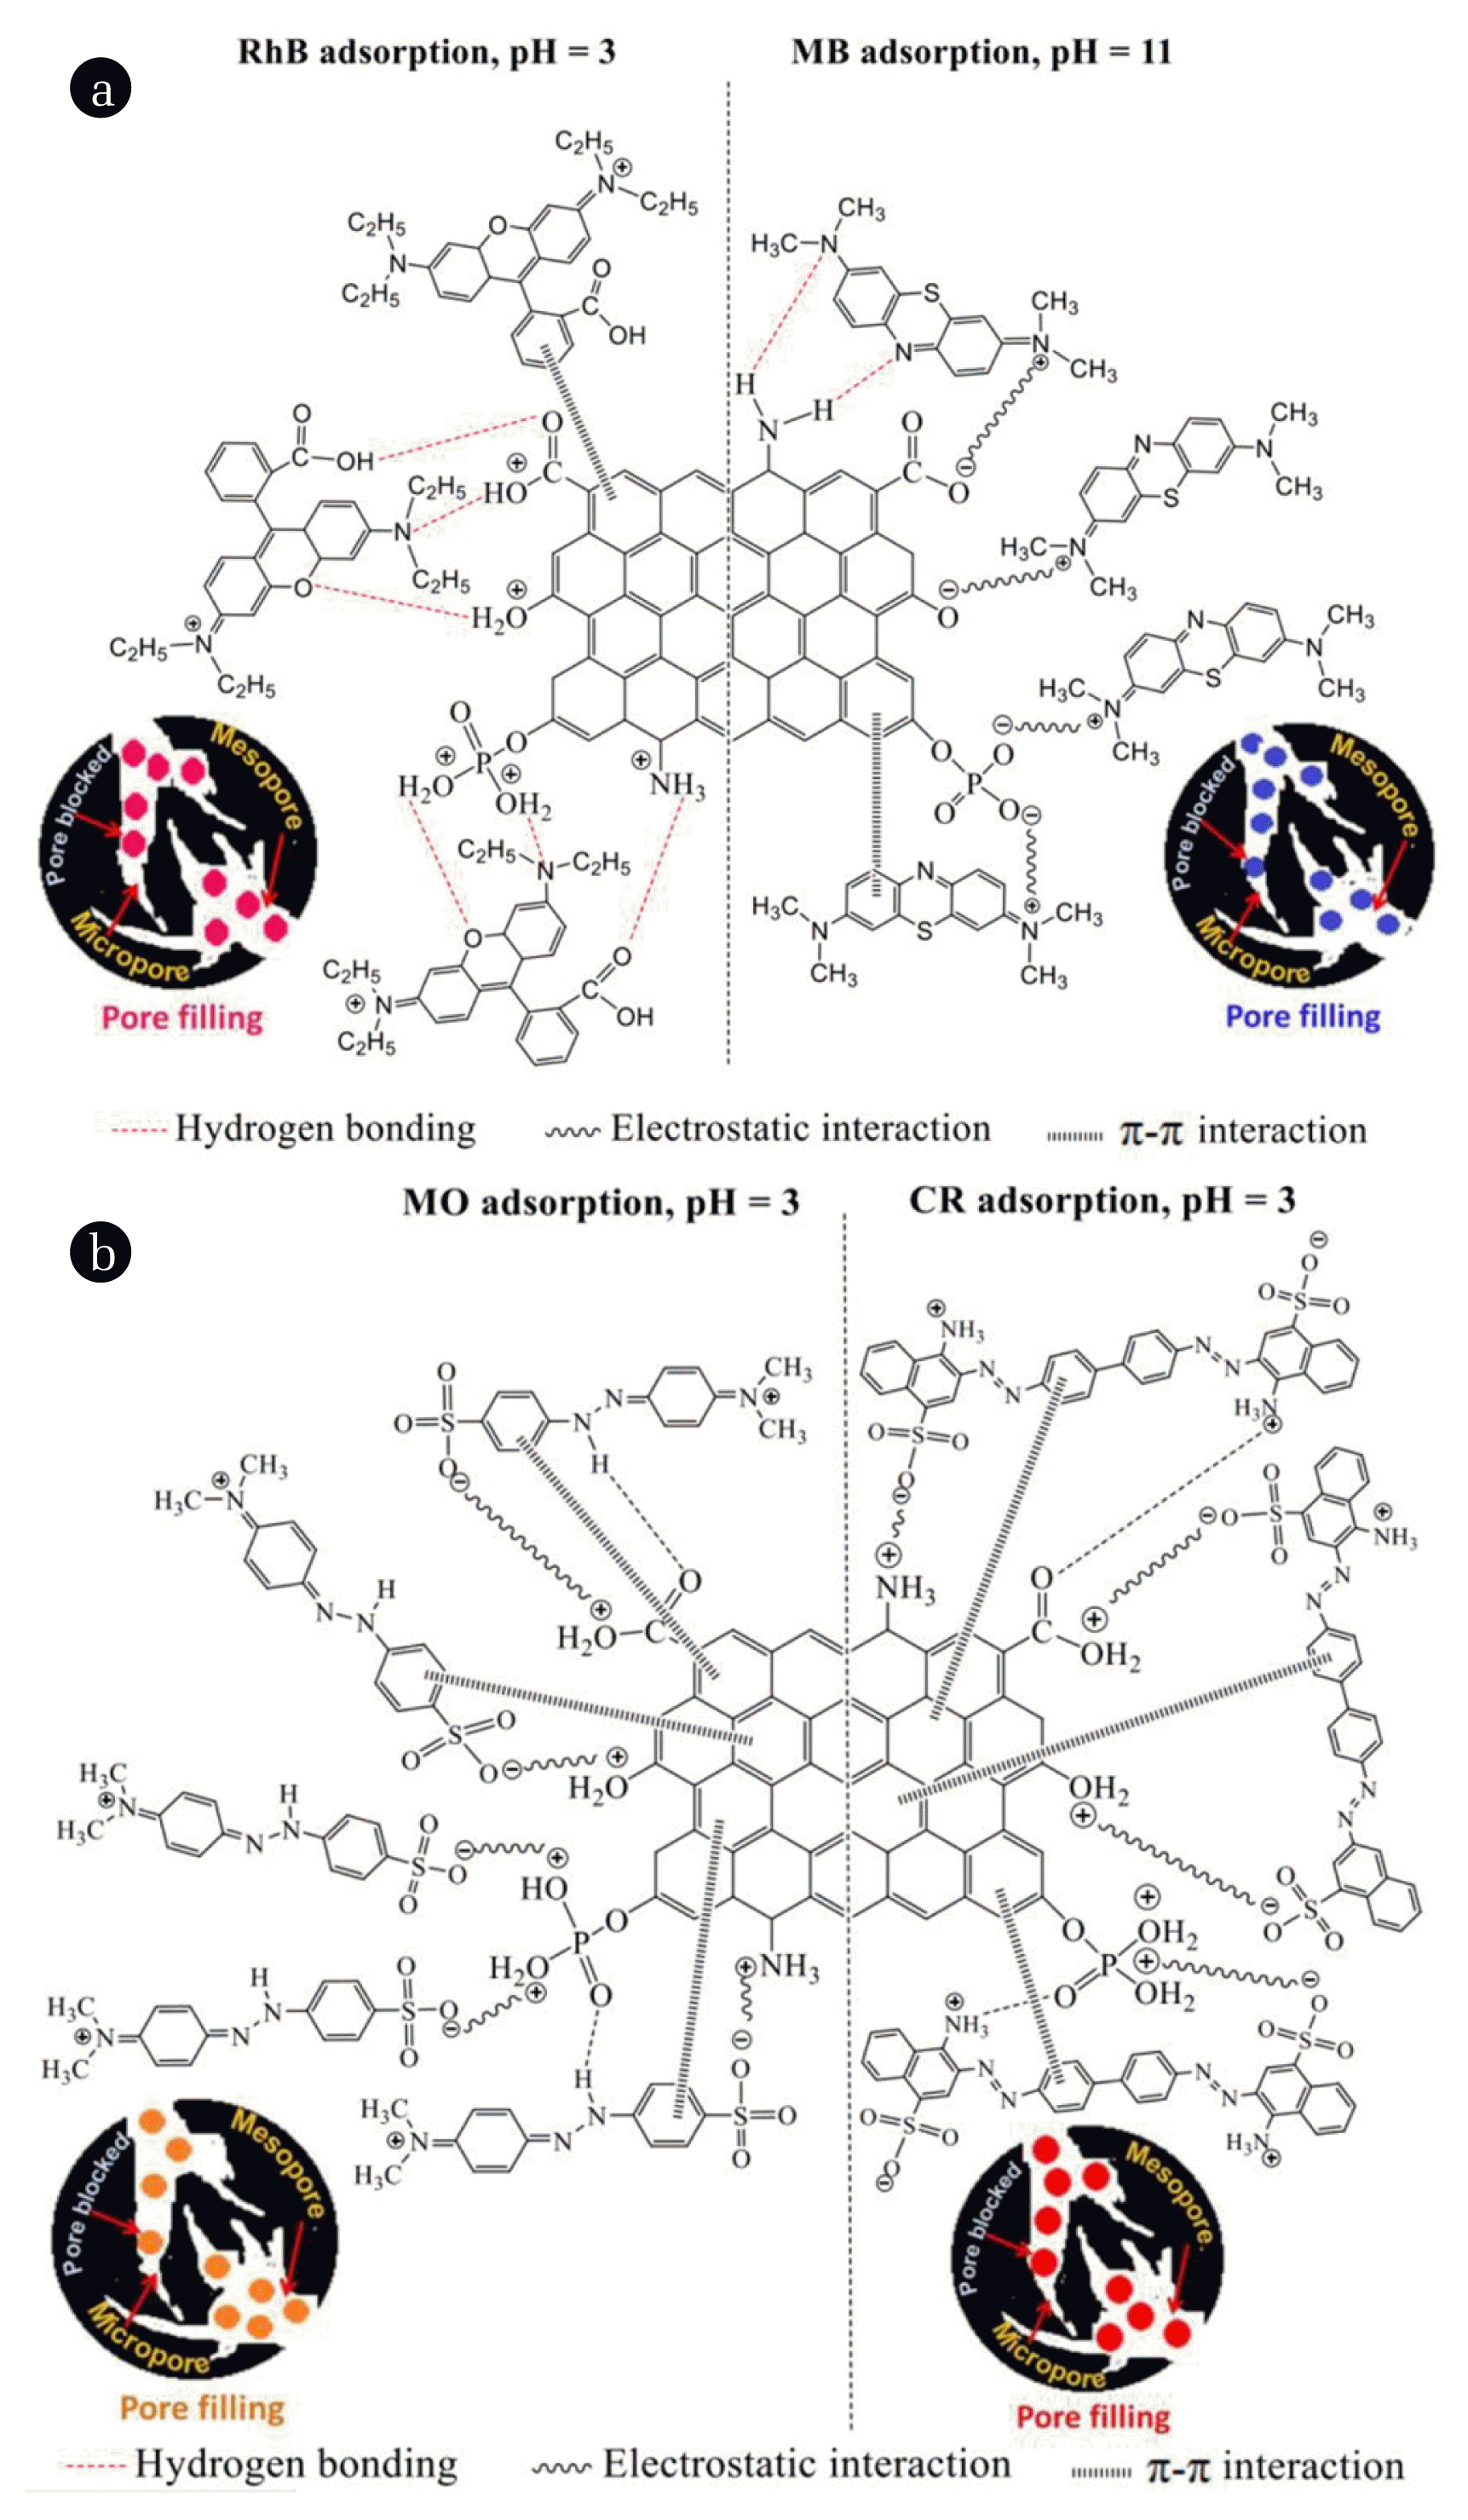
The mechanism of the removal of dyes by adsorption on the adsorbent surface can be assumed to include the following four steps as proposed by Kannan et al [63], namely, the transfer of the dyes from the bulk of the solution to the adsorbent surface, the diffusion of the dyes across the boundary layer to the surface of the adsorbent, the adsorption of the dye at the active sites on the adsorbent surface and the internal diffusion in which the dye particles enter the pores of the adsorbent. In general, the mechanism of dye adsorption is related to the interaction between the adsorbent and the adsorbate in solution. This interaction can occur in many different ways such as hydrogen bonding, electrostatic interaction, π-π stacking interaction, ion-exchange, hydrophobic bonding, pores and chemical bonding [16, 25, 37, 62]. It is possible to predict the binding forces in the adsorption process based on the value ΔHo. The energy associated with different physical forces was calculated such as Van Der Waals forces (4–10 kJ / mol), hydrophobic bond forces (5 kJ / mol), hydrogen bond forces (2–40 kJ / mol), exchange (40 kJ / mol), electrostatic forces (2–29 kJ / mol) and for chemical forces (> 60 kJ / mol) [64]. In this study, the values of ΔHo (kJ / mol) for the adsorption of MB, RhB, MO and CR dyes on LSAC (Table 7) were in the range 20 < ΔHo = 27.50 – 39.36 < 80, so the secondary adsorption mainly involves electrostatic bond forces and/or hydrogen bond forces.
The influence of pH shows that the adsorption efficiency depends strongly on the level of ionization of the dye molecules, as well as on the electrically charged capacity of the functional groups on the LSAC surface. This demonstrates that the adsorption of MB, RhB, MO and CR dyes on LSAC does occur under electrostatic forces.
The functional groups on the adsorbent surface have a great influence on the adsorption mechanism as well as the adsorbent capacity, so it is necessary to identify them. In this work, FT-IR spectra were used to detect any changes in the functional groups of MB, RhB, MO and CR dye molecules, and the functional groups of LSAC before and after the adsorption as shown in Fig. S4a and Fig. S4b, respectively. Their FT-IR spectral features are summarized in Table 4. MB, RhB, MO and CR have main functional groups, including: –OH, C=C, C=N, C=N+, C–N, C=S, C–S, C–H [18, 65, 66]; –OH, C=O, C–O, C=N, C=N+, C–N, C–C, C–H [4, 6, 67]; N–H, N=N, C=C, C=N, S=O, C–N, C–H [68, 69]; and N–H, N=N, C=C, RSO3−, S=O, C–N, C–H [9, 70], respectively (Fig. 4Sa). The functional groups on the surface of the LSAC, as aforementioned, greatly enhance its hydrophilic properties and they also act as binding sites for organic pollutants [25, 65]. A comparison of FT-IR spectra of LSAC sample before and after adsorption (Fig. 4Sb and Table 4) shows that in all samples LSAC-MB, LSAC-RhB, LSAC-MO and LSAC-CR, there are new peaks with low intensity at wavenumber around 2361 cm−1 (C=N–C or N=N–C groups) and within the range 850-530 cm−1 (axial-deformation of C–H and stretching vibrations of C–S or C–N in polynuclear aromatic rings) demonstrating that the dyes have been adsorbed on the LSAC surface.
The changes in some vibration bands can provide evidence for any possible interaction between the dyes and LSAC surface during the adsorption process. It can be seen that, after adsorption, all characteristic functional groups on LSAC surface including O–H, C–OH in the carboxyl group, aromatic C–OH, -NH2 and –PO43− shift away from their original position. These shifts are clearer in the adsorption of MB, MO and CR. As in the adsorption of MB, the functional groups on the LSAC surface are deprotonated (Eq. (17) – (19)) into negatively charged groups, i.e. –O−, –COO− and –PO43− to interact electrostatically with the positively charged functional group C=N+ of MB. Or in the adsorption process of MO and CR, at pH 3, the functional groups on the LSAC surface are positively charged (–OH2+, –COOH2+, –NH3+ and –PO4(H2)2+), creating electrostatic interaction with –SO32− anion in the molecular ionic structures of MO and CR. This kind of interaction is negligible in the adsorption of RhB. As at pH = 3, RhB exists mainly in cationic form (Eq. 20) which can hardly form any electrostatic interaction with positively charged surface of LSAC. This finding is further corroborated when the weak absorption peak at 1661 cm−1 of C=N+ vibration in RhB (Fig. 4Sa, Table 4) shifts to a wave number of 1592 cm−1 (Table 4) after being adsorbed on LSAC.
Furthermore, all the dyes in this study contain aromatic rings which can form π-π stacking with hexagonal structure of LSAC layer. This interaction is proved by the shift in IR vibrations of aromatic bonds such as C=N (and C= C) and C–N bonds. In addition, the appearance of new peaks at 817 cm−1 in the adsorption of RhB or at 821 cm−1 and 875 cm−1 for the adsorption of MO, CR which is attributed to bending vibration of C–H in the aromatic rings should demonstrate a π-π stacking between the aromatic ring of these dyes and hexagonal ring of LSAC.
Hydrogen bonding also plays an important role in the adsorption of dyes on adsorbent surface. In IR spectra, the peaks related to C–N bond in the heterocyclic ring (1396 cm−1), N–CH3 bond (1340 cm−1), bending vibration of Ar–N (1252 cm−1), valence vibrations of C=S (1183 cm−1) and C–S (1142 cm−1) of pure MB significantly reduce in intensity and shift to wavenumbers of 1383, 1323, 1216, 1171 and 1119 cm−1, respectively (Fig. 4Sb, Table 4) after adsorption. This suggests that the nitrogen atoms in the heterocyclic C–N group and in the –N(CH3)2 group and the sulfur atoms of the C–S group act as hydrogen-bonding acceptors and forming intermolecular hydrogen bonds with hydrogen atom of the –NH2 or –OH groups on the LSAC surface [65]. Similarly, the peaks associated with C=O valence vibrations in the carboxyl group (1705 cm−1); valence vibration of the C–N(C2H5)2 (1340 cm−1); the C–O valence vibration in the carboxyl group (1274 cm−1) and the valence vibration of the C–O–C bond (1180 cm−1) of pure RhB strongly decrease in intensity and shift to wave numbers of 1720; 1333; 1240 and 1128 cm−1 (Table 4) after adsorption. This suggests that the N atom in the C–N group, the O atom in the C–O–C and C=O groups can form an intermolecular hydrogen bond with the hydrogen atom of the positively charged groups on LSAC surface. At the same time, due to adsorption at pH = 3, in the structure of RhB ions, there is a carboxyl group –COOH (Eq. 20), so H atoms in this group also easily form hydrogen bonds with O and N atoms in positively charged functional groups on the LSAC surface. In addition, both pure MO and CR exhibit stretching vibrations of N–H at 3445 cm−1 and 3466 cm−1, which shift respectively to 3424 cm−1 and 3430 cm−1 (Table 4) after adsorption, proving that the H atom in the amine function groups of MO and CR is capable of forming hydrogen bonds with O and N atoms in positively charged groups on the LSAC surface.
The pore filling process was also taken into account to understand the adsorption of the dyes on LSAC surface. As the dye molecule is smaller than the pore diameter of the adsorbent, it can enter the pore structure of the carbon surface. The smaller the dye molecule is, the higher ability of the dye to enter in the pore structure is [25]. MB, RhB, MO and CR dyes have a molecular width value of 1.26, 1.59, 1.31 and 2.62 nm, respectively (Table S1), smaller than the pore diameter of LSAC (3.95 nm, Table 1), they can easily enter into LSAC structure [46, 65, 71]. This pore filling mechanism is true as the adsorption efficiency of dyes on LSAC at optimal pH values decreases in order of MB (95.81%) > MO (86.02%) > RhB (75.26) > CR (65.89%), which is consistent with the order of the width of molecular ions. Based on the above discussion, it can be seen that the adsorption process of dyes does not only have high efficiency due to the large specific surface area of LSAC, but also follows many adsorption mechanisms including electrostatic interaction, hydrogen bonding, π- π stacking interaction and pore filling between MB, RhB, MO and CR and LSAC dyes as illustrated in a schematic diagram in Fig. 4 [22, 37, 65, 71].
3.2.6. Reusability
Recyclability of LSAC during adsorption process was studied. The used adsorbents were separated and washed by ethanol and double distilled water for several times and dried for 24h at 100°C. The dried adsorbents were recycled for batch mode experiments of dye removal at optimized conditions, with dyes concentration of 200 mg.L−1, adsorbent dosage of 0.2 g, contact time of 150 min and temperature of 30 °C. After 3 cycles, LSAC presented the slight loss in adsorption capacity. The removal efficiency of MB, RhB, MO and CR dyes decreased from 95.79% to 90.18%, 75.32% to 69.67%, 86.12% to 80.35% and 66.01% to 60.24%, respectively, after 3 cycles (Fig. 5Sa). FT-IR spectra of original and reused adsorbents stay unchanged (Fig. 5S(b–e)). The surface area of LSAC samples were calculated by BET model before and after the third adsorption cycle of the smallest molecular size dye, MB, and of the largest one, CR, (Table S5 and Fig. S6). The results show that the values of surface area, mean pore diameter and total capillary volume of the LSAC samples before and after the third cycle of MB and CR do not change significantly suggesting that the structure of adsorbent is stable during adsorption process.
4. Conclusions
Activated carbon with micro/mesoporous structure and high adsorption efficiency for MB, RhB - cationic and MO, CR - anionic dyes was prepared from biomass longan seed through two steps preparation: carbonization at low temperature and chemically activated by H3PO4. All kinetics data were well fitted to the pseudo-second kinetic model. The equilibrium data is fitted well to Langmuir isotherms model with the maximum layer absorption capacity much higher compared with other studies. The thermodynamic study showed that the adsorption of MB, RhB and CR was spontaneous and endothermic, while that of MO was spontaneous and exothermic. The adsorption of these dyes was found to occur via electrostatic interactions, hydrogen bonding, π-π stacking between dye molecular ions and –OH, –COOH, –NH2 and –PO43− functional groups on the LSAC surface and pore filling. In addition, the study also showed that the adsorbent could be reused after three repeated trials. Hence, the activated carbon material derived from longan seed agricultural by-products is a promising adsorbent for the removal of dyes from the wastewater.