1. Introduction
Volatile organic compounds (VOCs) escaping into the environment from numerous process industries have been regarded as one of the grave environmental threats experienced by almost all the developing countries nowadays. The boiling points of VOCs have been reported to lie between 50°C to 260°C at 1-atmosphere pressure [1, 2]. There are a huge number of VOCs present in the atmosphere viz. esters, aromatics, ketones, aldehydes, alcohols, and several other organic compounds [3]. Besides, process industries, which are believed to be the main origin of VOC discharge, other sources include automobile exhaust, fuel combustion, household products, etc [4]. The toxic, as well as the carcinogenic nature of most of the VOCs, is predominantly responsible for their harmful impact on the environment and human health [5, 6]. It severely sabotages the environment by facilitating the formation of ozone and photochemical smog [7–9]. Its health effects on long term exposure include nausea, dizziness, headache, respiratory and nervous system problems [10–13]. There is a giant 231 million tons of VOCs discharged into the atmosphere from different sources, reported in the literature [14]. Owing to this massive amount of VOCs being discharged into the atmosphere along with their harmful effects on both health and environment, stringent laws have been enforced to deal with the menace of air pollution. There are various abatement techniques employed for their control like thermal and catalytic oxidation, absorption, condensation, adsorption and membrane separation, etc [15, 16]. Adsorption is considered to be a more efficient, less energy-intensive, less costly and environmental friendly elimination technique; belongs to the family of non-destructive technique [17, 18]. The current work employed adsorption for the treatment of VOCs.
Xylene has been used as a model VOC in this work. Porous material with high surface area is undoubtedly the vital characteristic for selecting the adsorbent in any adsorption process. Carbon materials have been regarded as one of the potential low-cost adsorbents for the abatement of VOCs, for long. Here, granular activated carbon has been utilized for the adsorption of xylene, its successful application in different forms for VOCs removal is evident from the following literature review: (i) corncob-based activated carbons [19] (ii) resin-based activated carbon [20] (iii) carbonaceous materials [21] (iv) lignin-derived activated carbon [22] (v) activated carbon [23–25] (vi) activated carbon fibers [26, 27] (vii) mesoporous carbon composites [28].
The knowledge of fixed bed adsorption kinetics has always been necessary for the anticipation of breakthrough curves and for the in-depth understanding of the mechanism by which adsorption occurs. Various kinetic models are available, namely, Bed depth service time (BDST) model, Yoon-nelson model and Thomas model which are tested against the experimental data to compute the values of kinetic constants corresponding to each model. Subsequently, the accuracy of each model to predict the shape of breakthrough curves was also assessed.
Breakthrough time along with the length of unused bed (LUB) are the two most important parameters which are found out to ascertain the performance of any adsorption column. Adsorbent’s performance can be evaluated by the breakthrough time while LUB illustrates the utilization of bed (in %) till breakthrough. It is always desired to have a higher value of breakthrough time and a lower value of LUB (higher fraction of the bed utilized). Literature review divulged, the focus of the earlier work was mostly on the determination of breakthrough times by operating the column at different operating conditions. Besides, the present work also optimized operating variables such as gas flow rate, xylene concentration, and bed height so that bed’s utilization (in %) could be maximized. Here, optimization was performed by employing response surface methodology (RSM) which takes into account the interaction between the input parameters while conventional optimization techniques work on a principle of one factor at a time approach. RSM was also applied for deriving the mathematical model which was further employed in predicting the response and finally the comparison was made between predicted response and experimentally obtained values to establish the validity of the model. The two widely used techniques for the design of experiments include box behnken design (BBD) methodology and central composite design (CCD), found from the literature. BBD yields a lesser number of experiments in comparison to CCD, which makes BBD a more popular and powerful technique for the design of experiments, saving a lot of time in conducting the experiments. Literature review further confirmed the successful application of BBD coupled with RSM in various chemical processes for optimization purposes viz. reactive extraction [29], lead removal from aqueous solution by adsorption [30], activated carbon preparation [31], photocatalytic process [32], NH3-selective catalytic reduction (SCR) of NOx [33].
Artificial neural network (ANN) is another well-known and promising modeling technique for the prediction of output, which does not require any mathematical model development. This technique primarily relies on the appropriate training of the model with adequate experimental data to obtain the relationship between multiple inputs and output variables. In the present work, the ANN technique has also been employed for the prediction of the percentage utilization of bed until breakthrough at different column conditions.
The present work aimed at xylene separation from a gas stream using adsorption (fixed bed), finding breakthrough times and bed utilization at varying operating conditions, application of kinetic models to estimate kinetic constants, determination of optimal operating conditions using RSM, and finally a comparison between RSM and ANN.
2. Material and Methods
The schematic representation of the experimental setup has been described here for carrying out fixed-bed adsorption studies at varying operating conditions.
2.1. Materials and Methods
Granular activated carbon, the adsorbent for this work, was acquired from Loba Chemie Pvt. Limited, India, possessed following characteristics: particle size = 1.5 mm; BET surface area = 564 m2.g−1; pore volume = 0.32 cm3.g−1; average pore diameter = 22.68 A°; particle density = 400 kg.m−3. All experiments commenced with the filling of fresh adsorbent in the fixed bed column. The gaseous mixture consisted of nitrogen and xylene vapor, which enters at the bottom of the adsorption column. Nitrogen was supplied through nitrogen cylinder and xylene vapor was generated from liquid xylene, obtained from Sd fine, India.
A gas chromatograph (Netel) provided with SE-30 type capillary column was employed for measuring xylene concentration in the gaseous mixture through a flame ionization detector. The analysis was performed at injector temperature, oven temperature and detector temperature of 200°C, 160°C and 230°C, respectively.
2.2. Experimental Set - up
Fig. S1 shows the experimental set up employed in conducting the fixed bed adsorption experiments. It comprises of a vertical glass column of 700 mm length and 50 mm diameter containing liquid xylene up to a particular height. Bubbler (stainless steel tube of 6.3 mm diameter) is also installed in this column for bubbling nitrogen through xylene to enable the generation of nitrogen gas and xylene vapor mixture from the exit of the glass column. This gas mixture is then diluted with fresh nitrogen gas in a mixing chamber to reduce the xylene concentration in the resulting gas-vapor mixture. Subsequently, it is admitted to the adsorption column (I.D = 50 mm, H = 100 mm) containing granular activated carbon. The effluent gaseous mixture from the column is finally sent to GC for determining xylene concentration to draw a breakthrough curve [34]. Rotameters are also installed to measure the volumetric flow rate of nitrogen gas. There is a provision of circulating the water around the vertical glass column to ensure uniform temperature. The time in which xylene concentration at the exit of the column reaches 5% of the inlet xylene concentration is known as breakthrough time, determined in all the experiments. The fractional utilization of bed till breakthrough was also found out and is given by:
where tb and ttotal are the breakthrough time and time corresponding to the complete saturation of the bed. C* is the xylene concentration at the column’s outlet in dimensionless form, relative to the inlet xylene concentration.
3. Adsorption Isotherm
The importance of adsorption equilibrium lies in the fact that it depicts how xylene gets distributed between both the phases i.e. gas and adsorbent (solid). Hence, it provides an expression between the concentration of xylene in the bulk gas phase and the amount of xylene adsorbed on a unit mass of granular activated carbon (adsorbent). As compared to liquid phase adsorption, adsorption processes involving gas-phase employ time consuming and laborious procedure for the generation of equilibrium data. The procedure involved experiments at different inlet xylene concentrations and allowing the adsorption to occur until equilibrium was achieved (complete saturation of the bed). Thereafter, the complete breakthrough curve was drawn which eventually tells us the amount of xylene adsorbed on a unit mass of granular activated carbon at equilibrium, qe (kg kg−1), given by:
where Q is the volumetric gas flow rate entering the column (m3 s−1) and the amount (kg) of granular activated carbon packed into the column is given by m.
Langmuir adsorption equilibrium isotherm was employed in the current study to establish the relationship between xylene concentration in the gas and solid phase. The basic assumptions underlying Langmuir isotherm are as follows: (i) All sites are energetically uniform (ii) Each site adsorbs only one molecule (iii) Interaction between the adsorbed molecules is not allowed and (iv) Adsorption proceeds up to one entire monomolecular layer [35]. The Langmuir isotherm is expressed as:
where c (kg m−3) is the equilibrium xylene concentration in bulk gas phase, qm (kg kg−1) and K (m3 kg−1) are the Langmuir isotherm constants. qm is a measure of adsorbent’s maximum adsorption capacity associated with one full mono-molecular layer while K is indicative of the energy required for adsorption [36]. Equilibrium experimental data were then fitted in Eq. (3) to enable the evaluation of Langmuir isotherm constants, illustrated in Fig. S2(a). The validity of Langmuir isotherm was further asserted by the reasonably higher value of R2 (= 0.986). Langmuir isotherm constants, qm and K, were estimated to be 0.214 kg kg−1 and 35.18 m3 kg−1, respectively.
Separation factor, R is another vital parameter which affirms the adsorption process to be favorable [37], given by:
The adsorption isotherm is said to be irreversible for R = 0, favorable for R lying between 0 to 1, and unfavorable for R = 1. Xylene adsorption was found to be favorable, visible from Fig. S2(b).
4. Adsorption Kinetics
The response to the adsorption column is generally determined by drawing breakthrough curves (
Versus time) at different operating conditions. Here, the percentage removal (Y) of xylene is expressed as [38]:
As already stated, the determination of breakthrough curves is imperative for designing the adsorption column, which calls for examining the kinetics of the overall adsorption process. The present work utilized following kinetic models: (i) BDST (ii) Thomas and (iii) Yoon-Nelson; to enable prediction of breakthrough curves with the help of kinetic constants associated with each model [39].
4.1. Bed Depth Service Time (BDST) Model
BDST is considered to be one of the simplest models for designing the adsorption column, provides a linear relationship between bed depth and service time for the estimation of maximum adsorption capacity and kinetic constant. The surface reaction between adsorbate and residual capacity of the adsorbent offers the maximum resistance (limiting step) in the overall adsorption process is the main assumption for the development of this model [40]. Here, the comparison has been made between breakthrough times obtained by conducting fixed-bed adsorption experiments at various operating conditions with service times obtained from the model, given by Eq. (6).
where N0′ and ka are the adsorption parameters, namely, maximum adsorption capacity (kg.m−3) and adsorption rate constant (m3 kg−1 s−1), respectively. F is the linear flow velocity (m s−1).
Eq. (6) can also be written as:
The slopes and intercepts (a′ and b′) at some other flow rates and inlet concentrations can be determined by employing the following expressions:
At new flow rate
At new inlet concentration
Where F and F′ are old and new flow rates. Similarly, C0, C, C0′ and C′ are the old and new xylene concentrations at the inlet and outlet of the column at different times.
4.2. Thomas Model
Thomas model is known to be the most extensively used models to understand the behavior of the fixed bed column. The derivation of this model utilizes following assumptions: (i) Negligible axial dispersion (ii) Adsorption follows Langmuir isotherm (iii) Adsorption is described by the pseudo-second-order reversible kinetics (iv) Overall adsorption process is controlled by the interfacial mass transfer with negligible internal and external mass transfer resistances [41], believed to be the major limitation of this model. The estimation of adsorbent’s maximum adsorption capacity, qe (kg kg−1) can be made by using this model, given by:
Eq. (11) can also be expressed as
where kinetic constants, kTh (m3 kg−1 s−1) and qe, are obtained from Eq. (12).
4.3. Yoon-Nelson Model
This model does not entail detailed data regarding the properties of a fixed bed column thus making this model extremely simple and concise. It can be successfully implemented over the broad range of effluent concentrations from the commencement of breakthrough until the saturation time of the fixed bed column. The basic assumption underlying this model is that the rate of decrease in the probability for each adsorbate molecule is proportional to the probability of adsorbate adsorption and the probability of an adsorbate breakthrough on the adsorbent [42]. The linear form of this model is written as [43]:
where model parameters kYN (s−1) and τ (s) are found out by fitting experimental data in Eq. (13). The concentration of xylene at the outlet of the column becomes 50% of the inlet xylene concentration in time τ.
5. Fixed Bed Adsorption Studies: Breakthrough Curves & % Utilization of Bed
In this section, the influence of bed height, inlet xylene concentration, and gas flow rate on breakthrough curves and percentage utilization of bed were determined by conducting the experiments intending to remove xylene from the gas stream.
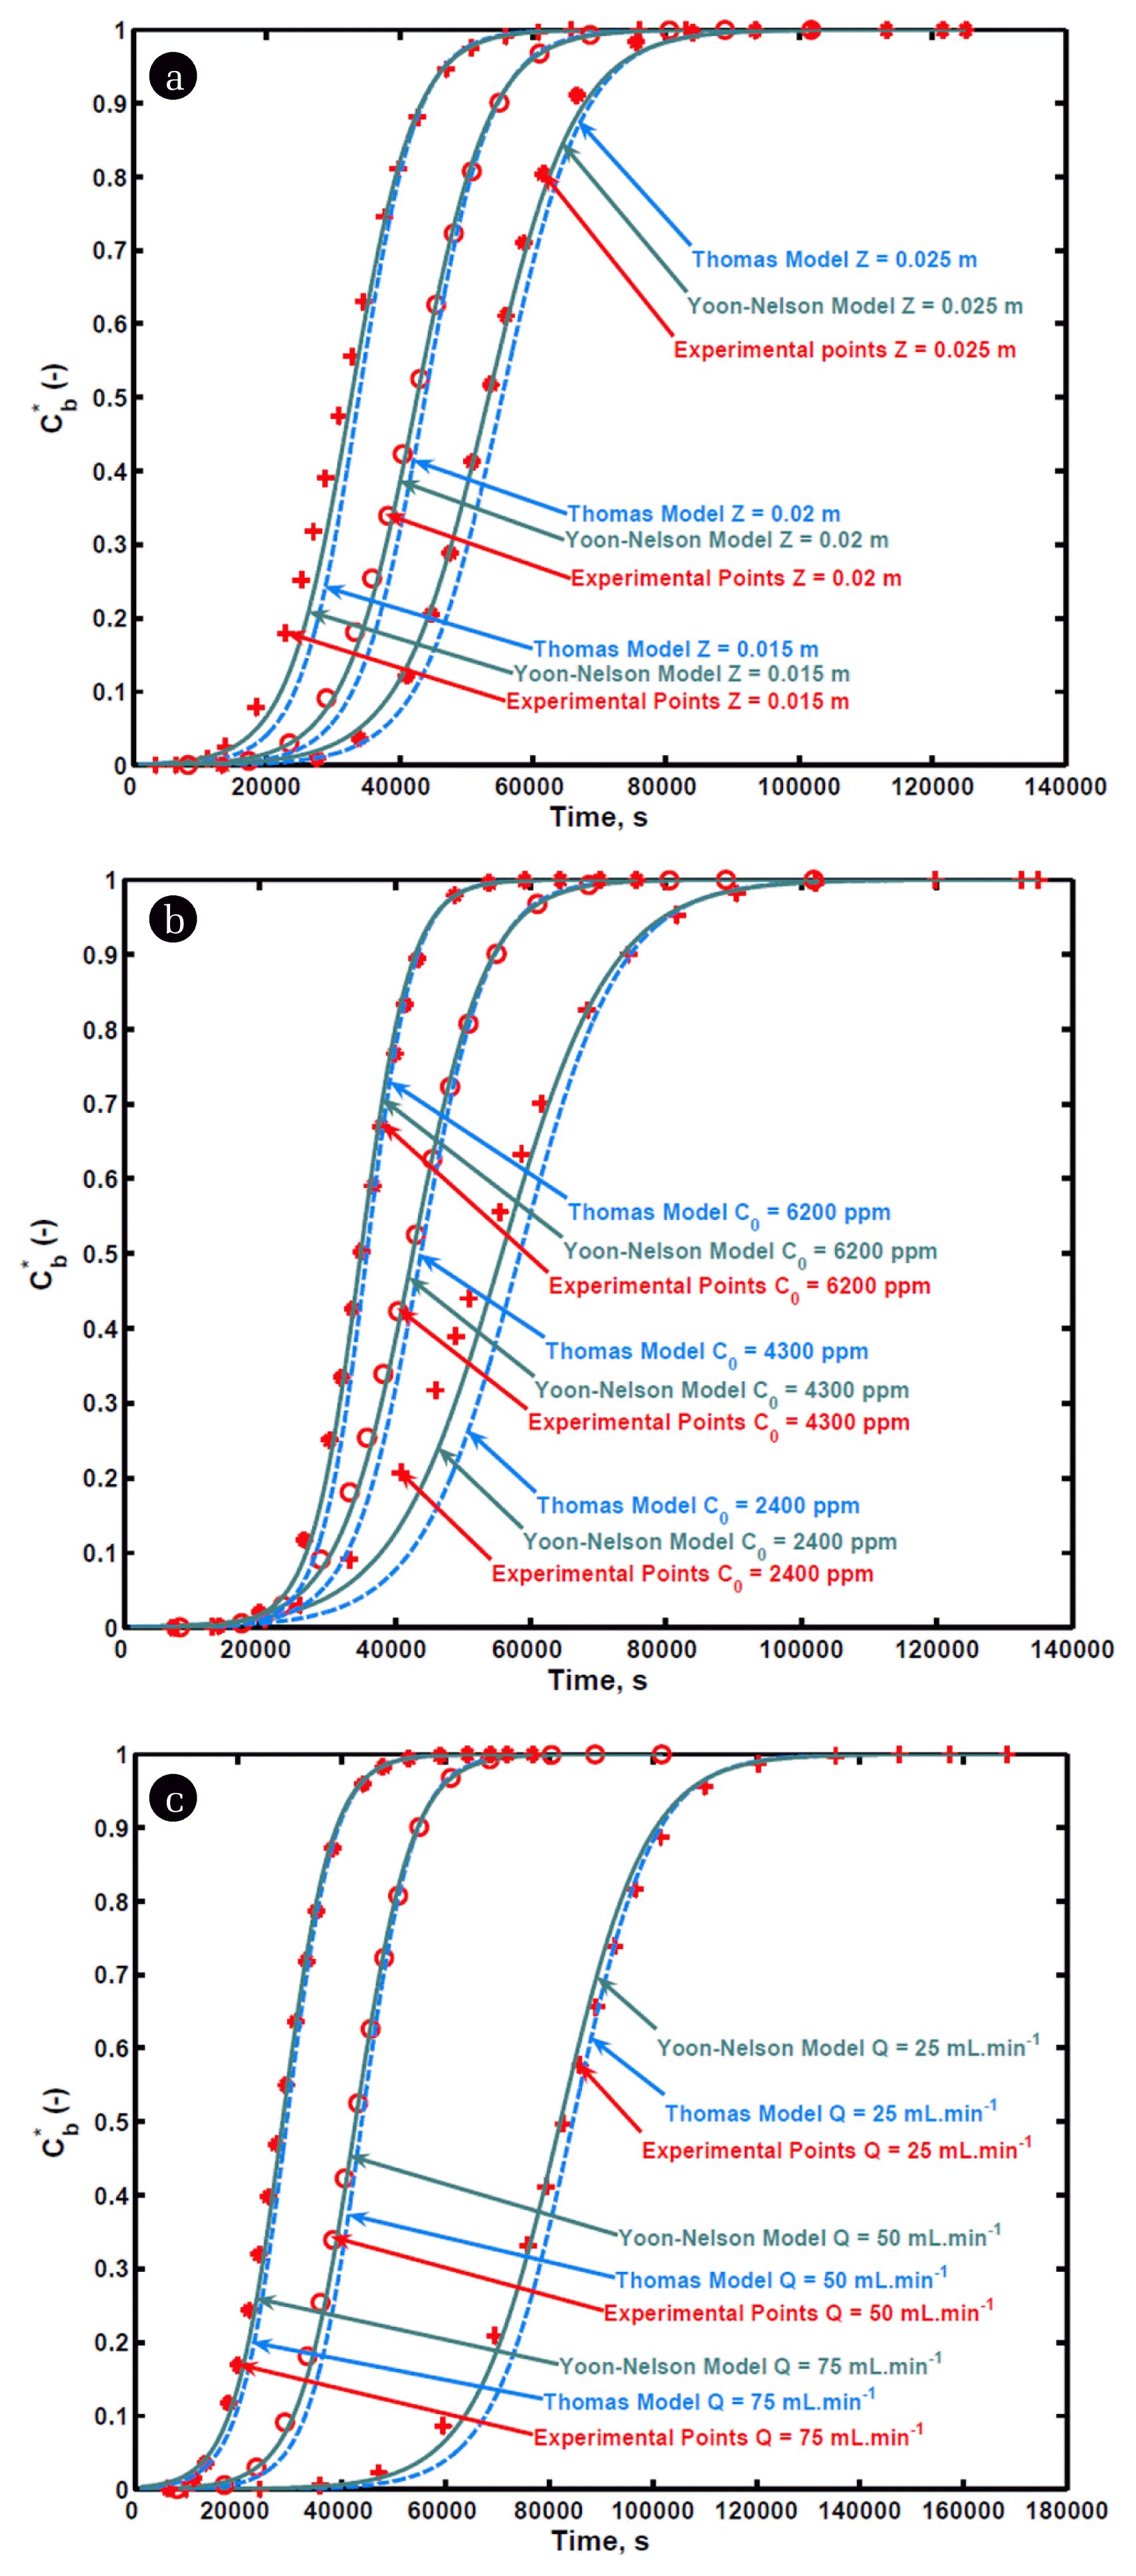
5.1. Influence of Bed Height
Adsorption column’s bed height is a crucial operating variable in determining early or delayed breakthrough. Its effect can be seen from Fig. 1(a), indicating three curves for bed heights of 0.015 m, 0.02 m and 0.025 m at 50 mL min−1 gas flow rate and 4,300 ppm inlet xylene concentration. A bed height increase from 0.015 to 0.025 m resulted in an increase in breakthrough time from 16,460 s to 35,700 s and breakthrough time was 25,830 s for bed height of 0.02 m. Greater bed height corresponds to more mass of granular activated carbon in the column, which eventually leads to longer breakthrough time. Percentage bed utilization until breakthrough was also found to be increasing at greater bed heights. Since at the identical flow rate and inlet concentration, a bed height increase does not cause LUB to alter due to which fractional utilization of bed increases. The rise in bed height also resulted in an increase in percentage xylene removal from 38.1 to 42.7%.
5.2. Influence of Inlet Concentration
Inlet adsorbate concentration also has a remarkable effect on the functioning of the adsorption column. Fig. 1(b) illustrates this effect at three different inlet xylene concentrations viz. 2,400, 4,300 and 6,200 ppm for bed height and gas flow rate of 0.02 m and 50 mL min−1, respectively. An increase in xylene concentration from 2,400 to 6,200 ppm led to a decrease in breakthrough time from 28,910 s to 23,130 s. This could be elucidated by taking into consideration the type of adsorption isotherm the system exhibits. The slope of favorable isotherm in the higher concentration zone is lower than that in the lesser concentration zone owing to which mass transfer zone velocity is always greater in the larger concentration region, eventually leads to early breakthrough at higher inlet xylene concentrations. On the other hand, the percentage of bed utilized until breakthrough as well as percentage removal found to increase at higher xylene concentrations. Since the rise in entering xylene concentration corresponds to a higher mass of xylene going into the column per unit time along with gas, results into a greater amount of xylene adsorbed till breakthrough as well as up to saturation due to which fractional utilization of bed increases.
5.3. Influence of Flow Rate
The gas flow rate is another vital operating parameter that greatly influences the shape of a breakthrough curve, shown in Fig. 1(c). Here, breakthrough curves were drawn at flow rates of 25, 50, and 75 mL min−1, respectively, keeping other operating parameters like inlet xylene concentration and bed depth constant at 4,300 ppm and 0.02 m, respectively. A substantial decrease in breakthrough time was observed on augmenting the gas flow rate from 25 to 75 mL.min−1. Greater external mass transfer coefficients at enhanced flow rates lead to an increase in the rate of adsorption on the account of which breakthrough time and saturation time obtained are quite short. The rise in flow rate from 25 to 75 mL min−1 also engendered both fractional utilization of bed and percentage xylene removal to decrease. This may be due to the lesser residence time provided for xylene removal at higher flow rates while the amount of xylene adsorbed till saturation would be the same irrespective of flow rate because of identical inlet xylene concentration, eventually resulting in a reduction in fractional utilization of bed at higher gas flow rates.
6. Kinetic Models Testing
In this section, kinetic models were verified with the help of experimental data collected at varying conditions.
6.1. Implementation of the BDST Model
The estimation of BDST parameters i.e. N0′ and ka (Eq. (6)) were made by drawing t vs. Z graph at various C/C0 values of 0.15, 0.4 and 0.7 respectively for C0 = 4,300 ppm and Q = 50 mL min−1. The values of R2 reported in Table 1 suggest experimental data and model complement each other. Table 1 also reports the values of N0′ and ka at different conditions, computed from t vs. Z graph. The amount of xylene adsorbed on a unit volume of the bed should increase with an increase in C/C0 which is visible from the increasing values of N0′ obtained at different C/C0 values.
Besides, service times were also predicted by making use of this model at various conditions by employing BDST parameters (Table 2). The values of service time were calculated from Eq. (6) for the following conditions: (i) flow rates of 25 and 75 mL min−1 respectively; at fixed C0 and Z (4,300 ppm and 0.015 m) and (ii) inlet xylene concentrations of 2,400 and 6,200 ppm, respectively; at fixed Q and Z (50 mL min−1 and 0.015 m). The model predicted values of service times were also compared with experimental service time values for both the above-mentioned conditions at varying values of C/C0. It is evident from Table 2, percentage error between predicted and experimental service times at C/C0 = 0.4 and 0.7 is less in comparison to percentage error obtained at C/C0 = 0.15. Hence, service time values can be safely predicted with fairly high accuracy by employing the BDST model for C/C0 values ranging between 0.4 and 0.7.
6.2. Implementation of the Thomas model
Table 3 depicts the values of kinetic constants (kTh and qe) at varying operating conditions obtained by fitting experimental data into the Thomas model (Eq. (12)). The model was found to be satisfactory in predicting the performance of the column, apparent from the values of R2 mentioned in Table 3. Experimentally obtained breakthrough curves were also compared with the breakthrough curves predicted from the model at varying operating parameters such as bed height, flow rate, and inlet xylene concentration, shown in Fig. 3. It can be seen from Table 3, qe rose with an increase in inlet xylene concentration. Since the amount of xylene adsorbed on a unit mass of activated carbon is always directly proportional to the inlet concentration of the adsorbate regardless of bed height and flow rate, owing to which qe increased. From Table 3, little deviation in qe from 0.1173 to 0.12515 kg kg−1 was observed at 4,300 ppm inlet xylene concentration at varying flow rates and bed depths while qe(exp) varied between 0.1169 to 0.1175 kg kg−1 for identical conditions. The difference in the experimental and model values of qe was attributed to the second-order kinetics assumption along with the limiting step (interfacial adsorption) assumption. Despite its widespread application, this model can be safely applied with high precision where the aforementioned assumptions prevail.
6.3. Implementation of the Yoon-Nelson Model
Here, the parameters involved in the Yoon-Nelson model, i.e. kYN and τ were obtained by fitting the experimental data in Eq. (13) at different conditions, are listed in Table 4. The validity of this model was further confirmed by larger values of R2 (Table 4). An increase in bed height caused τ to increase while the rise in gas flow rate and inlet xylene concentration led τ to fall, evident from Table 4. However, kYN in comparison to τ, exhibited a reverse trend for all three operating variables. Values of τ obtained from the model were found to be comparable with the experimental τ values, owing to which breakthrough curves obtained by employing the Yoon-Nelson model were in close proximity with the experimentally obtained breakthrough curves at varying conditions (Fig. 3). The insignificant variation between experimental and model-predicted points suggests the applicability of this model in describing the response of a fixed bed adsorption column.
7. Experimental Design Methodology
The response surface methodology (RSM) technique is one of the most extensively employed techniques nowadays for searching the optimum values of operating variables in a predefined range involved in any process. RSM utilizes an empirical statistical technique for the establishment of a mathematical model between cause (input operating variables or independent parameters) and effect (response or output parameters) [44]. This technique assumes significance when response or output is affected by several number of independent or input parameters [45]. The box-behnken design methodology was utilized here for the design of experiments for three input parameters with three levels each. Bed height (X1), inlet xylene concentration (X2) and gas flow rate (X3) were taken as the input or independent variables. These independent variables along with their ranges and levels are reported in Table S1. The percentage of bed utilized ( was selected as a response or output parameter. Responses were predicted by using the following second- order polynomial equation [46]:
where the response function is represented by Y; coefficients of linear, quadratic and interaction terms are denoted by βi, βii, and βij, respectively; error is represented by ∈.
BBD yields 15 experiments for three-factor three-level design, which were conducted and their responses recorded, illustrated in Table S2. Minitab 14 software was employed to create a design matrix. The second-order polynomial equation for the prediction of response in terms of coded input variables was deduced by fitting the experimental data, given by
The predicted responses using Eq. (15) are also listed in Table S2 along with the experimental responses at varying experimental conditions.
7.1. ANOVA Interpretation
The developed mathematical model’s ability to predict response adequately was then confirmed by applying analysis of variance (ANOVA), the results of which are summarized in Table S3. The results undoubtedly indicated the significance of the model owing to “Model p-value < 0.05” and large “Model F-value 78.78”. R2, the coefficient of determination and the adjusted coefficients were found to be close to 1 thereby suggesting the fairly good quality of fitness of the quadratic model. Table S3 indicates the significance of linear and square terms is more (p < 0.05) in comparison to interaction terms to predict the response. Lack of Fit F-value was 0.91, much lower than 4.7725 [47], the critical value read from the F-distribution table at a confidence interval of 95%. Fig. S3(a) shows the dependability of the developed model on account of the almost linear plot between predicted and experimental values. Subsequently, the residual analysis was performed by plotting residuals vs. predicted responses (Fig. S3(b)) to establish the model’s precision, residuals’ negative and positive values represent high and low prediction. The non-uniform pattern of the points obtained from Fig. S3(b) also demonstrated the assumption of random dispersion of residuals to be true. The assumption of residuals’ independency can also be viewed from Fig. S3(c) where no specific sequence (increasing or decreasing) of residuals was observed. The residual normal plot was also drawn (Fig. S3(d)), depicting the normality of the data.
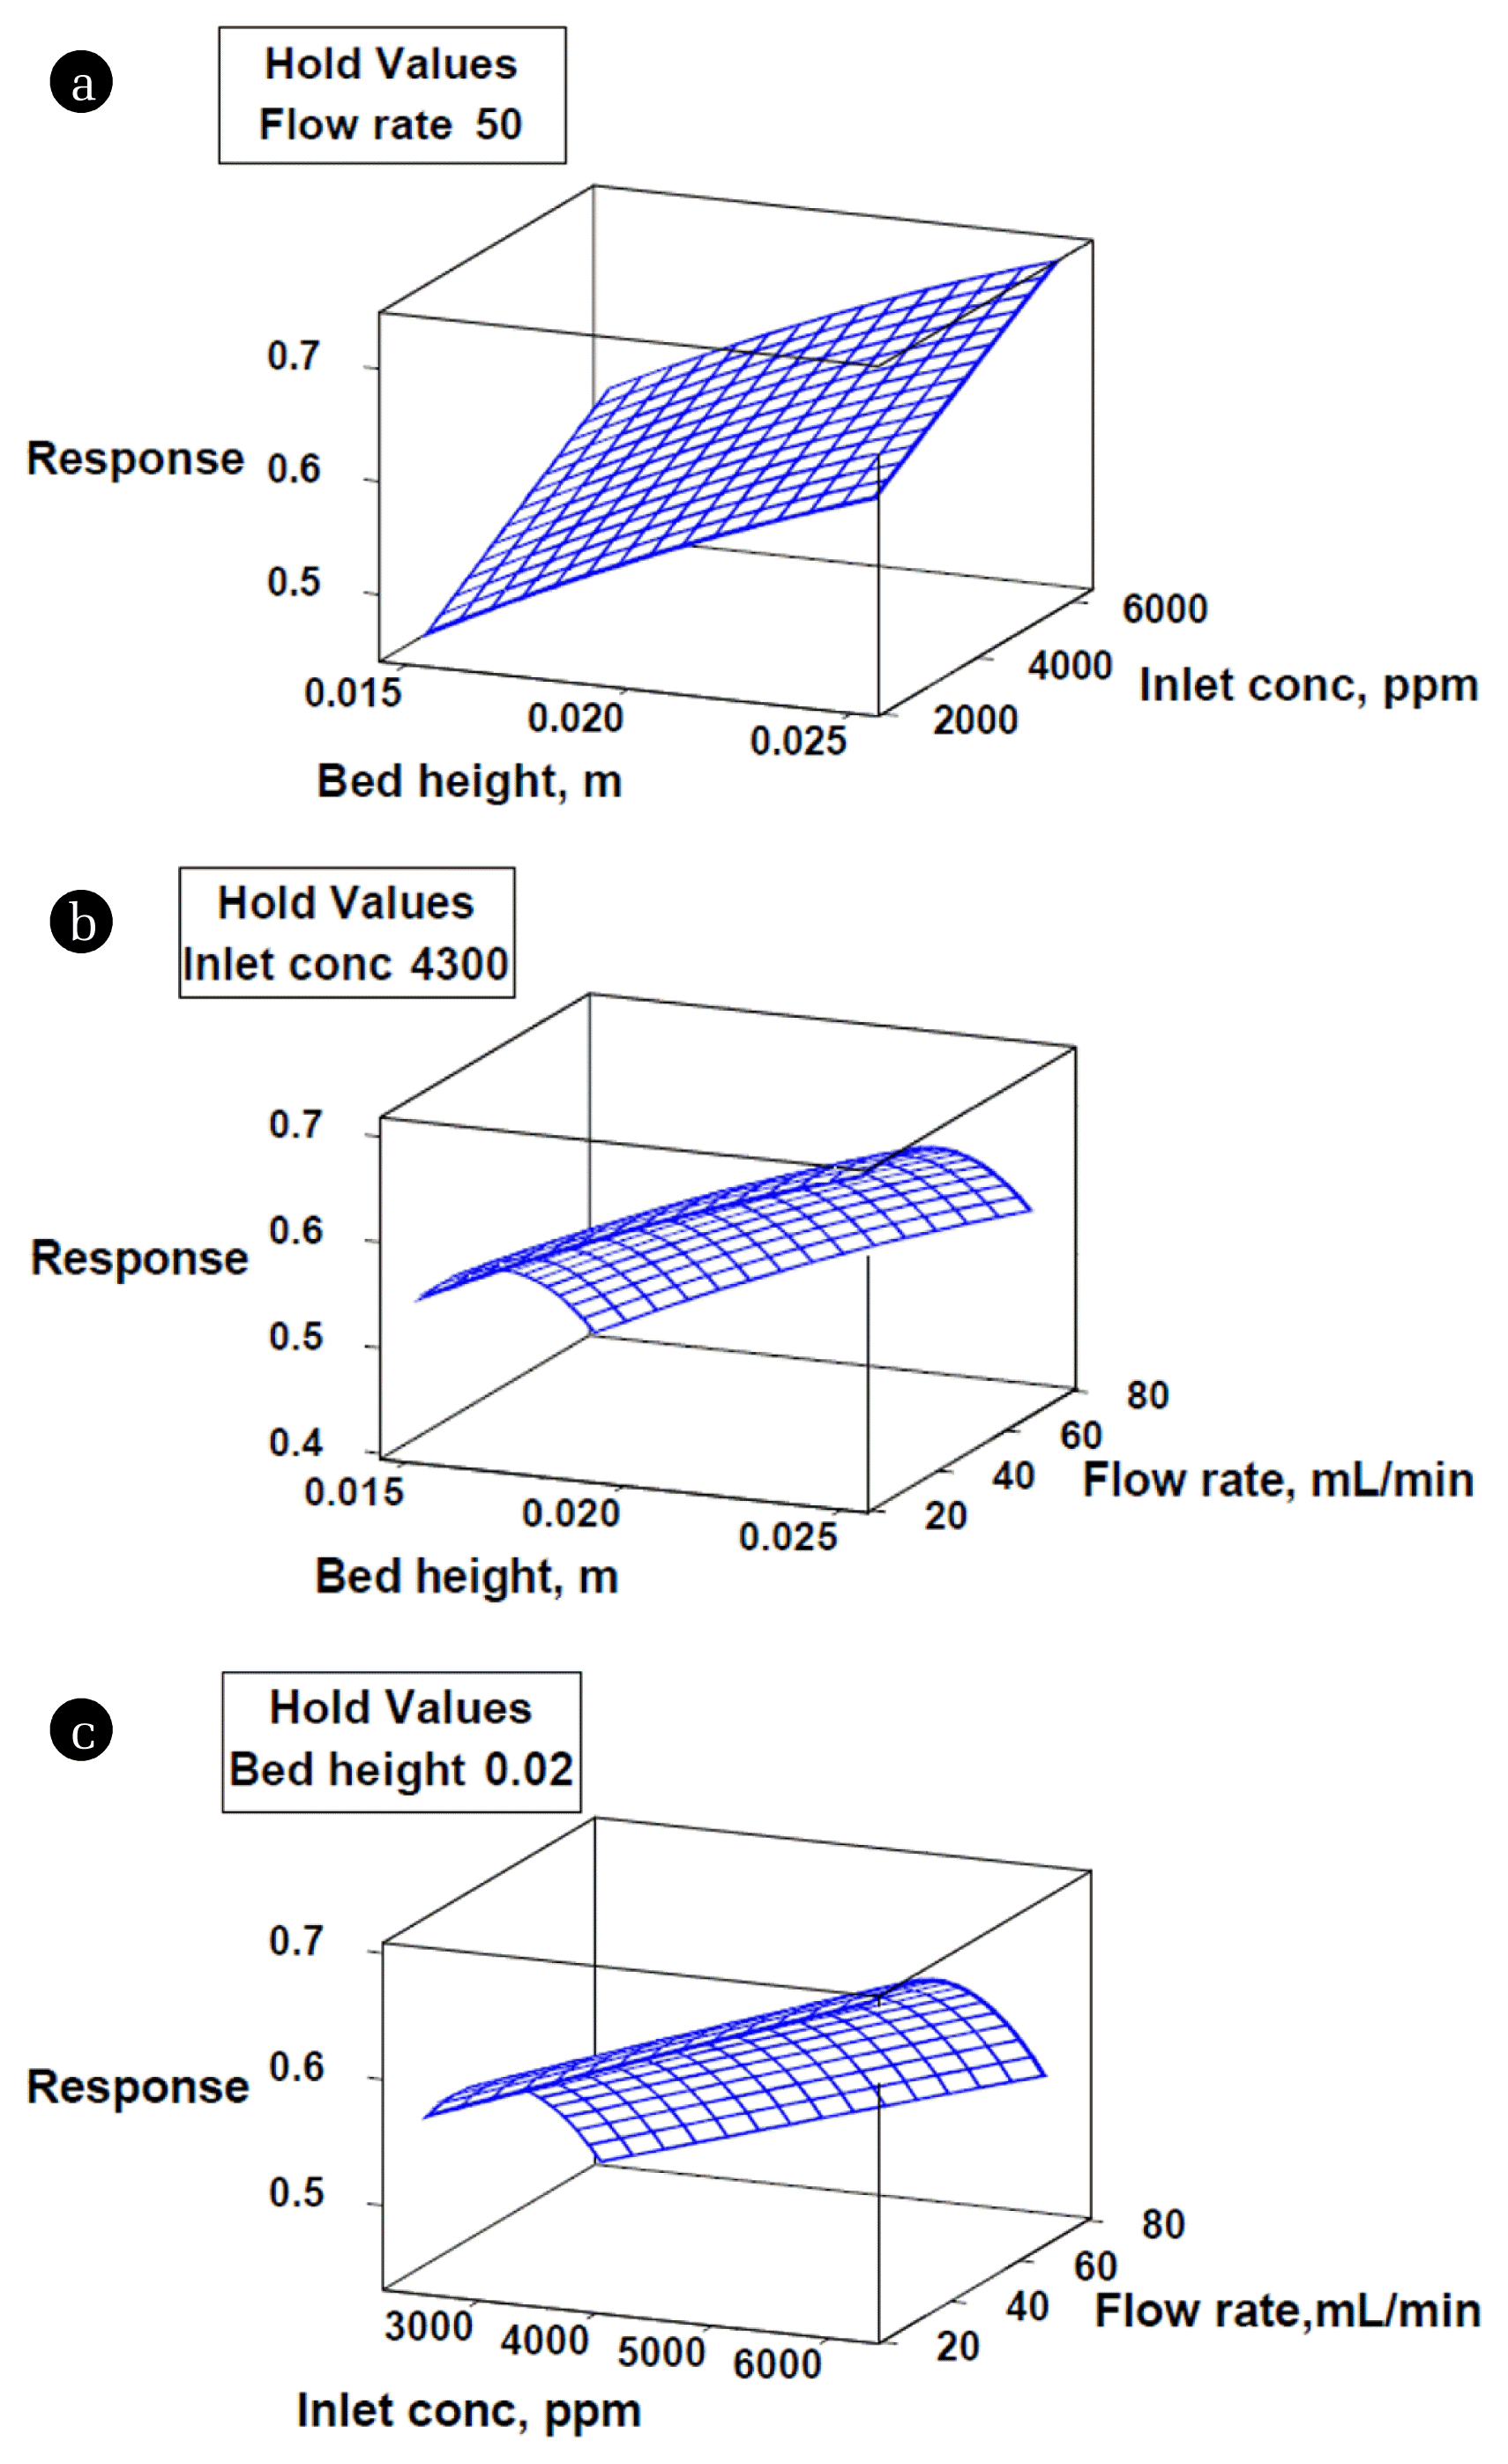
7.2. Response Surface Plots
Response surface plots were prepared with an aim to examine the effect of two independent variables simultaneously on a fraction of the bed utilized (response) by keeping the third operating variable constant.
It can be seen from Fig. 2(a) that increment in bed height at different inlet xylene concentrations resulted in the increasing trend of response and vice-versa. The percentage increase in response was observed to be greater at lower concentrations relative to higher concentrations. Also, a greater percentage increase in response was observed at lower bed heights. Fig. 2(b) illustrates greater responses with increment in bed height at various gas flow rates, but an incremental increase in gas flow rate at different bed heights led the response to decrease. Similarly, Fig. 2(c) shows the growing response with the increment in inlet xylene concentration at varying gas flow rates while response declined with the increment in gas flow rate at various inlet concentrations of xylene.
Finally, it was concluded that greater bed heights, higher inlet xylene concentrations and lower gas flow rates favored more percentage utilization of bed.
7.3. Response Optimization
Here, optimum values of operating parameters (bed height, inlet xylene concentration, and gas flow rate) were searched to enable maximum percentage utilization of bed up to breakthrough. MINITAB’s response optimizer tool was employed for this purpose which gave 76.1% as the maximum percentage utilization of the bed up to breakthrough for the following operating conditions: bed height = 0.025 m, inlet xylene concentration = 6,200 ppm and gas flow rate = 25 mL min−1. The model’s validity was further confirmed by operating the adsorption column at the above stated optimum conditions and 77% utilization of bed till breakthrough was obtained, evident of reasonably higher accuracy of the developed model. A higher value of composite desirability (0.9984) described the proficiency with which the job of finding the optimum response was performed by taking into account the different combinations of operating variables.
8. Neural Network Modeling
An artificial neural network is a well-known and established machine learning technique that belongs to the class of historical data-based methods. ANN is being widely used in the field of engineering, medicine, weather forecasting, etc. for prediction purposes, the accuracy of which is primarily dependent upon the network structure selected (topology) for the job [48]. In ANN, the neurons are elementary computing units responsible for data processing inside the network. Weights are assigned to determine the strength of the connection between neurons, which are optimized by using optimization algorithms for the best fit between input and target (output) values. The neural network in its simplest form comprises three interconnected layers of neurons namely, input layer (independent variables), hidden layer and the output layer (dependent variables). The number of neurons in the input and output layer is problem dependent, while the number of hidden layers, as well as the number of neurons in the hidden layer, can be altered to arrive at desired convergence. In general, it is suggested from the literature that one hidden layer consisting of an adequate number of neurons yield fairly good results [49]. For any neural network, its topology is imperative for accurate predictions which in turn depend upon the following factors (i) number of layers (ii) number of neurons in each layer (iii) type of learning algorithm used and (iv) transfer function [50]. In the present work, the neural network was trained by applying feed-forward backpropagation algorithm, sigmoidal transfer function (trainscg) for the hidden layer and linear activation function for the output layer, owing to their extensive employment by various researchers for optimizing the network. The sigmoidal transfer function and the linear activation function for the hidden and output layer, respectively are represented by the following expressions:
Here, three layers were utilized; input layer consisting of three neurons (bed height, inlet xylene concentration, and gas flow rate); output layer made up of one neuron (fraction of the bed utilized) and a hidden layer.
8.1. Training
The next step was to train the selected ANN architecture comprising three layers. Experimental data points are required to train the ANN model for the prediction of the output. In the present study, a total of 96 experiments were conducted by randomly selecting the following input variables; bed height, inlet xylene concentration, and gas flow rate in the range 0.015 – 0.025 m, 2,400 – 6,200 ppm and 25 – 75 mL min−1, respectively, to evaluate the fraction of the bed utilized till breakthrough. Before training, it is always advantageous to scale the input and target data to force them to lie in the same range [51]. Here, the input data (Xi) was normalized (xi) in the range of 0 to 1 by using the following expression:
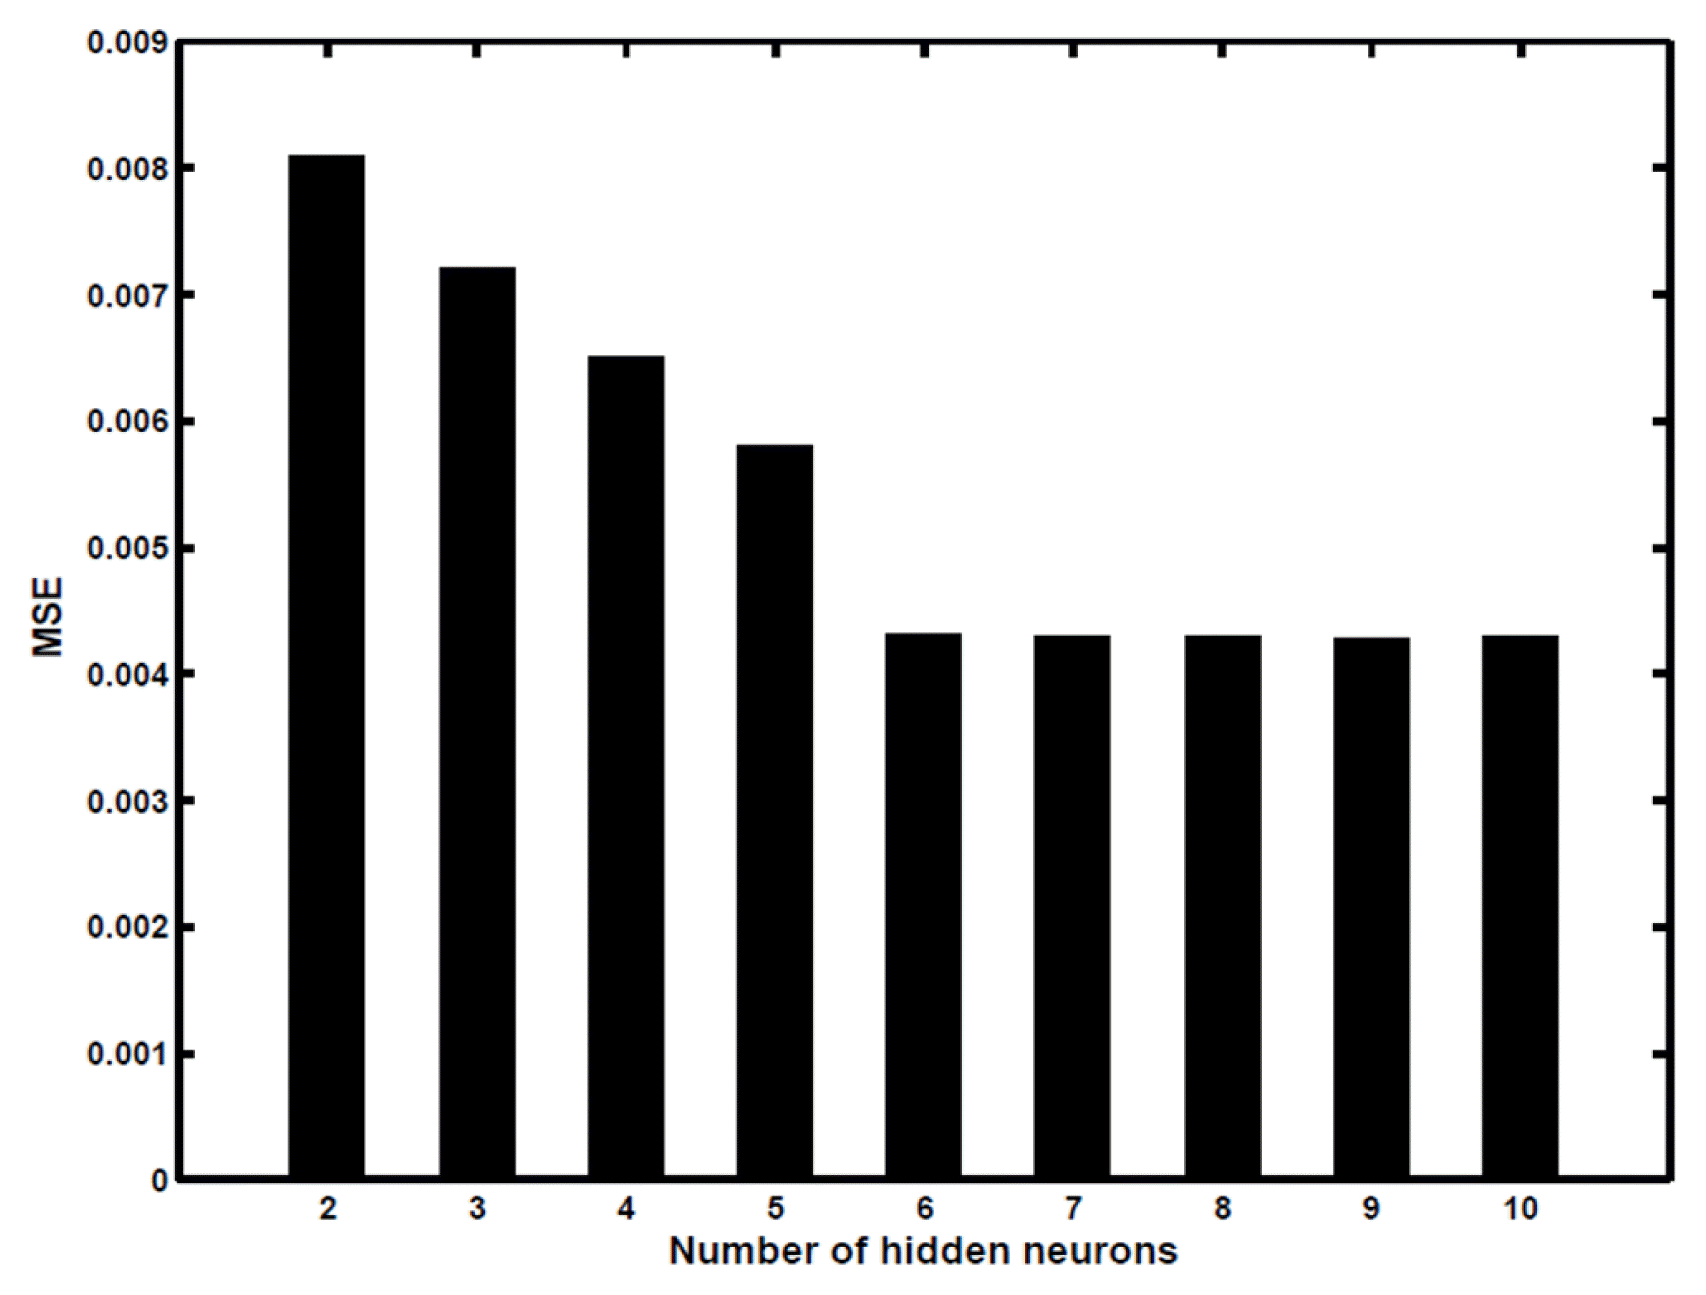
where Xmin and Xmax are the minimum and maximum values of ith input variable. In the present study, values of output variables were already between 0 and 1, hence no normalization was required for the output data. These 96 experimental data points after scaling were then subsequently fed to the ANN structure where the samples were split into training, validation and testing subsets containing 76, 10 and 10 samples, respectively in each subset. The samples for validation and testing were indiscriminately selected from the experimental data set to compute the model’s validity. Further, an optimum number of neurons in the hidden layer was assessed by testing various ANN architectures where hidden layer neurons in the range of 2–10 were varied. To prevent random correlation on account of random initialization of weights, each topology was replicated three times. The relationship between network error and the number of neurons in the hidden layer is exhibited in Fig. 3. The error function used here was mean square error (MSE), a tool to evaluate the functioning of the network [52], is given by:
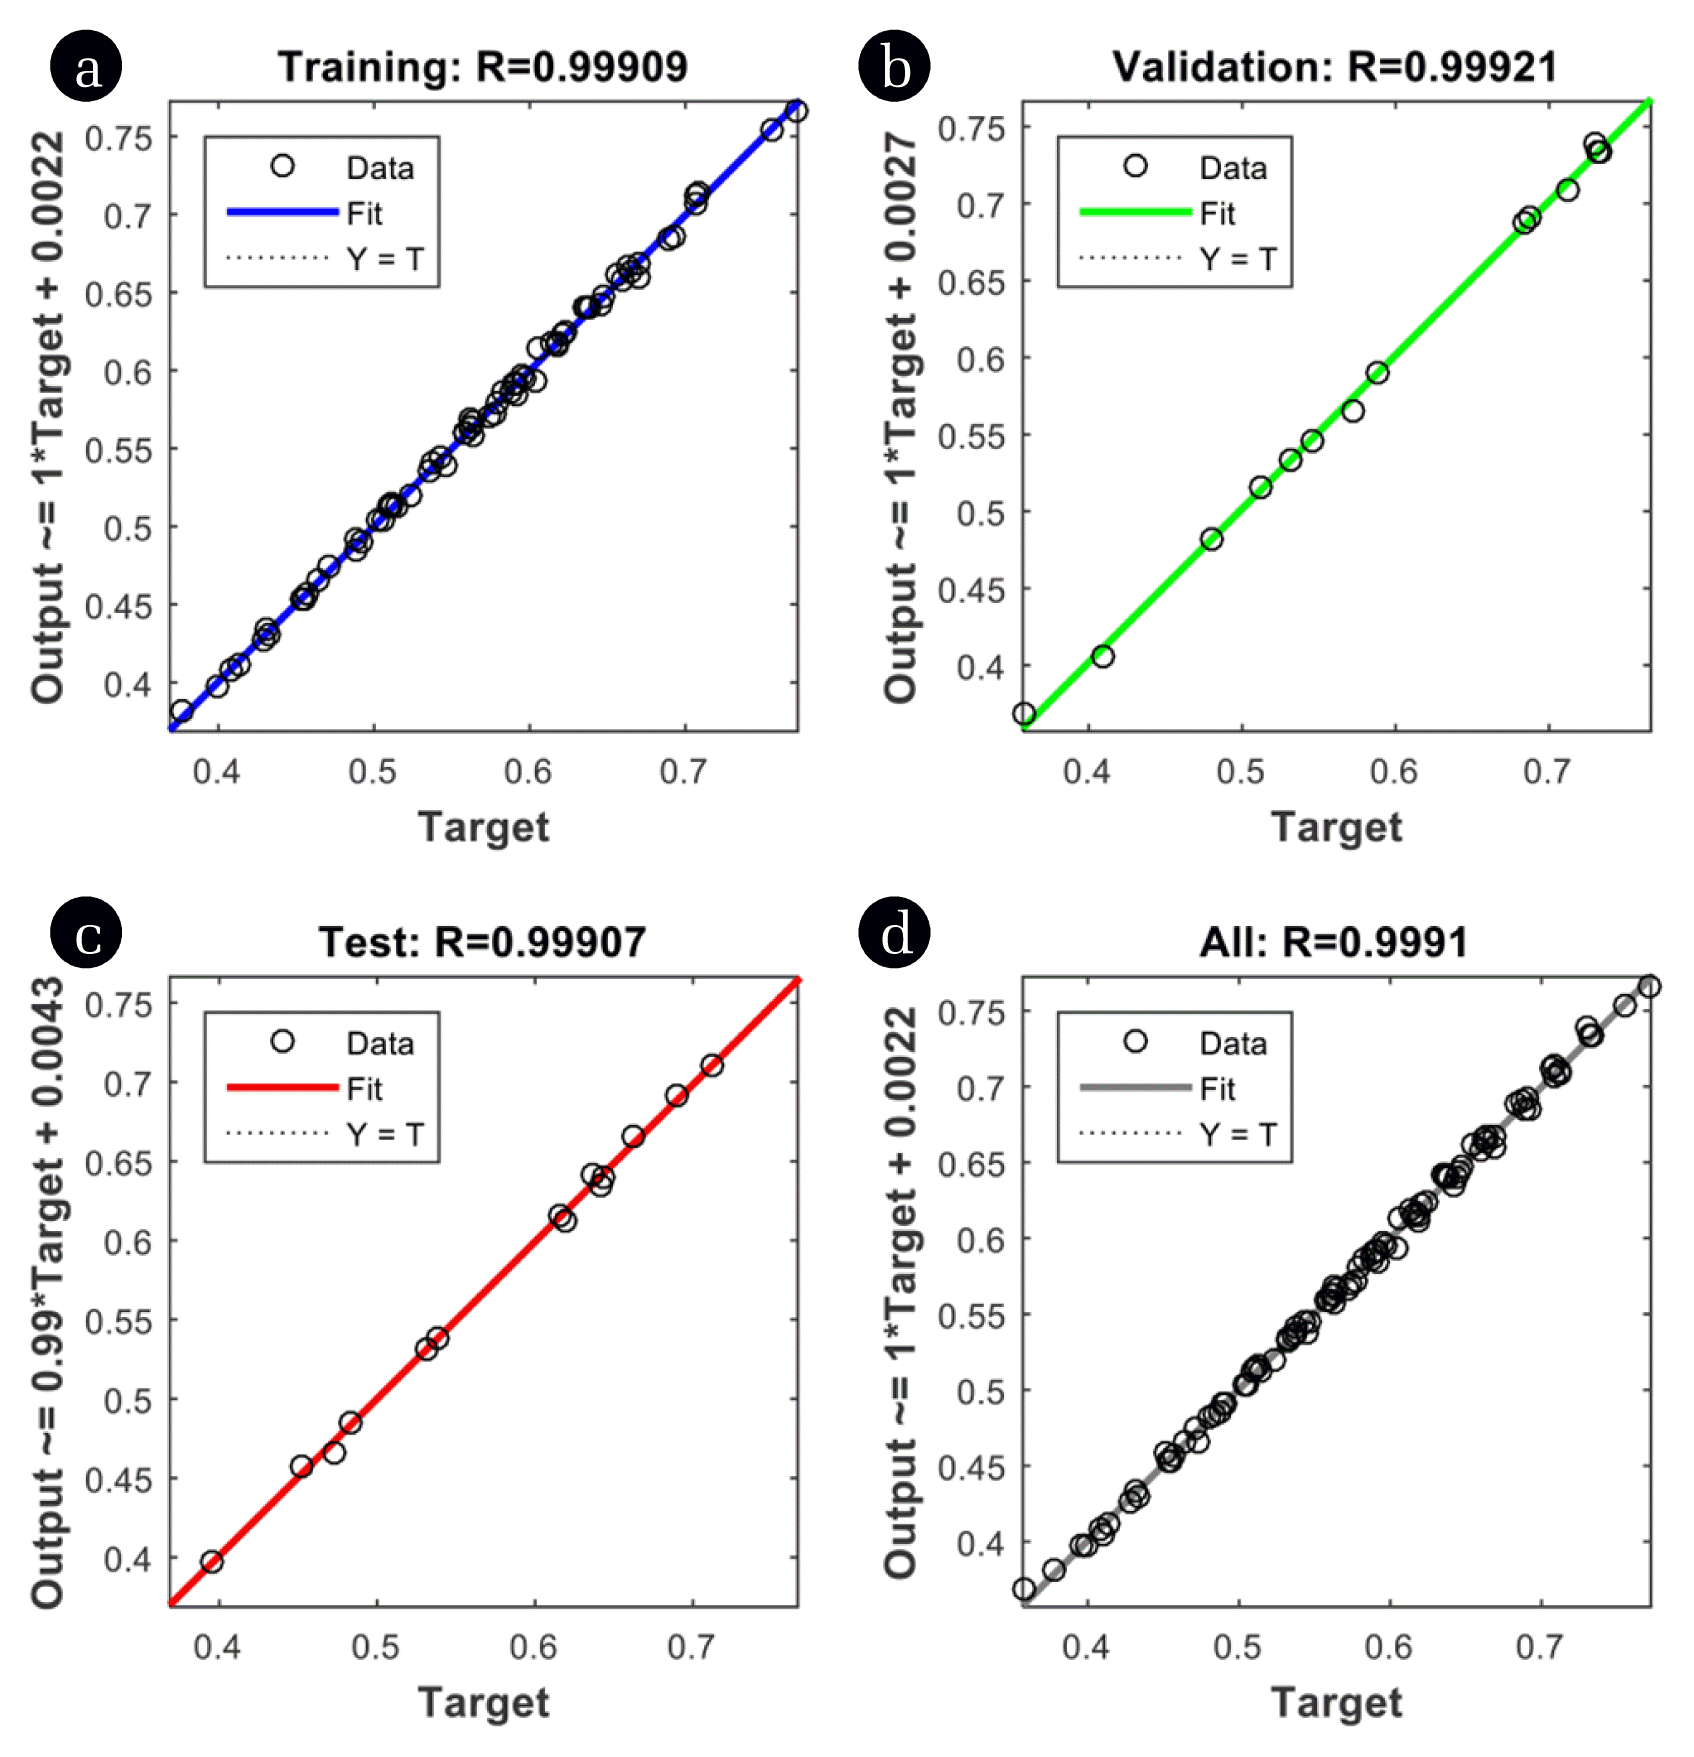
where N is the number of data points, yi,pred is the network predicted value and yi,exp is the experimentally obtained response of the ith data. It is apparent from Fig. 3 that the optimum hidden layer neurons should be six following which not much difference in network error was observed even by increasing the number of neurons, thus making the network performance stable with six neurons. On the other hand, the network could not converge effectively with a lesser number of neurons in the hidden layer. Finally, ANN topology with six neurons (Fig. S4) in the hidden layer was employed for the prediction of the output; weights for this architecture are listed in Table S4. Fig. 4 depicts the comparison between experimental and predicted output from ANN for training, validation and testing data set. The higher value of R2 (0.99907) for testing data set demonstrated the efficacy of ANN in estimating the percentage utilization of bed for the experimental range investigated in the model fitting. Matlab software (version 2015a) provided with ANN toolbox was employed to perform all the ANN calculations.
9. Conclusions
Granular activated carbon was successfully employed as an adsorbent for the isolation of xylene in a fixed bed adsorption column. An increase in bed height and inlet xylene concentration led to an increase in percentage utilization of the adsorbent bed up to breakthrough while the percentage of bed utilized to decrease with the rise in gas flow rate. This study also exhibited the use of RSM in finding out the optimal operating parameters to maximize adsorbent utilization. The results of ANOVA confirmed the validity of the proposed regression model in predicting the response. The significance of all the operating parameters investigated in this work was successfully established. Good agreement between experimental and model was visible from the value of R2 (0.993). The optimal operating conditions for achieving a maximum of 76.1% bed utilization up to breakthrough were found to be: 0.025 m bed height, 6200 ppm inlet xylene concentration and 25 mL min−1 flow rate. Moreover, the ANN technique was also successfully implemented to determine the fraction of the bed utilized at various experimental conditions. The ANN model (with three hidden layers and six hidden layer neurons) was found to perform better in comparison to RSM owing to higher R2 (0.99907) value in the case of ANN. Yoon-nelson model was found to be more suitable in predicting breakthrough curves when compared to the other kinetic models tested.