1. Introduction
Methane, an important component of greenhouse gas, is often generated at municipal landfills and petroleum-hydrocarbon-contaminated sites. Methane transport in vadose zone soils has the potential to promote vapor intrusion or create explosion hazards if its generation in the subsurface environment is unnoticed or poorly managed [1]. Adequately assessing the migration of a methane gas plume in the subsurface is important for effective strategy design and management regarding methane releases. Diffusion (dispersion) and pressure-induced advection are two primary mechanisms considered for methane transport in unsaturated soils and are traditionally described with Fick’s law of diffusion and Darcy’s law, respectively. Besides, gravitational force plays a role on vertical advection of methane because methane gas is lighter than air.
Fick’s law of diffusion may not be sufficient to describe diffusive transport of a gas mixture with very different molecular masses in porous systems, such as gas phase transport of methane-enriched air at landfills and contaminated sites. This nonequimolar effect on multicomponent gas phase diffusion in porous systems, however, is completely addressed by the Dusty Gas model (DGM) equations. The DGM represent a framework for the description of multicomponent gas transport processes in porous media. Its theoretical background was pointed out in [2]. Fen and Abriola [2] showed that there is ± 5% of difference between a DGM and Fickian-based models in predicted moles of methane within a one-dimensional (1-D) porous system at steady state and even greater differences under transient conditions for diffusion-dominated gas phase transport in high permeability soil systems. Fen and Abriola [2] also showed that the trend of the difference may be affected by the form of Fick’s law of diffusion employed in a Fickian-based model.
For vertical migration of gas mixture advection driven by total density (gas pressure) variations in space and gravitational force may exceed or contribute comparably with diffusion. Seely et al. [3] showed that only by considering gravitational acceleration in modeling the model predicted methane concentration profiles might closely agree with measured data. Our group has conducted dense gas transport experiments in a soil column for different transport configurations (horizontal, vertically upward and downward). We found that the differences in predicted dense gas concentration evolution profiles between a DGM and Fickian-based model are more substantial for upward transport, compared to the differences presented for horizontal (diffusion-dominated) and downward (advection-dominated) transport cases [4].
Methane emission and transport are often investigated at landfills and contaminated sites, e.g. [5, 6]. Model prediction is necessary for providing the migration dynamics of a methane plume through porous systems and quantifying the emitted mass of methane to the atmosphere. However, validation of modeling work with field or experimental data is rarely found for methane transport in porous systems. Seely et al. [3] conducted a series of laboratory experiments for methane transport in a two-dimensional homogeneous sand pack and compared measured steady-state methane profiles with numerical results obtained from a Fickian-type diffusion model. Williams et al. [7] used a one-dimensional advection-diffusion model to describe the combined concentration of methane and carbon dioxide in a gas plume created at an old landfill and validated their modeling work by varying gas diffusion coefficient and permeability to fit measured gas concentration profiles at various distances from the landfill boundary. Shen et al. [8] used a DGM-based numerical model to study sensitivities of pressure, temperature and permeability on methane diffusion and adsorption through shale rocks (low-permeability layers). The study of [4] recognized that gas diffusion coefficient (including tortuosity of a porous medium) and soil permeability need to be determined independently to reduce uncertainties of model parameters, since these transport parameters can significantly affect the magnitudes of diffusive and advective flux components for assessing hazardous gas (contaminant vapor) transport in porous systems.
The objective of this work is to assess the DGM and Fickian-type diffusion approaches on predicting light gas transport. Since a DGM-based model has been limited in experimental validation for multicomponent gas transport in nonhomogeneous media [2, 4], a series of transport experiments were conducted to investigate horizontal and vertically upward migration of methane-nitrogen mixture along a soil column. The experimental work presented here is a follow-up of the previous work presented in [4] with using the same soil column. Therefore, the corresponding transport parameters characterizing the soil texture and packing of the column were directly utilized in this study. Details of theoretical backgrounds regarding the Fickian-type diffusion and DGM approaches can be found in [2] and [4]. This article described the differences of the methane transport experiment from the dense gas experiment (section 2.1), highlighted the mathematical formulations of different diffusion-based models (section 2.2), summarized the required model parameters and their magnitudes (section 2.3), presented and discussed the experimental and modeling results (section 3) and made conclusions (section 4).
2. Materials and Methods
2.1. Transport Experiments
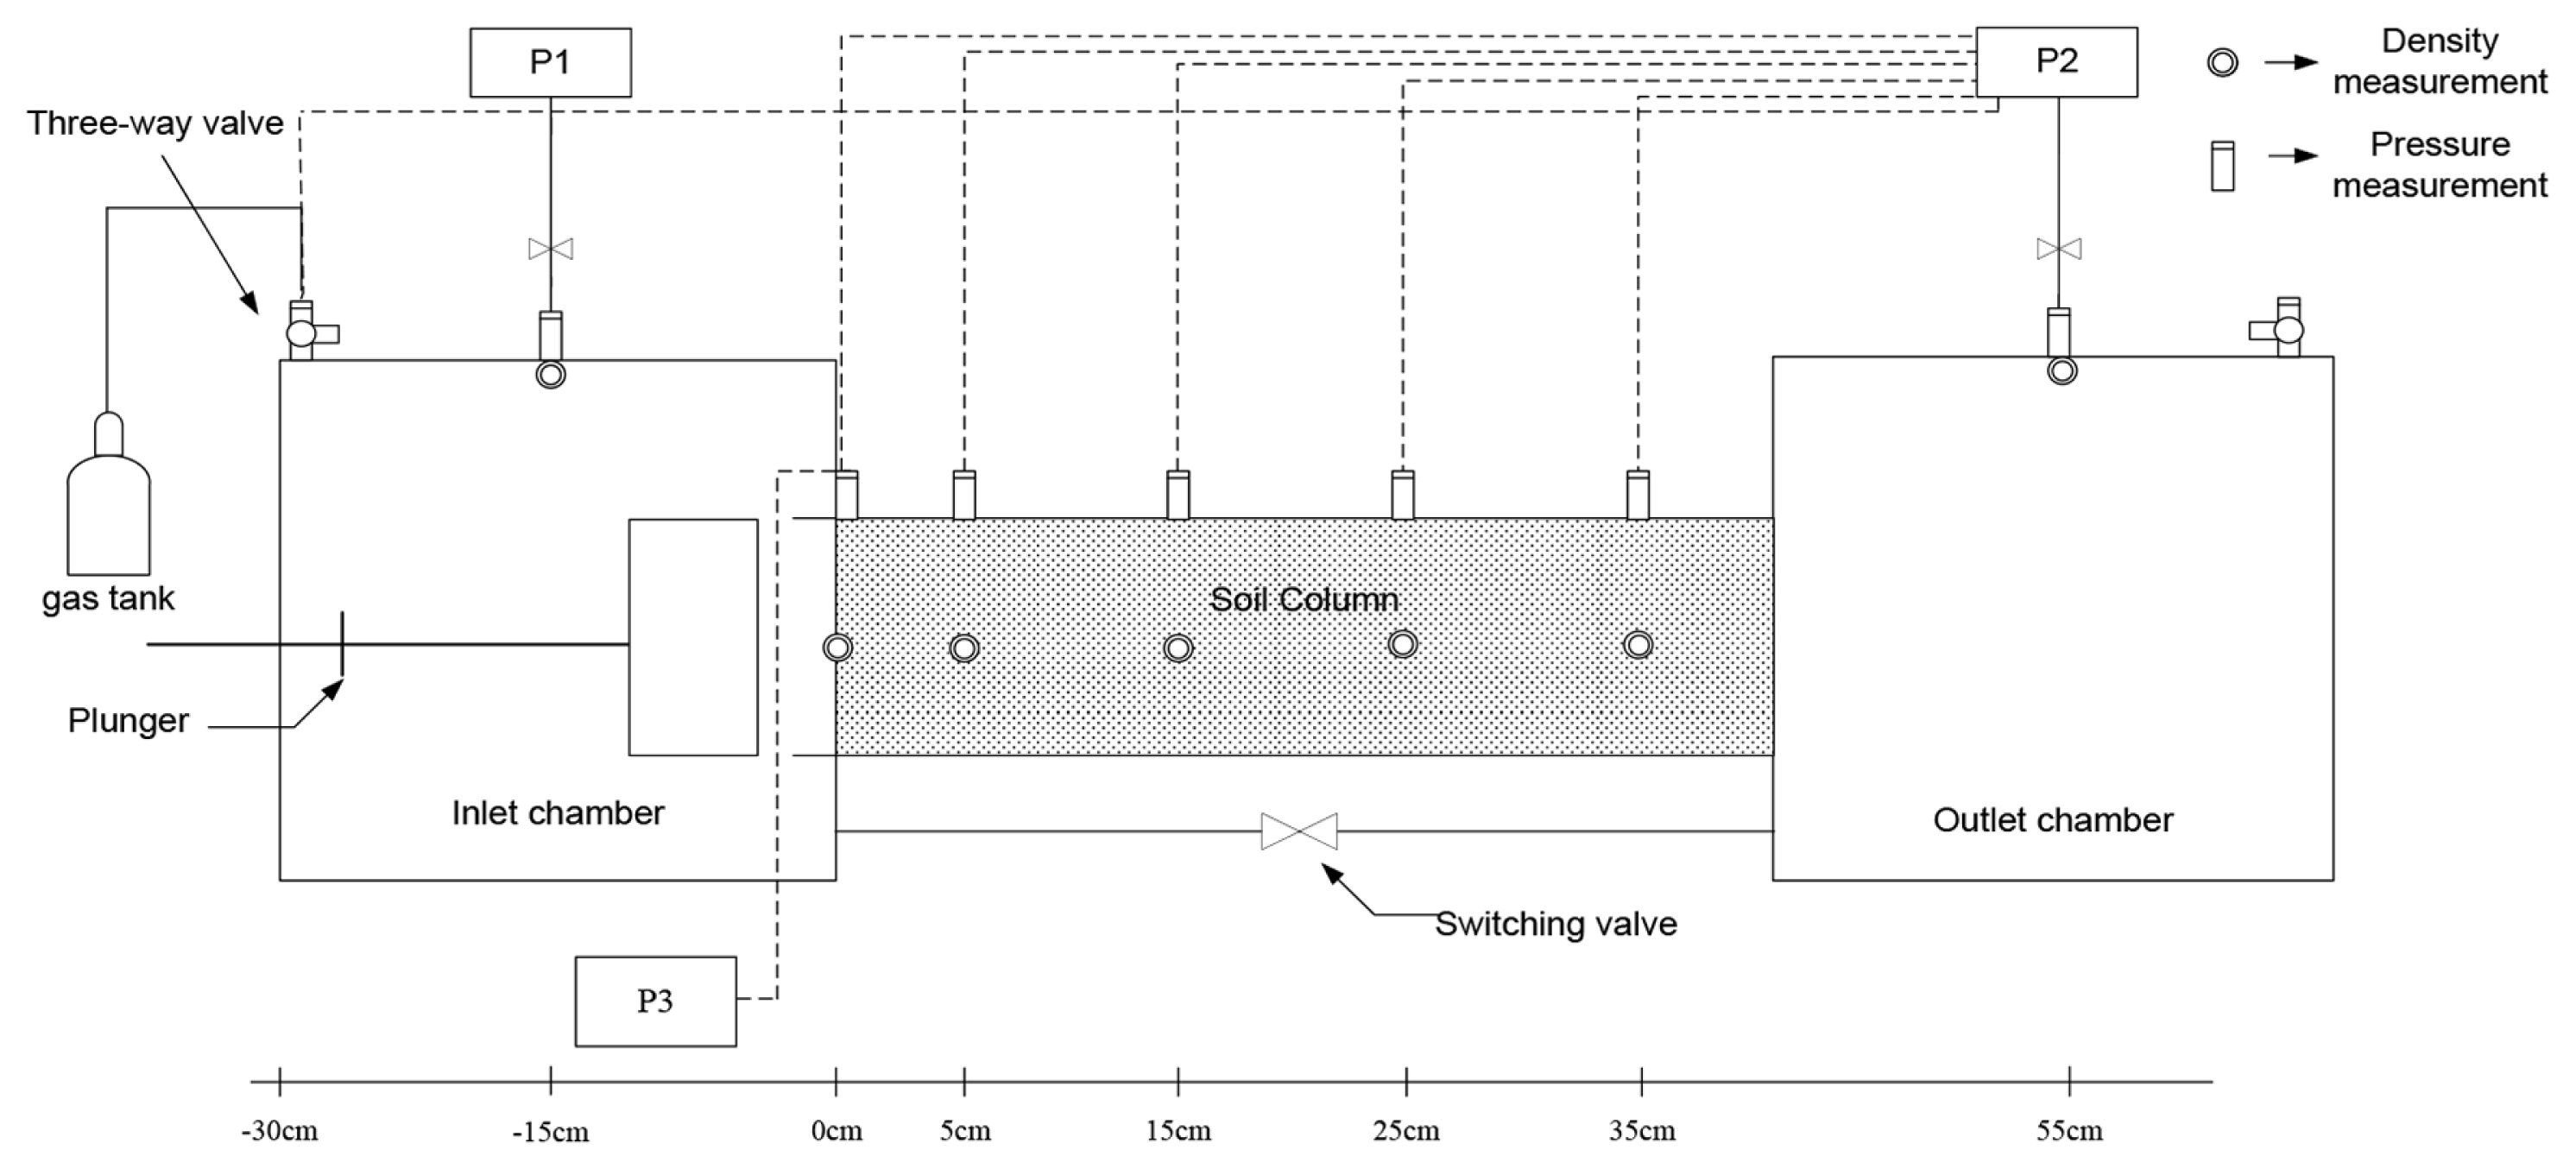
The experimental setup (see Fig. 1) for the methane transport experiment includes a soil column packed with dry sea sand and two large chambers connected at each end of the column to allow for injecting methane gas into one chamber, called the inlet chamber (IC), and maintaining nearly pure nitrogen environment in another one, called the outlet chamber (OC). The injected gas was methane other than sulfur hexafluoride (SF6) previously presented in [4]. We used methane gas (99.99%) to mix with nitrogen gas (99.99%) to form a light gaseous mixture in the IC.
Horizontal and vertically upward transport of methane-nitrogen mixture from the IC to the OC through the soil column was conducted several times. Before each transport experiment started, methane-nitrogen mixture was made in the IC and methane density, which is referred to as the initial methane source density,
, was measured with samples taken from different ports at the IC. Table 1 summarizes the magnitudes of the initial methane source density obtained for each methane transport experiment. Four data sets were obtained for the horizontal transport experiment and the corresponding
was in a range of 0.0108 to 0.0126 kg/m3. Ten data sets were obtained for the vertically upward transport experiment and were grouped into two: the first to the fourth set with
in a range of 0.0109 to 0.0118 kg/m3 and the fifth to the tenth set with
in a range of 0.0451 to 0.0523 kg/m3.
The initial methane source density was measured using a gas chromatography equipped with a flame ionization detector (GC-2014, FID-2014, Shimadzu Corp., Kyoto, Japan) and a 30-m long molecular sieve 5A GC PLOT capillary column (catalog No. 25463, Supelco). Column and detector temperatures were held at 50°C and 230°C, respectively. Nitrogen (99.999%) was used as carrier gas and flowed into the GC at a gas pressure of 28 Kpa. With a linear velocity mode and split ratio of 30 set for the GC-FID, the column and purge flow was 6.0 and 3.0 ml/min, respectively. A gas sample was injected into the GC-FID at a volume amount of 0.5 mL. The injection temperature was set at 230°C.
Gas pressure differences were recorded every half hour at the IC, OC and five ports along the soil column, i.e., 0, 5, 15, 25 and 35 cm from the IC connection to the column after the plunger was pull away from the IC face to let the methane-nitrogen gas mixture in the IC migrate into the column. Basically, for every 90 min gas samples were taken from the ports at the IC and OC and five sampling ports along the soil column. However, in order to catch the changes of methane density in the first hour of the transport, additional gas samples were taken at 15 and/or 30 min. These samples were then measured using the GC-FID. Besides, most of the samples were diluted with a 100 mL vial (2 mL sampled gas plus 98 mL nitrogen gas) before being injected into the GC-FID for analysis except for those taken from the 35-cm port and OC for the vertical upward transport experiment (the reason was explained in the next section). The pressure recordings and samplings both lasted for 6.5 h.
2.2. Mathematical Models
The DGM and Fickian-type diffusion approaches were assessed in this study. Two models were applied: one is a multidimensional, multicomponent DGM-based gas phase transport model (DGPT) developed by [9]; another is Michigan soil vapor extraction remediation (MISER), a Fickian-based model, developed in [10]. DGPT employs a set of coupled component molar balance equations (transport equations) and a total molar balance equation (flow equation) for the solution of the molar fraction of gas component i (i = 1,…, n-1) where n is the number of gas components and total molar concentration. These component and total molar balance equations for vertically one-dimensional system with a rigid porous matrix, single gas flow and no reactions and external sources/sinks are, respectively, written as [11]:
where θa is gas-filled porosity; Ci and
are the molar concentration of gas component i and total molar concentration, respectively (moleL−3); t is time coordinate (t) ; z is vertical coordinate which is directed downward (L);
and
represent the total molar flux of gas component i and total molar flux, respectively (molL−2t−1).
is the sum of total diffusive,
, and viscous fluxes,
, of gas component i . NT is the sum of total diffusive,
and viscous flux,
. For a two-component DGM equations,
can be expressed as
where Xi is the mole fraction of gas component i; R is the universal gas constant (ML2t−2T−1mol−1); T is the absolute temperature (°K); g is the gravitational constant (Lt−2);
and
are the "effective" binary molecular diffusion coefficient and the Knudsen diffusion coefficient, respectively (L2t−1). Note,
, in which
is air filled binary molecular diffusion coefficient for gas pair i and j and Qm accounting for the influence of medium tortuosity is the obstruction factor defined in the DGM. a1 = 1 − (M1/M2)1/2; M = X1M1 + X2M2, where Mi is molar mass of gas component i. Note that, the third term in Eq. (2) is deleted for horizontal transport.
The component viscous flux is usually based on Darcy’s law and expressed on a molar base as follows:
where ke is the effective gas permeability of the medium (L2); μm is the dynamic viscosity of the gas mixture (ML−1 t−1).
MISER employs coupled flow and transport equations for the solution of total pressure and the molar fraction of chemical component. The flow equation applied in MISER is on a mass base and expressed as
where ρ is total mass density (ML−3); q is Darcy velocity and implicitly representative of the mass average velocity in the total mass balance equation. That is to say, the total mass flux in the second term on the left side of Eq. (5) includes viscous but excludes total diffusive part as compared to Eq. (2).
The transport equation employed in MISER is Eq. (1) but with
expressed as
where
is the effective diffusion coefficient of the diffusing gas component i and is usually related to
by a tortuosity factor (τ) with
.
In summary, the governing equations employed in DGPT and MISER are different in the total diffusive flux expression in the transport equation, i.e., Eq. (3) v.s. Eq. (6), and the total flux expression in the flow equation, i.e., Eq. (2) v.s. Eq. (5), despite that Eq. (2) is molar-based and Eq. (5) is mass-based.
2.3. Model Parameters and Implementation
Variations of methane density with time at each sampling point were measured during each transport experiment. These measured data were compared with the predictions of DGPT and MISER. The required model parameters including soil and chemical properties and transport-related parameters are all shown in Table 2. Fen et al. [4] has reported the magnitudes of three parameters for the soil column used in this study: soil porosity, intrinsic permeability and the obstruction factor, in which the last two were independently determined by single gas flow and equimolar, binary gas diffusion experiment, respectively. The Knudsen diffusion coefficients of the gas component, nitrogen and methane (
and
), are related to soil permeability and were obtained by the correlation provided in [12] for air and the relationship of
[13]. The effective binary molecular diffusion coefficient (
) for the DGM equations was obtained by multiplying the air filled binary molecular diffusion coefficient of gas pair N2 and
with the obstruction factor (Qm). The effective diffusion coefficient of
for the Fickian-type diffusion is approximated to be in magnitude the same as the
value, since
are greater than
for more than two orders of magnitude (see Table 2 and [2]). It is not necessary to consider sorption of methane gas onto dry sea sand [3, 7]. However, the sorption can be arisen during the transport experiment due to the acrylic material that the soil column was made of [4]. Thus, a retardation factor was introduced into the models as a model calibration parameter for a better fit between the predicted methane gas density evolution profile and the measured data. As a result, only one parameter, the retardation factor, was calibrated in the modeling work.
Since several methane transport experiments were conducted at similar magnitudes of the initial methane source density for each transport configuration, the upstream source boundary conditions for model simulation (modeled
or molar fraction of methane gas,
) might be assigned according to the averaged experimental conditions. As a result, we have three simulation cases: H stands for the horizontal transport case and intends to mimic the first to the forth data set obtained from the horizontal transport experiments; VH1 and VH2 stand for the vertically upward transport case 1 and 2, respectively, and intend to mimic the first to the fourth and the fifth to the tenth data set of the vertically upward transport experiments, respectively (see Table 1). Table 1 shows the modeled
(or
) corresponding to the averaged, measured
for each simulation case. The differences in magnitudes between the measured and modeled source density were explained in the next section. Discretization of model domain, time step size, settings of the boundary and initial conditions for the methane transport simulation were similar to those presented in [4].
3. Results and Discussions
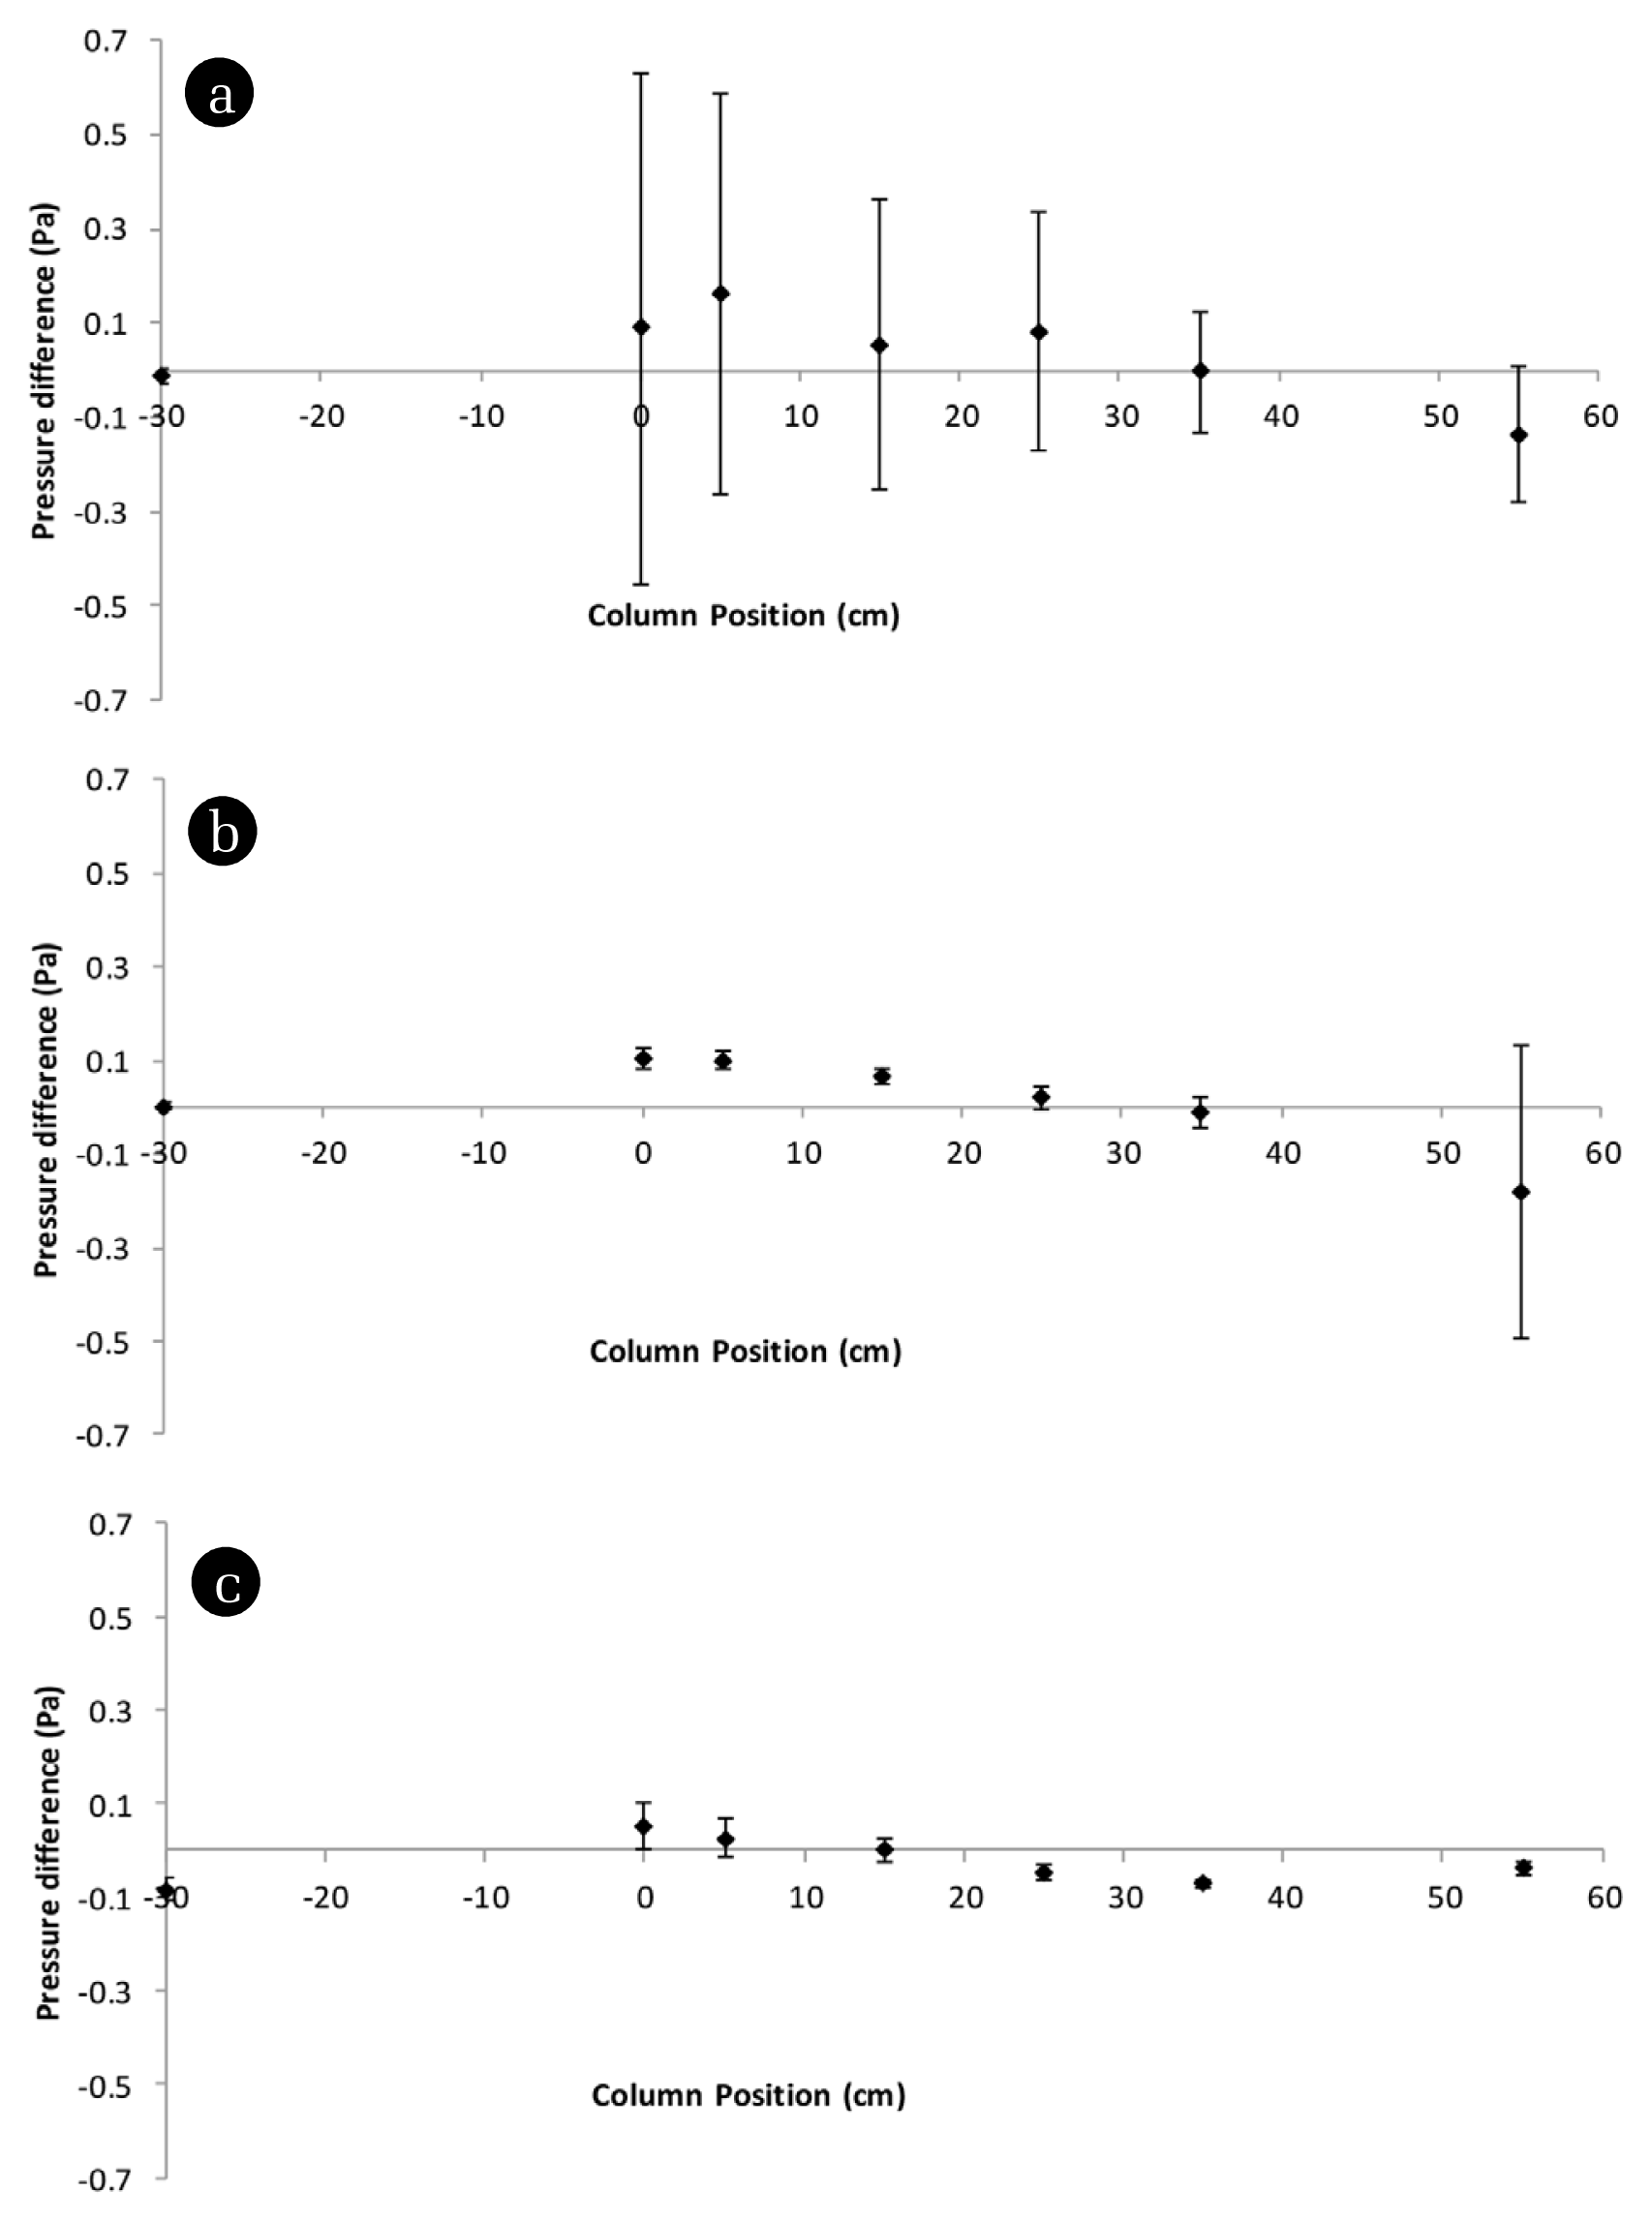
3.1. Variations of Pressure Differences
Fig. 2 presents the variability of pressure differences observed at each point for each transport configuration at different ranges of magnitudes of the initial methane source density. The pressure difference presented in the figure is gas pressure relative to the outside pressure of the system, i.e., atmospheric air pressure. A negative pressure difference indicates the gas pressure in the system is lower than the outside one and vice versa. For the horizontal transport experiment the pressure differences observed at each point along with time were substantially varied, especially at the 0-cm point, i.e., entry from the IC to the column. The averages of the pressure differences were, however, less than 0.2 pa at each point. For the vertically upward transport experiment, the pressure differences observed at each point were not varied a lot and were less than 0.1 pa in magnitude. These results showed that the pressure responses for methane transport are far less than the observed ones for dense chemical gas transport, especially at the points near IC in the soil column (see Figs. 2, 3 in [4]). Besides, a reversed pressure response was presented for upward transport, i.e., positive pressure evolution for light gas transport in the column and negative for dense gas transport (see Fig. 3 in [4]). It is interesting to observe that at the OC the pressure differences were varied a lot along with time for the vertically upward transport experiment at a small methane source density.
The parameters presented in Table 2 were employed in DGPT and MISER to simulate methane transport in the soil column. DGPT predicted an increased pressure along the column and MISER predicted no internal pressure variation for the horizontal transport case. For vertically upward transport, increased pressure in the soil column was predicted by both models and the resulting pressure responses followed the same trend as the observations. However, for both transport configurations pressure variations predicted in the column along with time were negligibly small, i.e. < 0.1 pa. Accordingly, the predicted viscous flux components induced by these pressure variations were negligibly small.
3.2. Methane Density Evolution
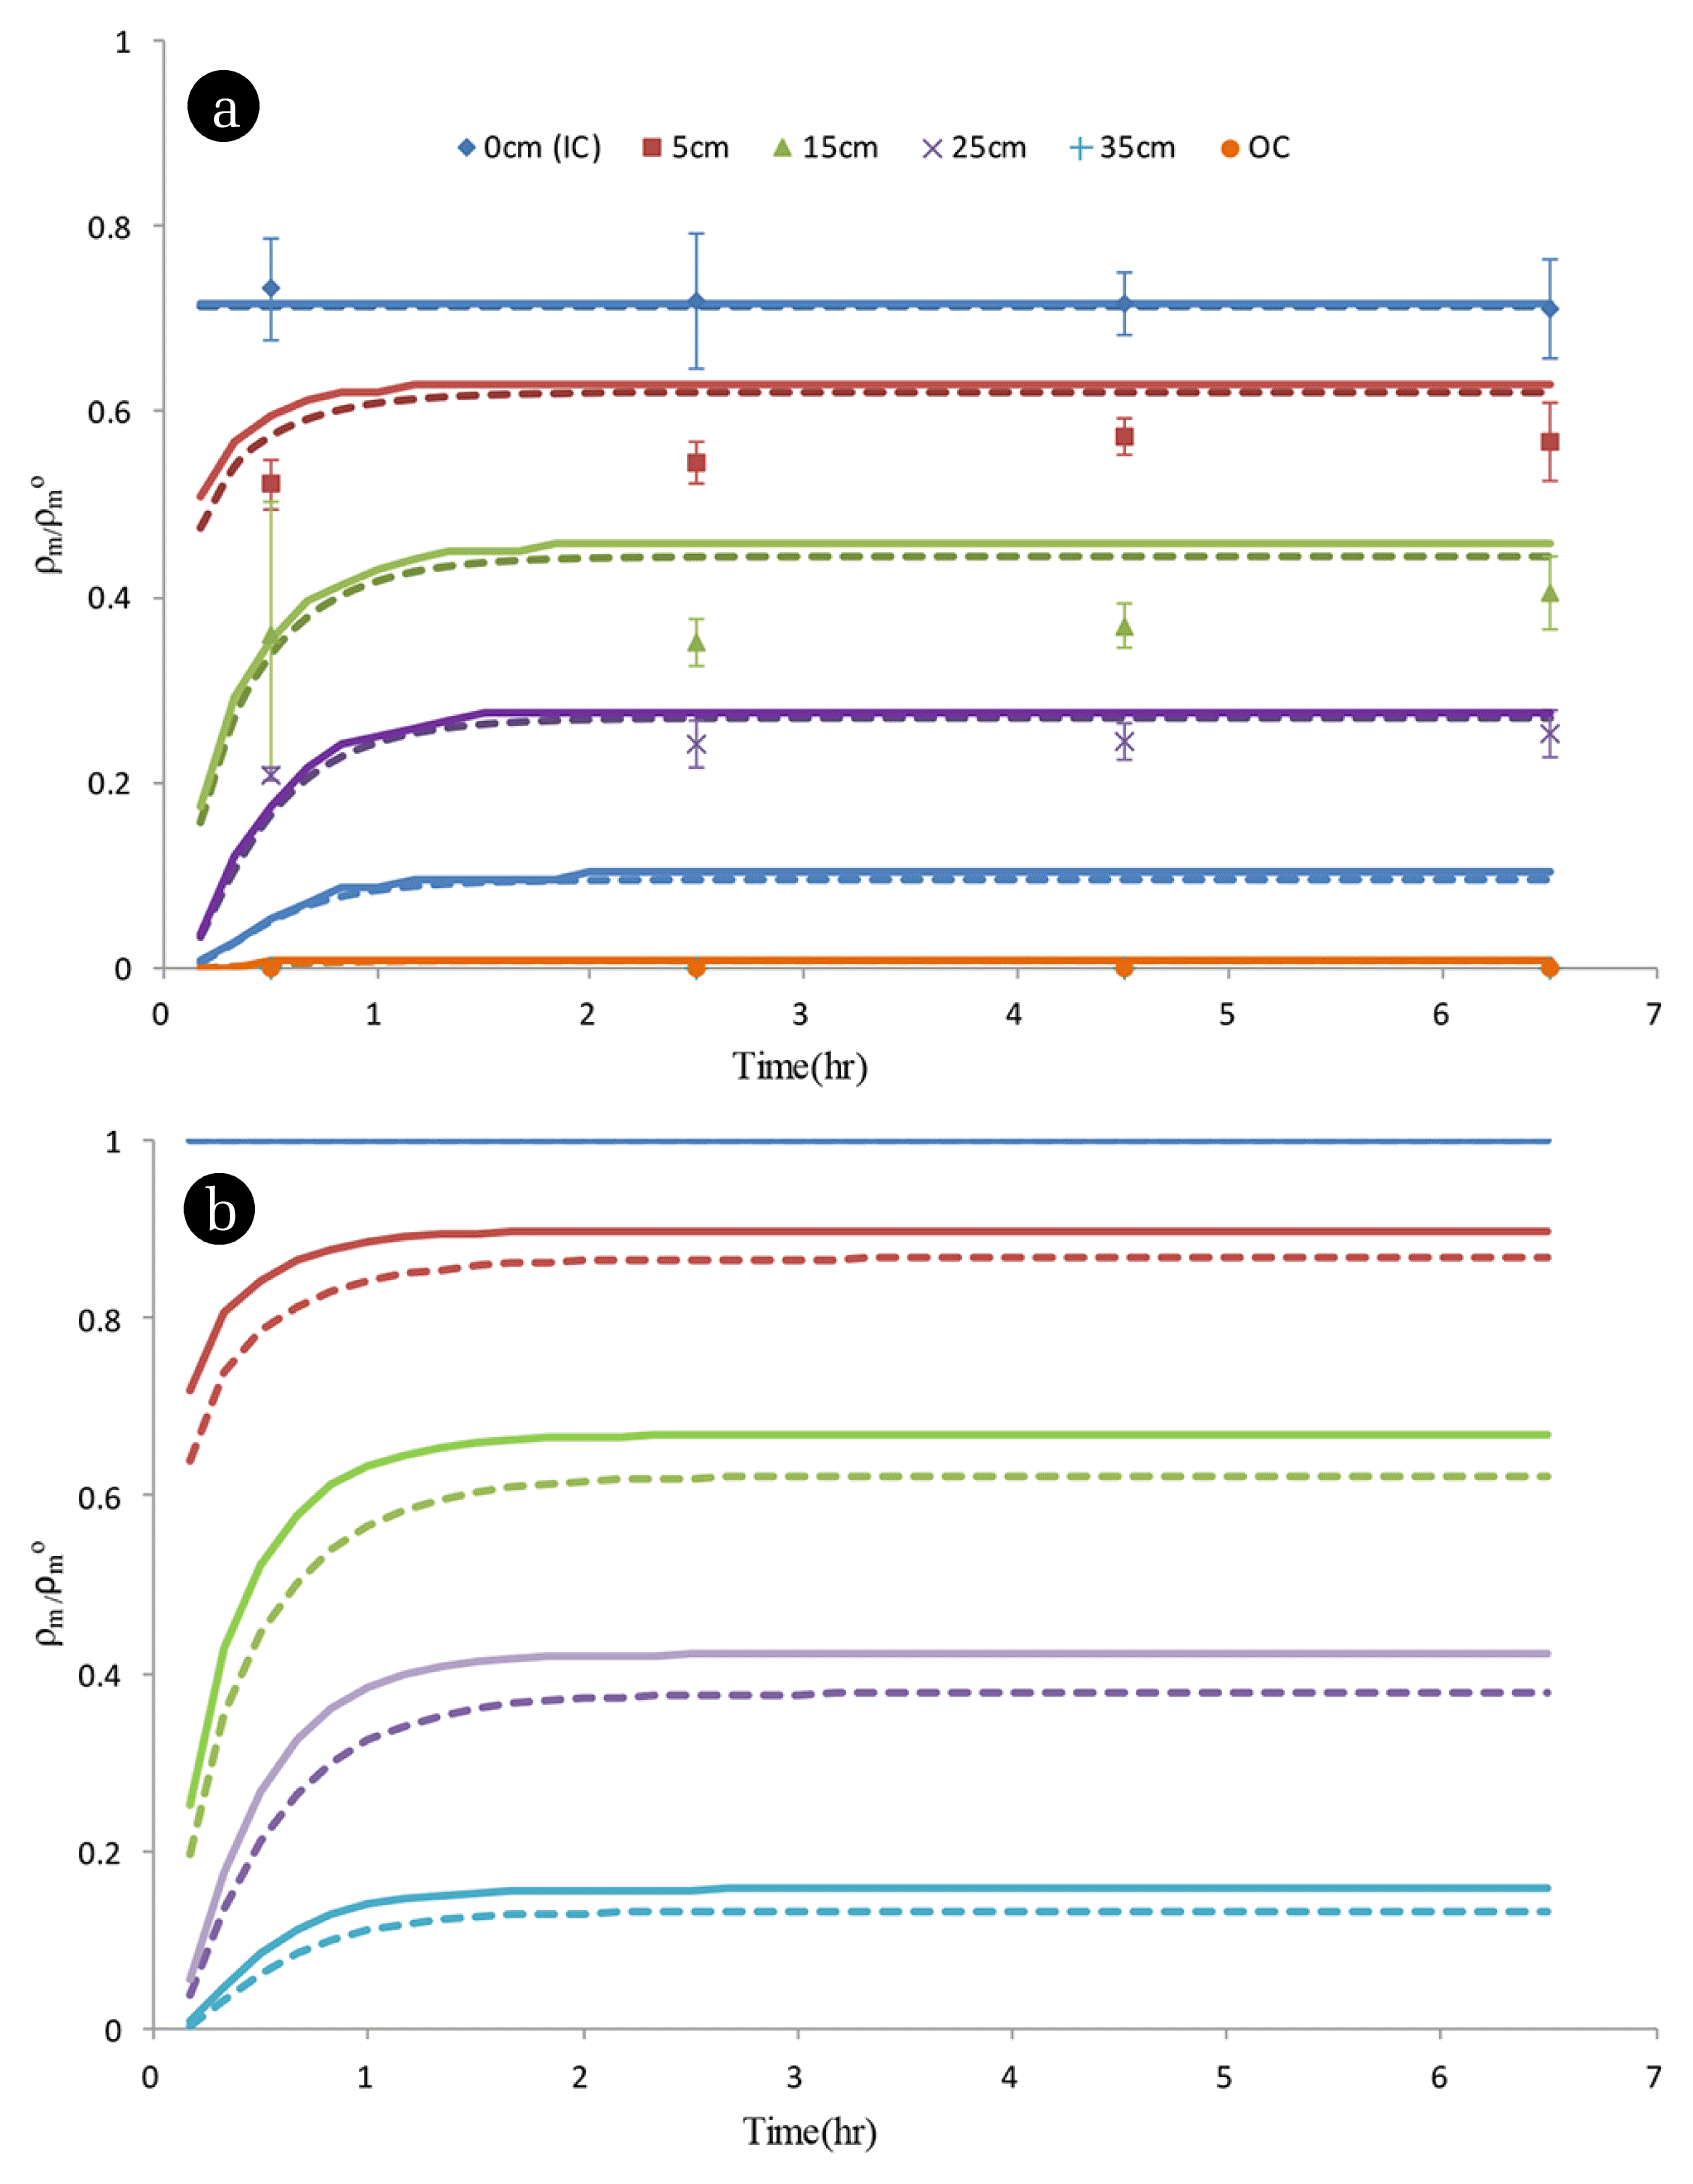
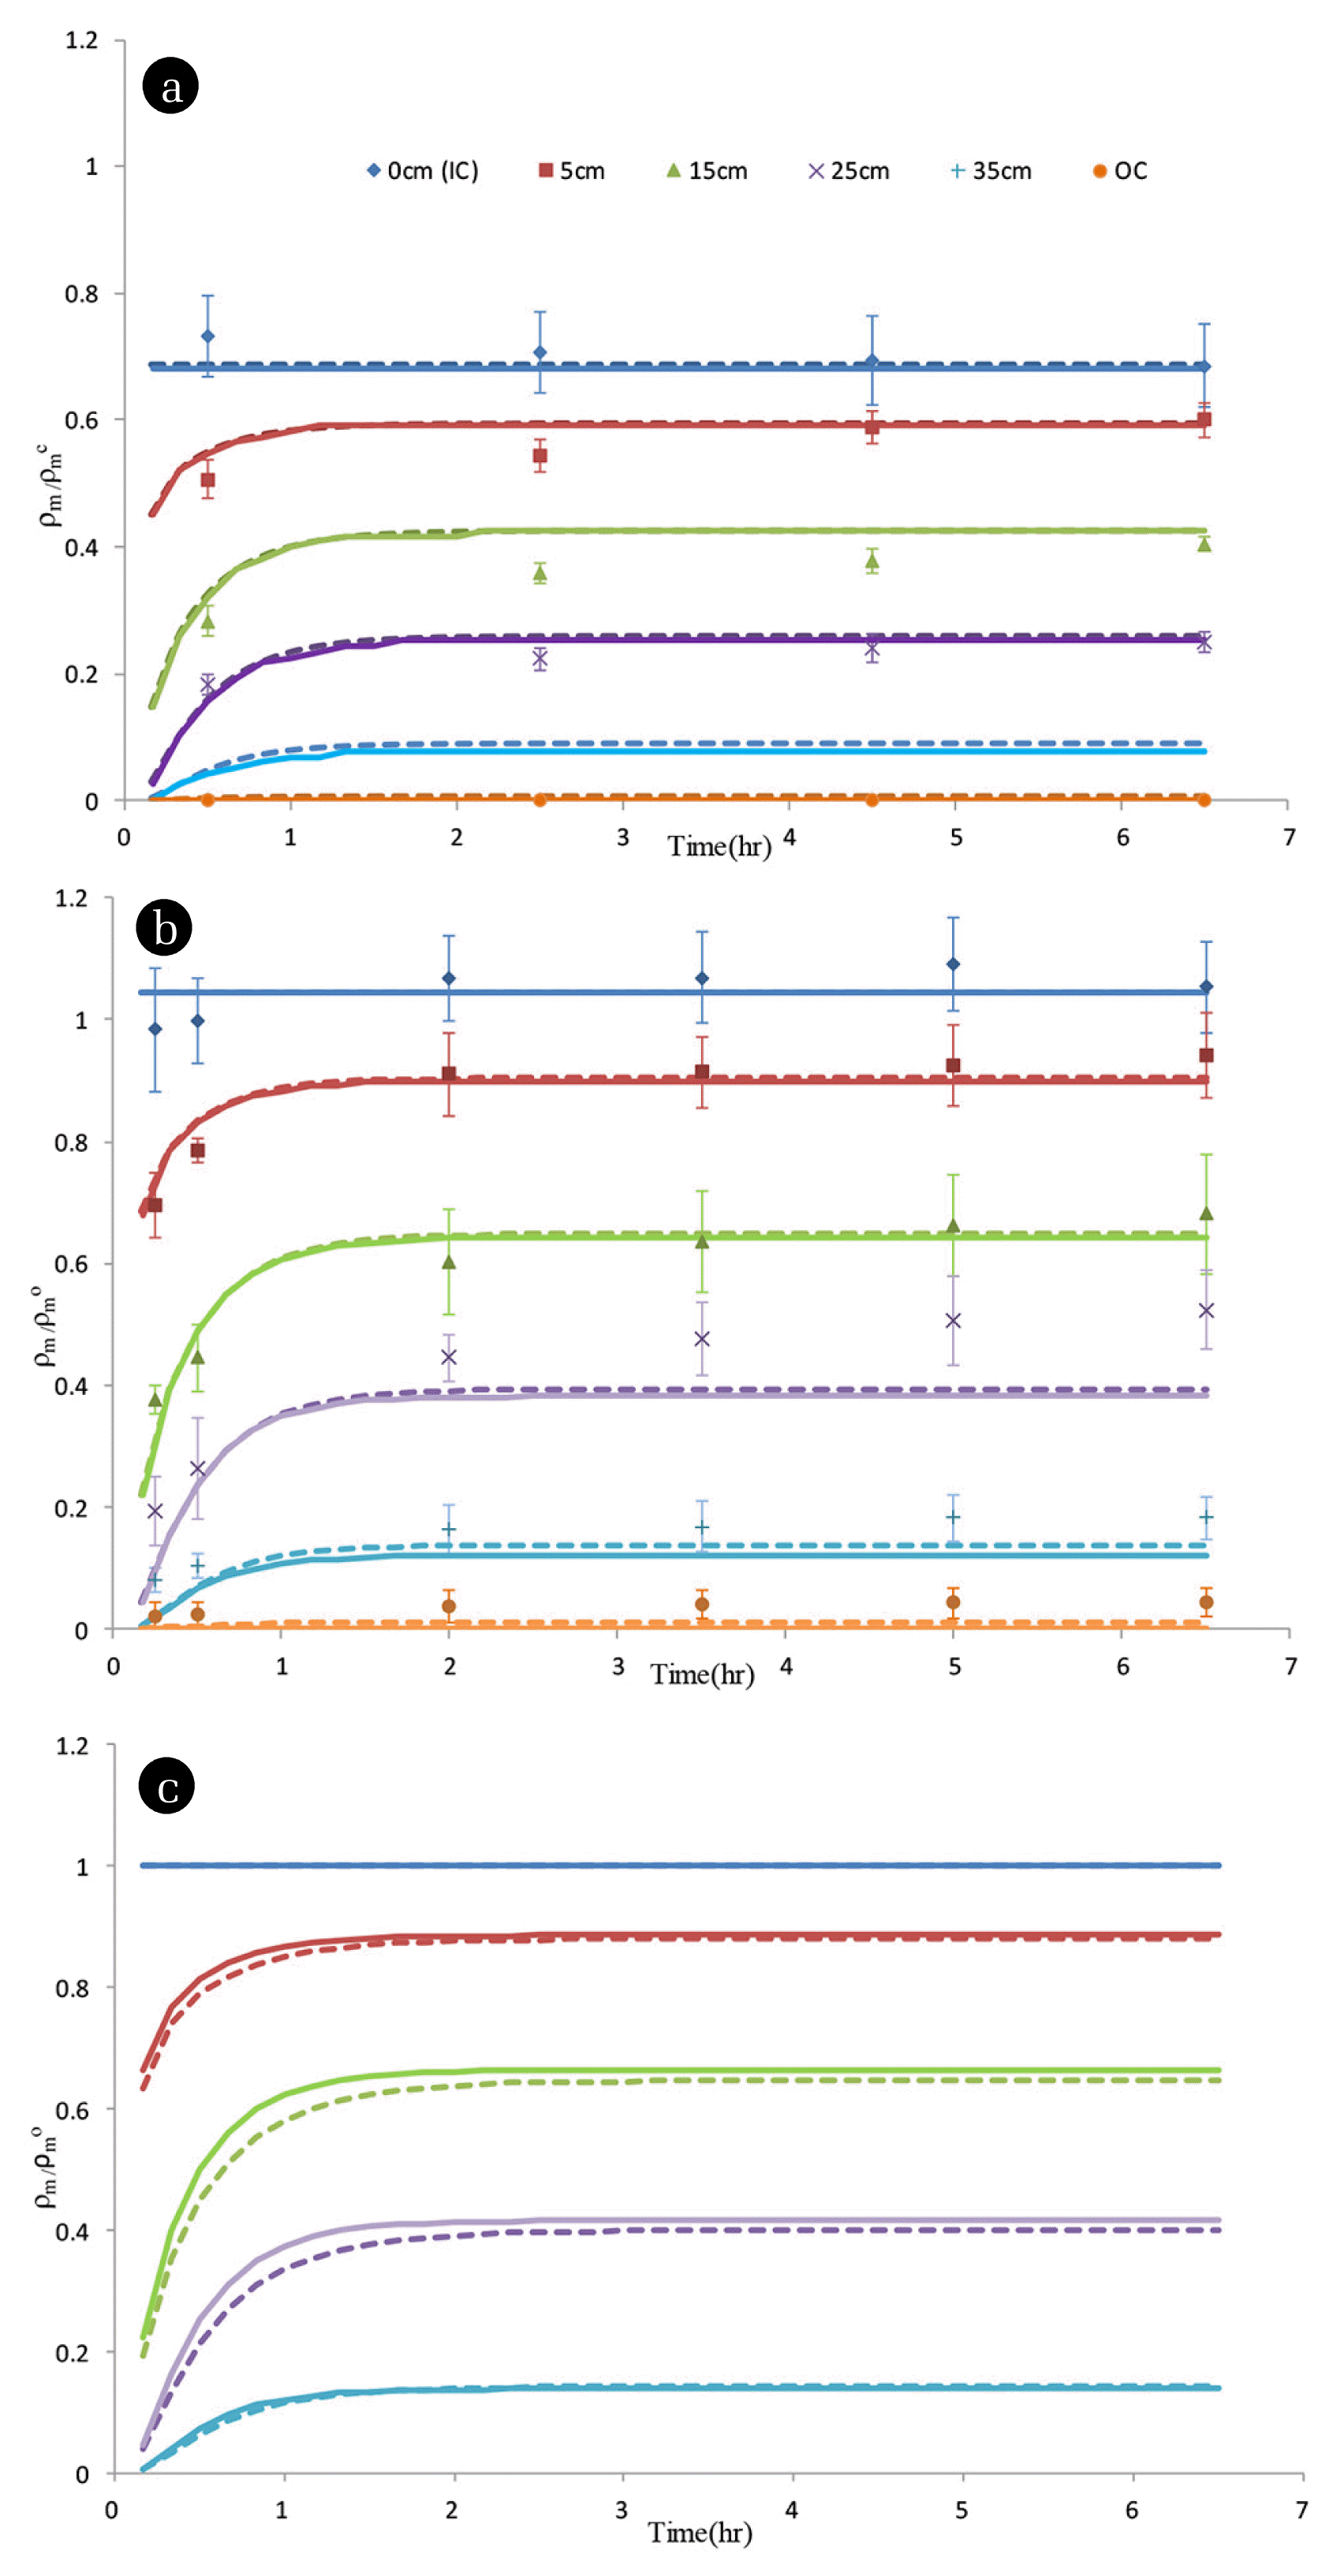
Figs. 3 and 4 present the time-varied measured data of methane density along the column during the horizontal and vertically upward transport experiments, respectively. In these figures, the data obtained from the IC and the 0-cm port were lumped because their differences are small. Relative methane densities (
) are the ratio of the methane density measured at a sampling point and time and the initial source density (averaged value of measured
in Table 1). The error bars represent the variability of the multiple measured results from a sampling point at a sampling time. It showed that the methane density measured at the 0-cm point (and at the IC) during the transport experiment is less than the initial methane source density (averaged
) for more than 20% as presented in Figs. 3(a) and 4(a) for the measured
is in a range between 0.0108 and 0.0126 kg/m3. This difference reflects variability of the source condition during the transport experiment and needs to be considered as a boundary condition in model simulation. At a higher methane source density (Fig. 4(b)), however, the methane density measured at the 0-cm point (and at the IC) during the experiment is not deviated from the averaged
a lot for vertically upward transport. Besides, the methane densities measured at the OC were all very close to zero, except for the results obtained from the upward transport experiment at high methane source densities (see Fig. 4(b)).
The methane density evolution profiles predicted by the models were compared with the measured data as presented in Figs. 3 and 4. Figs. 3(a), (4a) and 4(b) showed that the predicted methane density profiles at the 25-cm point, at the 5-cm, 15 and 25-cm points and at the 5 and 15-cm points, respectively, were fairly consistent with our observations. These predictions were obtained by using the parameter values presented in Table 2 in which the only one model calibration parameter is the retardation factor. We assigned a value of 1.9 for this factor which made the shape of the predicted profiles in the first 1 hour consistent with the measured ones. Differences between the model predictions are not substantial for these cases because the corresponding methane source density is low. Besides, for each transport configuration, the methane density evolution profile at each point approached steady state after the transport started for 2 h. We further examined the model prediction with a higher methane source density, i.e., pure methane source (modeled
), for each transport configuration as presented in Figs. 3(b) and 4(c). These predictions showed that the methane density evolution profiles predicted by DGPT were ahead of the ones predicted by MISER, especially at most 15% of difference in predicted steady-state methane density at the 35-cm point (the farthest sampling point in the column) for the horizontal transport case. This difference is not arisen from different pressure variations predicted by these models (because they are negligibly small), but from different forms of diffusive flux adopted by these models (the first term in Eq. (3) v.s. Eq. (6)). Fig. 4(c), however, shows less difference of the methane evolution profiles between the model predictions for the vertically upward transport case. We suspected that the gravitation-induced viscous component (the second term in Eq. (4) considered in both models) dominates over the diffusive one for upward transport of methane. On the contrary, for dense gas transport presented in [4], because diffusion and advection are equally important, substantial differences between the model predictions were shown for upward transport even at low source density of dense gas.
4. Conclusions
In this study, DGPT and MISER were calibrated only based on one parameter, retardation factor, for methane transport in a 40-cm soil column because the previous work [4] has obtained the magnitude of soil permeability and obstruction factor in individual experiment with soil columns packed with the same soil materials and in similar magnitudes of soil porosity. As a result, the contribution of diffusive and viscous flux components on methane transport in porous systems under different transport configurations could be delineated. The results showed that both models adequately predict the observed methane density profiles for the vertically upward transport cases at a methane source density less than 0.0485 kg/m3, as the system responded with small positive pressure variations to methane transport and reached steady state in two hours. Besides, both models predicted similar methane density profiles for upward transport of methane from a pure methane source. It implies gravitation-induced viscous flux component dominates over the diffusive one under this scenario and a Fickian-based model is adequate for predicting upward transport of light gas in porous systems. For horizontal transport at a low source density DGPT and MISER over predicted the methane densities. We suspect it is due to incomplete mixing of gas mixture in the IC during the experiment since high pressure variations were observed in the horizontal transport experiments. This study further showed that the methane density profile predicted by DGPT is over the MISER result for at most 15% of difference in methane densities for horizontal transport of methane from a pure methane source. This difference is arisen from different diffusive components predicted by these models and implies that a Fickian-based model may under predict methane density for horizontal transport of a methane plume and the degree of under predictions increases with the increase of the methane source density.